Answered step by step
Verified Expert Solution
Link Copied!

Question

1 Approved Answer

I need assistance with creating a scatter plot with the below data? (the bold bullet above is what I need answered.) Descriptive Statistics Mean Std.

I need assistance with creating a scatter plot with the below data?
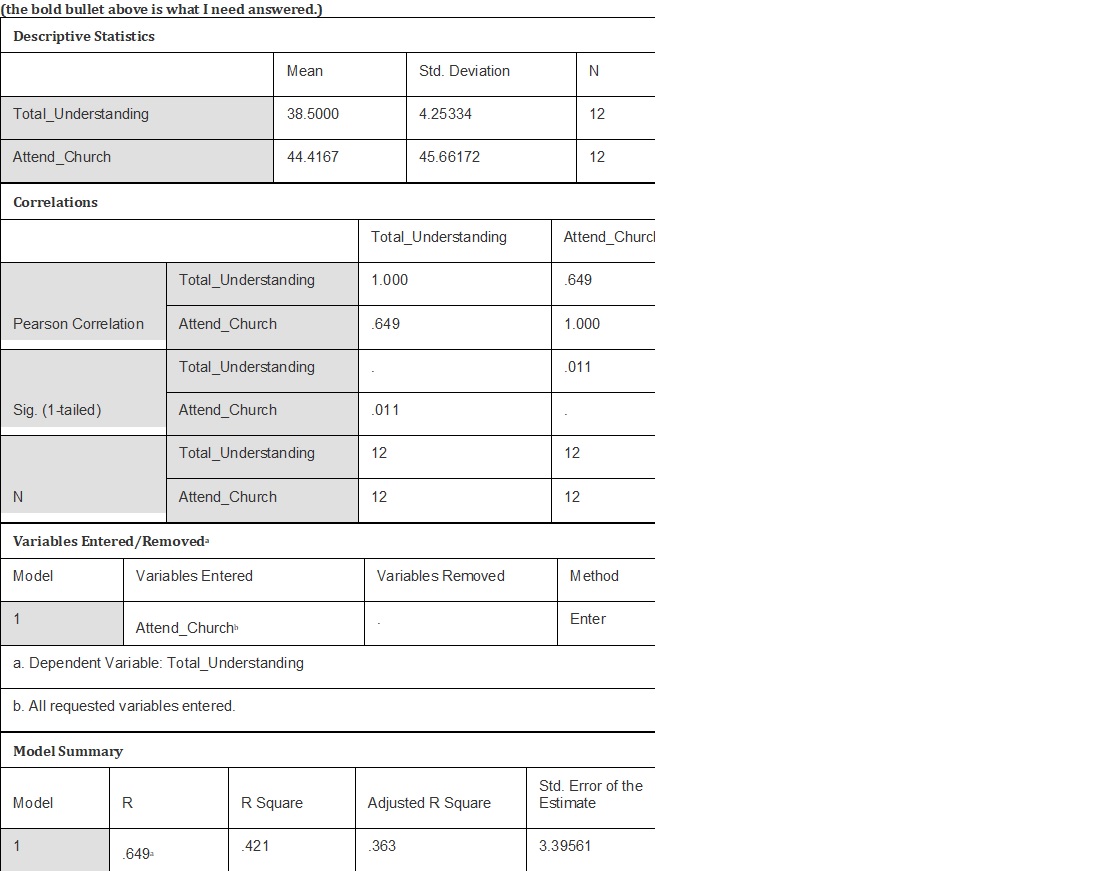
image text in transcribed
(the bold bullet above is what I need answered.) Descriptive Statistics Mean Std. Deviation N Total_Understanding 38.5000 4.25334 12 Attend_Church 44.4167 45.66172 12 Correlations Total_Understanding Attend_Church Total_Understanding 1.000 .649 Pearson Correlation Attend_Church 649 1.000 Total_Understanding 011 Sig. (1-tailed) Attend_Church 011 Total_Understanding 12 12 N Attend_Church 12 12 Variables Entered/Removed Model Variables Entered Variables Removed Method Attend_Church Enter a. Dependent Variable: Total_Understanding b. All requested variables entered. Model Summary Std. Error of the Model R R Square Adjusted R Square Estimate 649 421 363 3.39561

Step by Step Solution

There are 3 Steps involved in it

Step: 1

blur-text-image

Get Instant Access to Expert-Tailored Solutions

See step-by-step solutions with expert insights and AI powered tools for academic success

Step: 2

blur-text-image

Step: 3

blur-text-image

Ace Your Homework with AI

Get the answers you need in no time with our AI-driven, step-by-step assistance

Get Started

Recommended Textbook for

College Algebra

Authors: Margaret L. Lial, John Hornsby, David I. Schneider, Callie Daniels

12th edition

134697022, 9780134313795 , 978-0134697024

More Books

Students also viewed these Mathematics questions