

Question: I NEED ((((Considering data and parameters, calculate all related inventory management variables (average demand during lead time, safety stock, reorder level, order quantity, average inventory
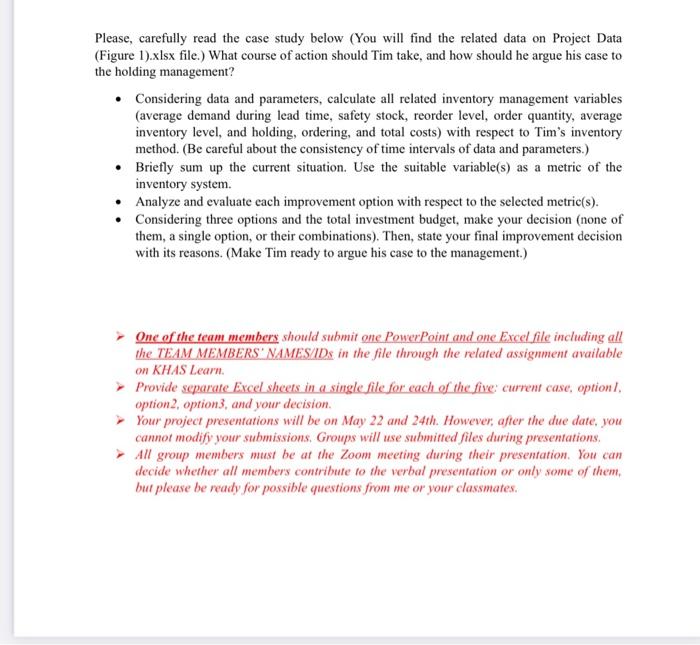
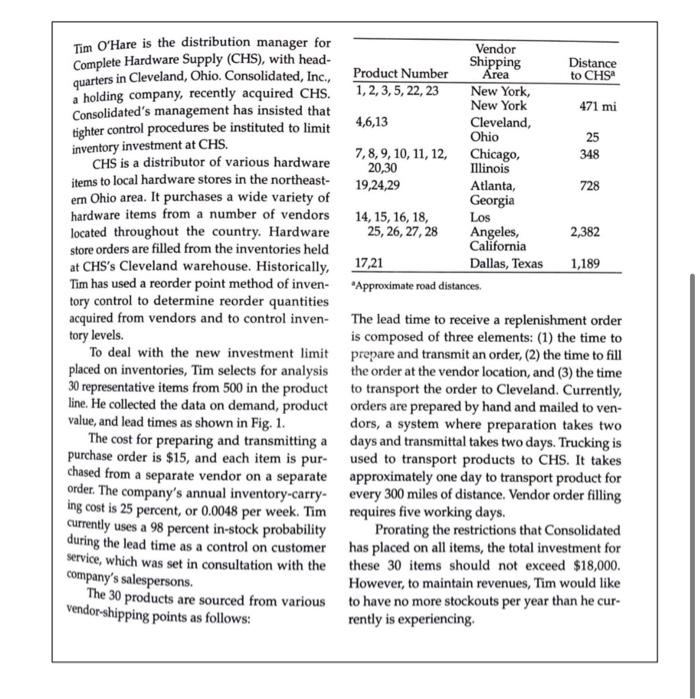
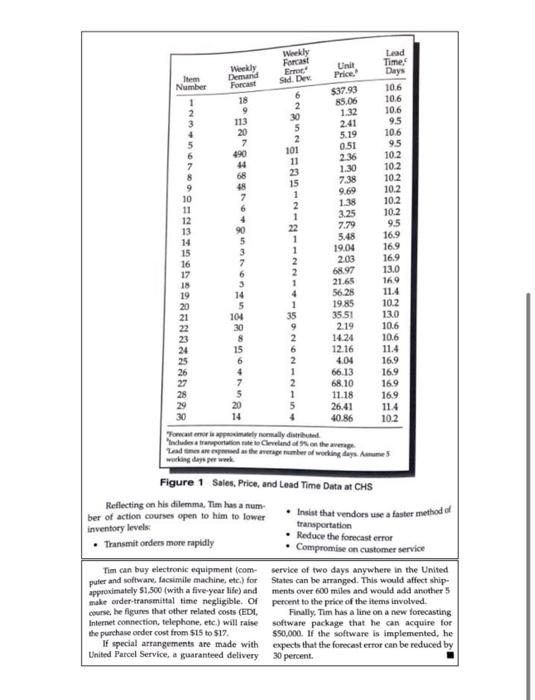
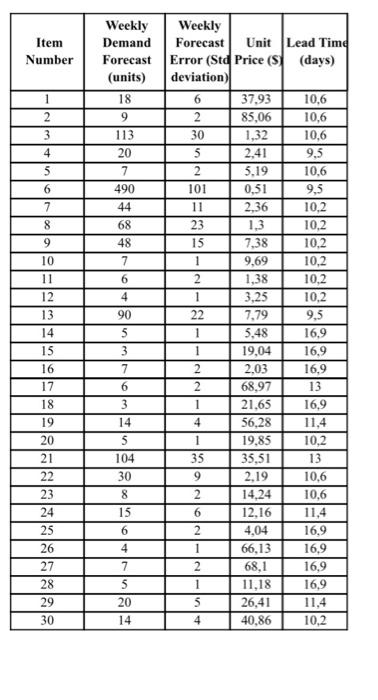
Please, carefully read the case study below (You will find the related data on Project Data (Figure 1).xlsx file.) What course of action should Tim take, and how should he argue his case to the holding management? - Considering data and parameters, calculate all related inventory management variables (average demand during lead time, safety stock, reorder level, order quantity, average inventory level, and holding, ordering, and total costs) with respect to Tim's inventory method. (Be careful about the consistency of time intervals of data and parameters.) - Briefly sum up the current situation. Use the suitable variable(s) as a metric of the inventory system. - Analyze and evaluate each improvement option with respect to the selected metric(s). - Considering three options and the total investment budget, make your decision (none of them, a single option, or their combinations). Then, state your final improvement decision with its reasons. (Make Tim ready to argue his case to the management.) One of the team members should submit one PowerPoint and one Excel file including all the TEAM MEMBERS'NAMESIDs in the file through the related assignment available on KHAS Learn. - Provide separate Excel sheets in a simgle file for each of the five: current case, optionI. option 2, option 3 , and your decision. - Your project presentations will be on May 22 and 24th. However; after the due date, you cannot modify your submissions. Groups will use submitted files during presentations. All group members must be at the Zoom meeting during their presentation. You can decide whether all members contribute to the verbal presentation or only some of them. but please be ready for possible questions from me or your classmates. Tim O Hare is the distribution manager for Complete Hardware Supply (CHS), with headquarters in Cleveland, Ohio. Consolidated, Inc., a holding company, recently acquired CHS. Consolidated's management has insisted that tighter control procedures be instituted to limit inventory investment at CHS. CHS is a distributor of various hardware items to local hardware stores in the northeastem Ohio area. It purchases a wide variety of hardware items from a number of vendors located throughout the country. Hardware store orders are filled from the inventories held at CHS's Cleveland warehouse. Historically, Tim has used a reorder point method of inventory control to determine reorder quantities acquired from vendors and to control inventory levels. To deal with the new investment limit placed on inventories, Tim selects for analysis 30 representative items from 500 in the product line. He collected the data on demand, product value, and lead times as shown in Fig. 1. The cost for preparing and transmitting a purchase order is $15, and each item is purchased from a separate vendor on a separate order. The company's annual inventory-carrying cost is 25 percent, or 0.0048 per week. Tim currently uses a 98 percent in-stock probability during the lead time as a control on customer service, which was set in consultation with the company's salespersons. The 30 products are sourced from various vendor-shipping points as follows: "Approximate road distances. The lead time to receive a replenishment order is composed of three elements: (1) the time to prepare and transmit an order, (2) the time to fill the order at the vendor location, and (3) the time to transport the order to Cleveland. Currently, orders are prepared by hand and mailed to vendors, a system where preparation takes two days and transmittal takes two days. Trucking is used to transport products to CHS. It takes approximately one day to transport product for every 300 miles of distance. Vendor order filling requires five working days. Prorating the restrictions that Consolidated has placed on all items, the total investment for these 30 items should not exceed $18,000. However, to maintain revenues, Tim would like to have no more stockouts per year than he currently is experiencing. Figure 1 Sales, Price, and Lead Time Data at CHS Reflecting on his dilemma, Tim has a number of action courses open to him to lower inventory levels: - Transmit onders more rapidly - Insiat that vendors use a faster method of transportation - Reduce the forecast error - Compromise on customer service Tim can buy electronic equipment (computer and wottwarv, facsimile machine, ete.) for approximately $1.500 (with a five-year life) and make order-transenittal time negligible. Of course, he figures that other related costs (EDI, Internet connection, telephone, etc.) will raise the purchase onder cost from $15 to $17. If special arrangerments are made with thited Parcel Service, a guaranteed delivery service of two days anywhere in the United States can be arranged. This would affect shipments over 600 miles and would add another 5 peroent to the price of the items involved. Finally, Tim has a line on a new forecasting software package that he can acquire for $50,000. If the software is implemented, he expects that the forecast error can be reduced by 30 percent. \begin{tabular}{|c|c|c|c|c|} \hline ItemNumber & WeeklyDemandForecast(units) & WeeklyForecastError(Stddeviation) & UnitPrice(S) & LeadTime(days) \\ \hline 1 & 18 & 6 & 37,93 & 10,6 \\ \hline 2 & 9 & 2 & 85,06 & 10,6 \\ \hline 3 & 113 & 30 & 1,32 & 10,6 \\ \hline 4 & 20 & 5 & 2,41 & 9,5 \\ \hline 5 & 7 & 2 & 5,19 & 10,6 \\ \hline 6 & 490 & 101 & 0,51 & 9,5 \\ \hline 7 & 44 & 11 & 2,36 & 10,2 \\ \hline 8 & 68 & 23 & 1,3 & 10,2 \\ \hline 9 & 48 & 15 & 7,38 & 10,2 \\ \hline 10 & 7 & 1 & 9,69 & 10,2 \\ \hline 11 & 6 & 2 & 1,38 & 10,2 \\ \hline 12 & 4 & 1 & 3,25 & 10,2 \\ \hline 13 & 90 & 22 & 7,79 & 9,5 \\ \hline 14 & 5 & 1 & 5,48 & 16,9 \\ \hline 15 & 3 & 1 & 19,04 & 16,9 \\ \hline 16 & 7 & 2 & 2,03 & 16,9 \\ \hline 17 & 6 & 2 & 68,97 & 13 \\ \hline 18 & 3 & 1 & 21,65 & 16,9 \\ \hline 19 & 14 & 4 & 56,28 & 11,4 \\ \hline 20 & 5 & 1 & 19,85 & 10,2 \\ \hline 21 & 104 & 35 & 35,51 & 13 \\ \hline 22 & 30 & 9 & 2,19 & 10,6 \\ \hline 23 & 8 & 2 & 14,24 & 10,6 \\ \hline 24 & 15 & 6 & 12,16 & 11,4 \\ \hline 25 & 6 & 2 & 4,04 & 16,9 \\ \hline 26 & 4 & 1 & 66,13 & 16,9 \\ \hline 27 & 7 & 2 & 68,1 & 16,9 \\ \hline 28 & 5 & 1 & 11,18 & 16,9 \\ \hline 29 & 20 & 5 & 26,41 & 11,4 \\ \hline 30 & 14 & 40,86 & 10,2 \\ \hline \end{tabular} Please, carefully read the case study below (You will find the related data on Project Data (Figure 1).xlsx file.) What course of action should Tim take, and how should he argue his case to the holding management? - Considering data and parameters, calculate all related inventory management variables (average demand during lead time, safety stock, reorder level, order quantity, average inventory level, and holding, ordering, and total costs) with respect to Tim's inventory method. (Be careful about the consistency of time intervals of data and parameters.) - Briefly sum up the current situation. Use the suitable variable(s) as a metric of the inventory system. - Analyze and evaluate each improvement option with respect to the selected metric(s). - Considering three options and the total investment budget, make your decision (none of them, a single option, or their combinations). Then, state your final improvement decision with its reasons. (Make Tim ready to argue his case to the management.) One of the team members should submit one PowerPoint and one Excel file including all the TEAM MEMBERS'NAMESIDs in the file through the related assignment available on KHAS Learn. - Provide separate Excel sheets in a simgle file for each of the five: current case, optionI. option 2, option 3 , and your decision. - Your project presentations will be on May 22 and 24th. However; after the due date, you cannot modify your submissions. Groups will use submitted files during presentations. All group members must be at the Zoom meeting during their presentation. You can decide whether all members contribute to the verbal presentation or only some of them. but please be ready for possible questions from me or your classmates. Tim O Hare is the distribution manager for Complete Hardware Supply (CHS), with headquarters in Cleveland, Ohio. Consolidated, Inc., a holding company, recently acquired CHS. Consolidated's management has insisted that tighter control procedures be instituted to limit inventory investment at CHS. CHS is a distributor of various hardware items to local hardware stores in the northeastem Ohio area. It purchases a wide variety of hardware items from a number of vendors located throughout the country. Hardware store orders are filled from the inventories held at CHS's Cleveland warehouse. Historically, Tim has used a reorder point method of inventory control to determine reorder quantities acquired from vendors and to control inventory levels. To deal with the new investment limit placed on inventories, Tim selects for analysis 30 representative items from 500 in the product line. He collected the data on demand, product value, and lead times as shown in Fig. 1. The cost for preparing and transmitting a purchase order is $15, and each item is purchased from a separate vendor on a separate order. The company's annual inventory-carrying cost is 25 percent, or 0.0048 per week. Tim currently uses a 98 percent in-stock probability during the lead time as a control on customer service, which was set in consultation with the company's salespersons. The 30 products are sourced from various vendor-shipping points as follows: "Approximate road distances. The lead time to receive a replenishment order is composed of three elements: (1) the time to prepare and transmit an order, (2) the time to fill the order at the vendor location, and (3) the time to transport the order to Cleveland. Currently, orders are prepared by hand and mailed to vendors, a system where preparation takes two days and transmittal takes two days. Trucking is used to transport products to CHS. It takes approximately one day to transport product for every 300 miles of distance. Vendor order filling requires five working days. Prorating the restrictions that Consolidated has placed on all items, the total investment for these 30 items should not exceed $18,000. However, to maintain revenues, Tim would like to have no more stockouts per year than he currently is experiencing. Figure 1 Sales, Price, and Lead Time Data at CHS Reflecting on his dilemma, Tim has a number of action courses open to him to lower inventory levels: - Transmit onders more rapidly - Insiat that vendors use a faster method of transportation - Reduce the forecast error - Compromise on customer service Tim can buy electronic equipment (computer and wottwarv, facsimile machine, ete.) for approximately $1.500 (with a five-year life) and make order-transenittal time negligible. Of course, he figures that other related costs (EDI, Internet connection, telephone, etc.) will raise the purchase onder cost from $15 to $17. If special arrangerments are made with thited Parcel Service, a guaranteed delivery service of two days anywhere in the United States can be arranged. This would affect shipments over 600 miles and would add another 5 peroent to the price of the items involved. Finally, Tim has a line on a new forecasting software package that he can acquire for $50,000. If the software is implemented, he expects that the forecast error can be reduced by 30 percent. \begin{tabular}{|c|c|c|c|c|} \hline ItemNumber & WeeklyDemandForecast(units) & WeeklyForecastError(Stddeviation) & UnitPrice(S) & LeadTime(days) \\ \hline 1 & 18 & 6 & 37,93 & 10,6 \\ \hline 2 & 9 & 2 & 85,06 & 10,6 \\ \hline 3 & 113 & 30 & 1,32 & 10,6 \\ \hline 4 & 20 & 5 & 2,41 & 9,5 \\ \hline 5 & 7 & 2 & 5,19 & 10,6 \\ \hline 6 & 490 & 101 & 0,51 & 9,5 \\ \hline 7 & 44 & 11 & 2,36 & 10,2 \\ \hline 8 & 68 & 23 & 1,3 & 10,2 \\ \hline 9 & 48 & 15 & 7,38 & 10,2 \\ \hline 10 & 7 & 1 & 9,69 & 10,2 \\ \hline 11 & 6 & 2 & 1,38 & 10,2 \\ \hline 12 & 4 & 1 & 3,25 & 10,2 \\ \hline 13 & 90 & 22 & 7,79 & 9,5 \\ \hline 14 & 5 & 1 & 5,48 & 16,9 \\ \hline 15 & 3 & 1 & 19,04 & 16,9 \\ \hline 16 & 7 & 2 & 2,03 & 16,9 \\ \hline 17 & 6 & 2 & 68,97 & 13 \\ \hline 18 & 3 & 1 & 21,65 & 16,9 \\ \hline 19 & 14 & 4 & 56,28 & 11,4 \\ \hline 20 & 5 & 1 & 19,85 & 10,2 \\ \hline 21 & 104 & 35 & 35,51 & 13 \\ \hline 22 & 30 & 9 & 2,19 & 10,6 \\ \hline 23 & 8 & 2 & 14,24 & 10,6 \\ \hline 24 & 15 & 6 & 12,16 & 11,4 \\ \hline 25 & 6 & 2 & 4,04 & 16,9 \\ \hline 26 & 4 & 1 & 66,13 & 16,9 \\ \hline 27 & 7 & 2 & 68,1 & 16,9 \\ \hline 28 & 5 & 1 & 11,18 & 16,9 \\ \hline 29 & 20 & 5 & 26,41 & 11,4 \\ \hline 30 & 14 & 40,86 & 10,2 \\ \hline \end{tabular}
Step by Step Solution
There are 3 Steps involved in it

Get step-by-step solutions from verified subject matter experts