i need correct solution
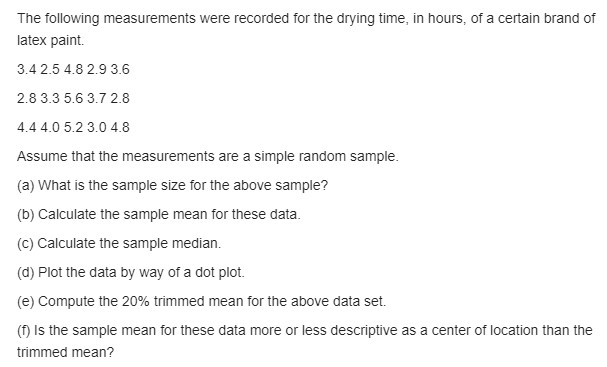
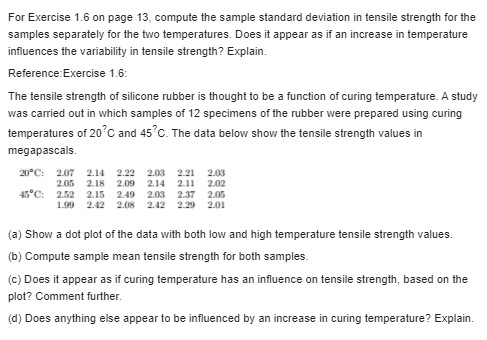
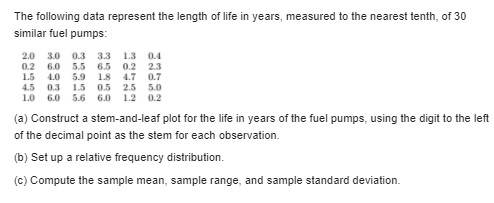
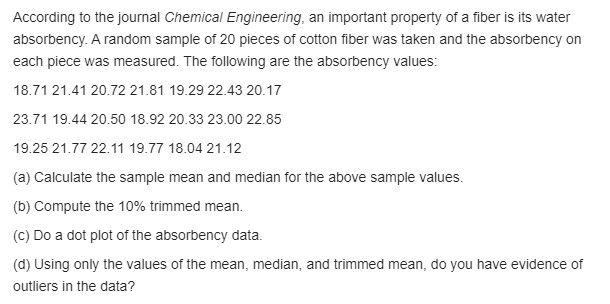
The following measurements were recorded for the drying time, in hours, of a certain brand of latex paint. 3.4 2.5 4.8 2.9 3.6 2.8 3.3 5.6 3.7 2.8 4.4 4.0 5.2 3.0 4.8 Assume that the measurements are a simple random sample. (a) What is the sample size for the above sample? (b) Calculate the sample mean for these data. (c) Calculate the sample median. (d) Plot the data by way of a dot plot. (e) Compute the 20% trimmed mean for the above data set. (f) Is the sample mean for these data more or less descriptive as a center of location than the trimmed mean?For Exercise 1.6 on page 13, compute the sample standard deviation in tensile strength for the samples separately for the two temperatures. Does it appear as if an increase in temperature influences the variability in tensile strength? Explain. Reference Exercise 1.6: The tensile strength of silicone rubber is thought to be a function of curing temperature. A study was carried out in which samples of 12 specimens of the rubber were prepared using curing temperatures of 20 C and 45 C. The data below show the tensile strength values in megapascals. 20"C: 2.07 2.14 2.22 2.03 2.21 2.013 2.05 2.18 2.09 2.14 2.11 2.02 45"C: 2.52 2.15 2.49 2.03 2.37 2.05 2.42 2.08 2.42 2.20 2.01 (a) Show a dot plot of the data with both low and high temperature tensile strength values. (b) Compute sample mean tensile strength for both samples. (c) Does it appear as if curing temperature has an influence on tensile strength, based on the plot? Comment further. (d) Does anything else appear to be influenced by an increase in curing temperature? Explain.The following data represent the length of life in years, measured to the nearest tenth, of 30 similar fuel pumps: 2.0 3.0 03 3.3 1.3 0.4 0.2 6.0 5.5 6.5 02 23 1.5 4.0 5.9 18 4.7 0.7 4.5 0.3 1.5 0.5 2.5 5.0 1.0 6.0 5.6 6.0 1.2 0.2 (a) Construct a stem-and-leaf plot for the life in years of the fuel pumps, using the digit to the left of the decimal point as the stem for each observation. (b) Set up a relative frequency distribution. (c) Compute the sample mean, sample range, and sample standard deviation.According to the journal Chemical Engineering, an important property of a fiber is its water absorbency. A random sample of 20 pieces of cotton fiber was taken and the absorbency on each piece was measured. The following are the absorbency values: 18.71 21.41 20.72 21.81 19.29 22.43 20.17 23.71 19.44 20.50 18.92 20.33 23.00 22.85 19.25 21.77 22.11 19.77 18.04 21.12 (a) Calculate the sample mean and median for the above sample values. (b) Compute the 10% trimmed mean. (c) Do a dot plot of the absorbency data. (d) Using only the values of the mean, median, and trimmed mean, do you have evidence of outliers in the data?The following data represent the length of life, in seconds, of 50 fruit flies subject to a new spray in a controlled laboratory experiment: 17 20 In 13 12 19 18 24 12 14 10 13 7 16 18 13 32 T 10 11 13 7 10 4 19 16 R 7 10 5 14 15 10 9 6 15 (a) Construct a double-stem-and-leaf plot for the life span of the fruit flies using the stems 0, 0-, 1, 1., 2, 2, and 3 such that stems coded by the symbols and . are associated, respectively, with leaves 0 through 4 and 5 through 9. (b) Set up a relative frequency distribution. (c) Construct a relative frequency histogram. (d) Find the median.\f\fA certain polymer is used for evacuation systems for aircraft. It is important that the polymer be resistant to the aging process. Twenty specimens of the polymer were used in an experiment. Ten were assigned randomly to be exposed to an accelerated batch aging process that involved exposure to high temperatures for 10 days. Measurements of tensile strength of the specimens were made, and the following data were recorded on tensile strength in psi: No aging: 227 222 218 217 225 218 216 229 228 221 Aging: 219 214 215 211 209 218 203 204 201 205 (a) Do a dot plot of the data. (b) From your plot, does it appear as if the aging process has had an effect on the tensile strength of thispolymer? Explain. (c) Calculate the sample mean tensile strength of the two samples. (d) Calculate the median for both. Discuss the similarity or lack of similarity between the mean andmedian of each group.\fFind the cumulative distribution function of the random variable Win Exercise 3.8. Using A(w). find (@) P(W = 0). (b) P(-1