Answered step by step
Verified Expert Solution
Question
1 Approved Answer
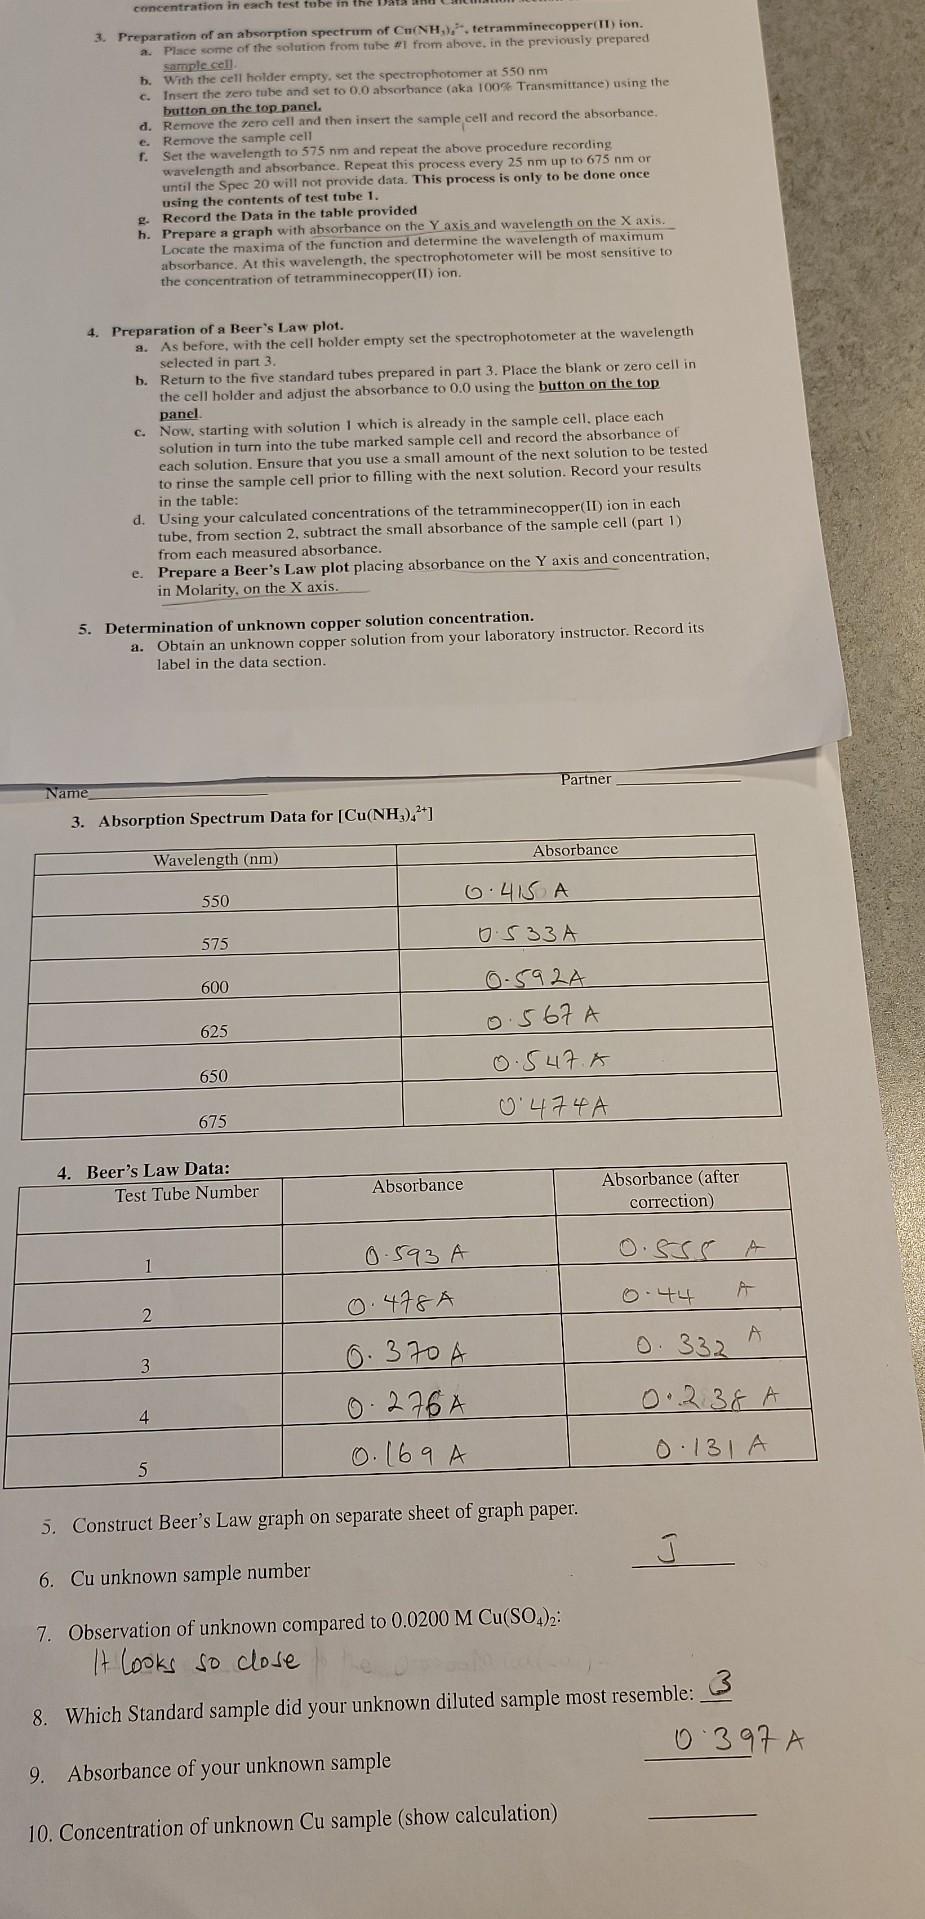
I need drawing the graphs of number 3 and 4. And I also need help with number 10. I have provided the data. Thank you.


I need drawing the graphs of number 3 and 4. And I also need help with number 10. I have provided the data. Thank you.
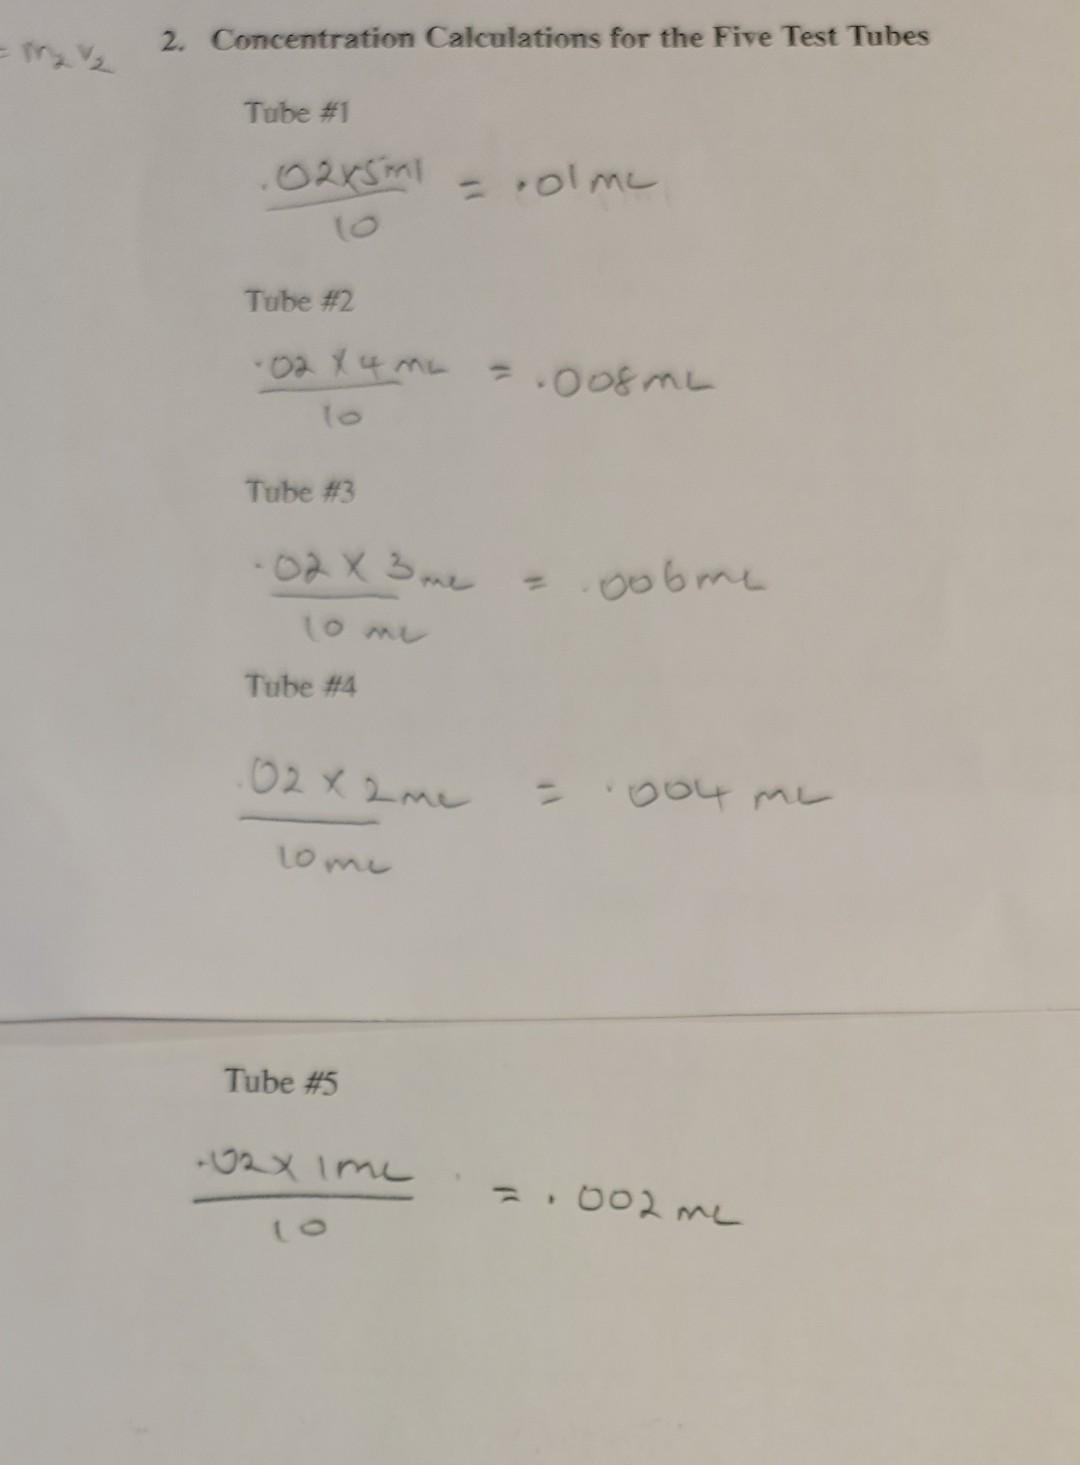
concentration in each test tube in the Data 3. Preparation of an absorption spectrum of Cu(NH),. tetramminecopper(II)ion. a. Place some of the solution from tube #1 from above, in the previously prepared sample cell b. With the cell holder empty, set the spectrophotomer at 550 nm c. Insert the zero tube and set to 0.0 absorbance (aka 100% Transmittance) using the button on the top panel. d. Remove the zero cell and then insert the sample cell and record the absorbance. e. Remove the sample cell f. Set the wavelength to 575 nm and repeat the above procedure recording wavelength and absorbance. Repeat this process every 25 nm up to 675 nm or until the Spec 20 will not provide data. This process is only to be done once using the contents of test tube 1. Record the Data in the table provided h. Prepare a graph with absorbance on the Y axis and wavelength on the X axis. Locate the maxima of the function and determine the wavelength of maximum absorbance. At this wavelength, the spectrophotometer will be most sensitive to the concentration of tetramminecopper(II) ion. 4. Preparation of a Beer's Law plot. 2. As before, with the cell holder empty set the spectrophotometer at the wavelength selected in part 3. b. Return to the five standard tubes prepared in part 3. Place the blank or zero cell in the cell holder and adjust the absorbance to 0.0 using the button on the top panel c. Now, starting with solution 1 which is already in the sample cell. place each solution in turn into the tube marked sample cell and record the absorbance of each solution. Ensure that you use a small amount of the next solution to be tested to rinse the sample cell prior to filling with the next solution. Record your results in the table: d. Using your calculated concentrations of the tetramminecopper(ID) ion in each tube, from section 2, subtract the small absorbance of the sample cell (part 1) from each measured absorbance. e. Prepare a Beer's Law plot placing absorbance on the Y axis and concentration, in Molarity, on the X axis. 5. Determination of unknown copper solution concentration. a. Obtain an unknown copper solution from your laboratory instructor. Record its label in the data section. Partner Name 3. Absorption Spectrum Data for [Cu(NH) 2+1 Absorbance Wavelength (nm) 6.415 A 550 0.533 A 575 600 0.592A 0.567 A 0.547.A 625 650 0474A 675 4. Beer's Law Data: Test Tube Number Absorbance Absorbance (after correction) 0.593 A O.SSS A 0.44 0.478A 2 A O 332 3 6.370 A 276A 0.169 A 0.238 A 4 0.131A 5 5. Construct Beer's Law graph on separate sheet of graph paper. 6. Cu unknown sample number 7. Observation of unknown compared to 0.0200 M Cu(SO4)2: It looks so close 8. Which Standard sample did your unknown diluted sample most resemble: 3 0 397 A 9. Absorbance of your unknown sample 10. Concentration of unknown Cu sample (show calculation) 2. Concentration Calculations for the Five Test Tubes Tube #1 0275 ml - .olme lo Tube #2 -02 x 4 m2 = 0o8mL Tube #3 .02x 3 me OM 11 oobne Tube #4 02x2me - oo4 me tome Tube #5 -02X Ime .002 meStep by Step Solution
There are 3 Steps involved in it
Step: 1

Get Instant Access to Expert-Tailored Solutions
See step-by-step solutions with expert insights and AI powered tools for academic success
Step: 2

Step: 3

Ace Your Homework with AI
Get the answers you need in no time with our AI-driven, step-by-step assistance
Get Started


