Answered step by step
Verified Expert Solution
Question
1 Approved Answer
I need explanation for those tables. I need the rules for every part. The country is Oman Section Ten Financial Plan Projected Profit and Loss
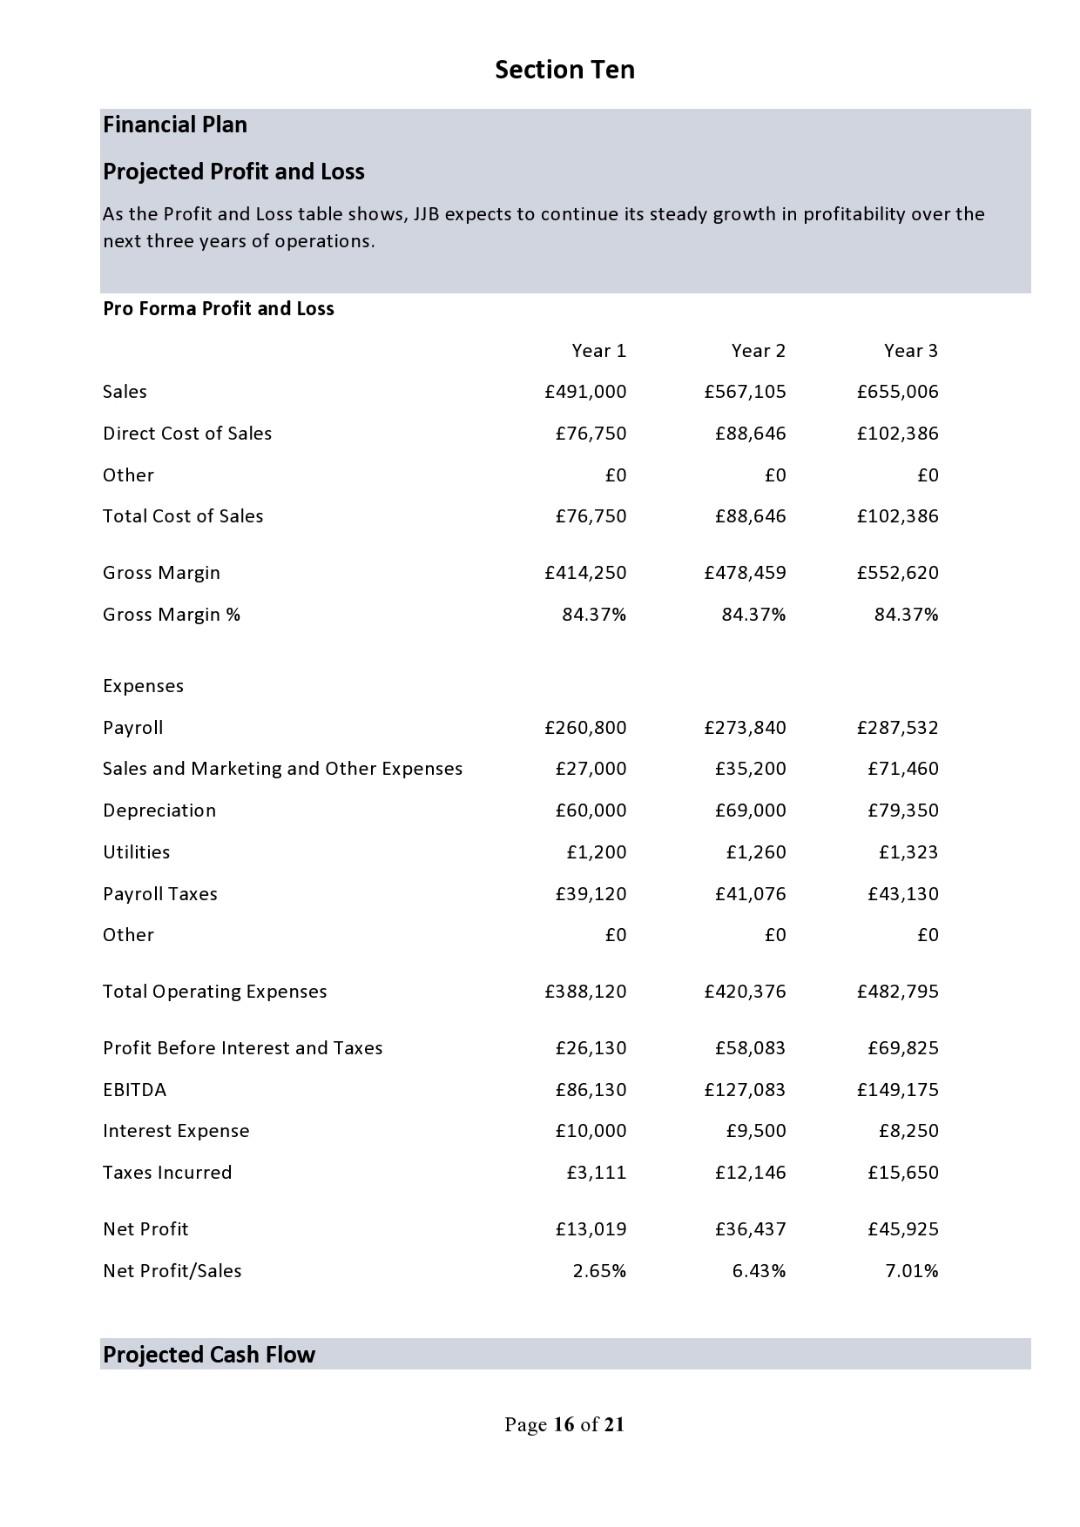
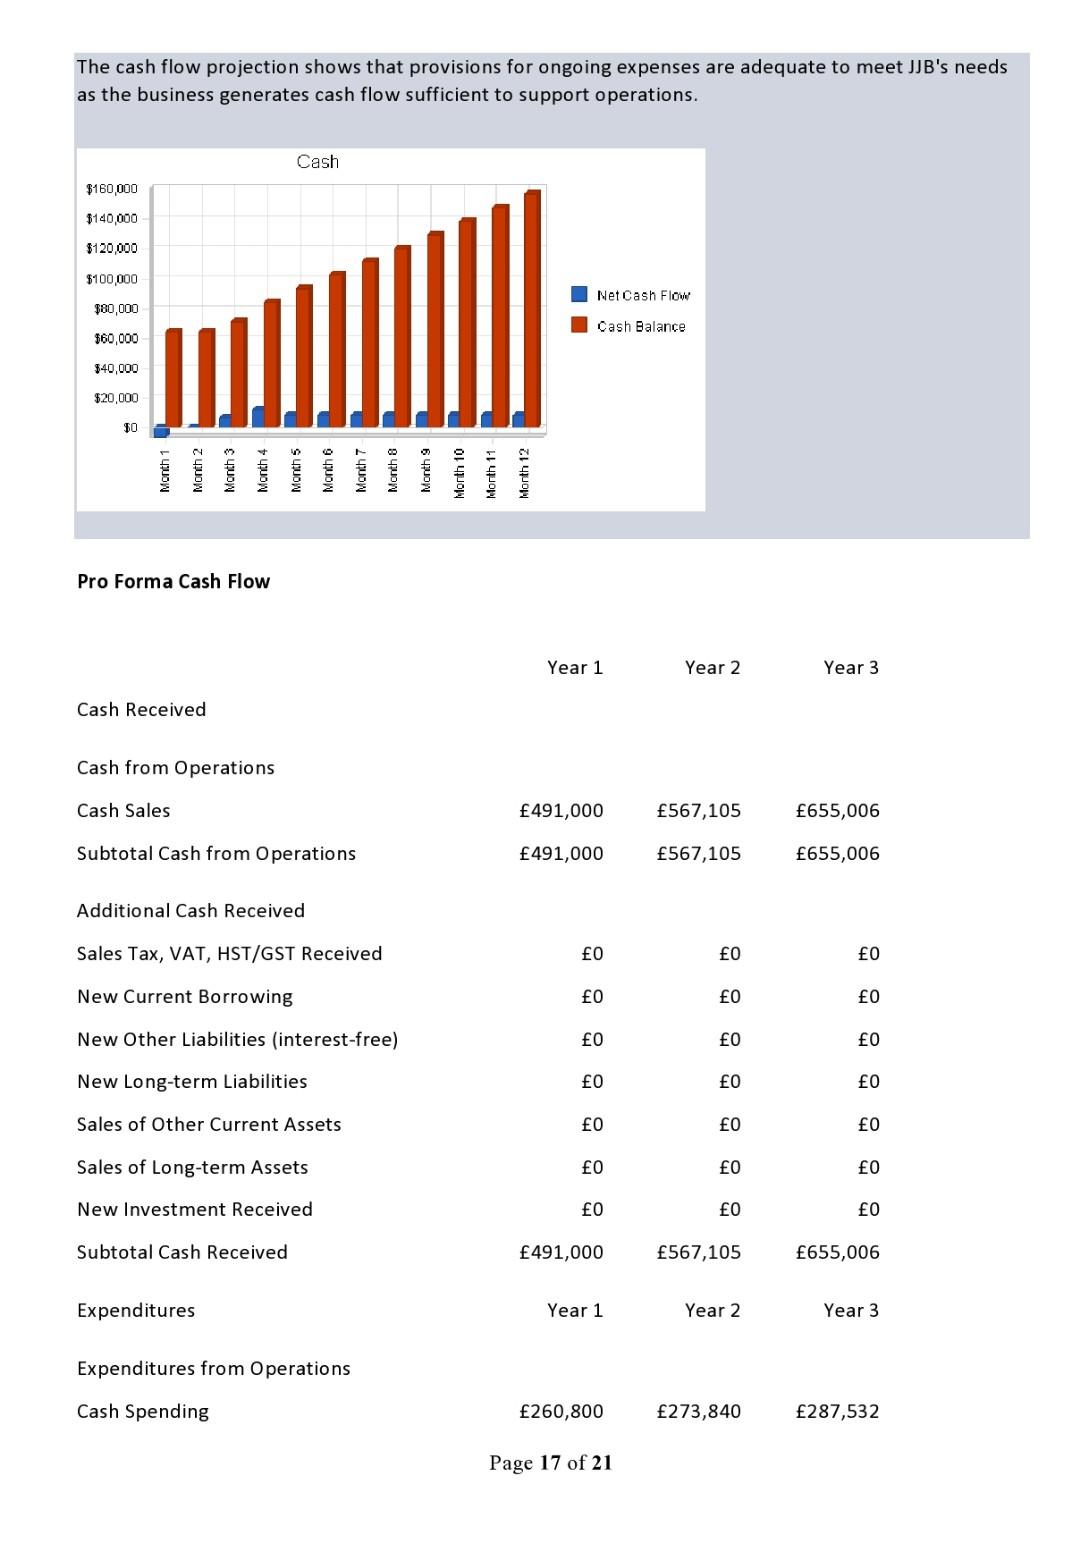
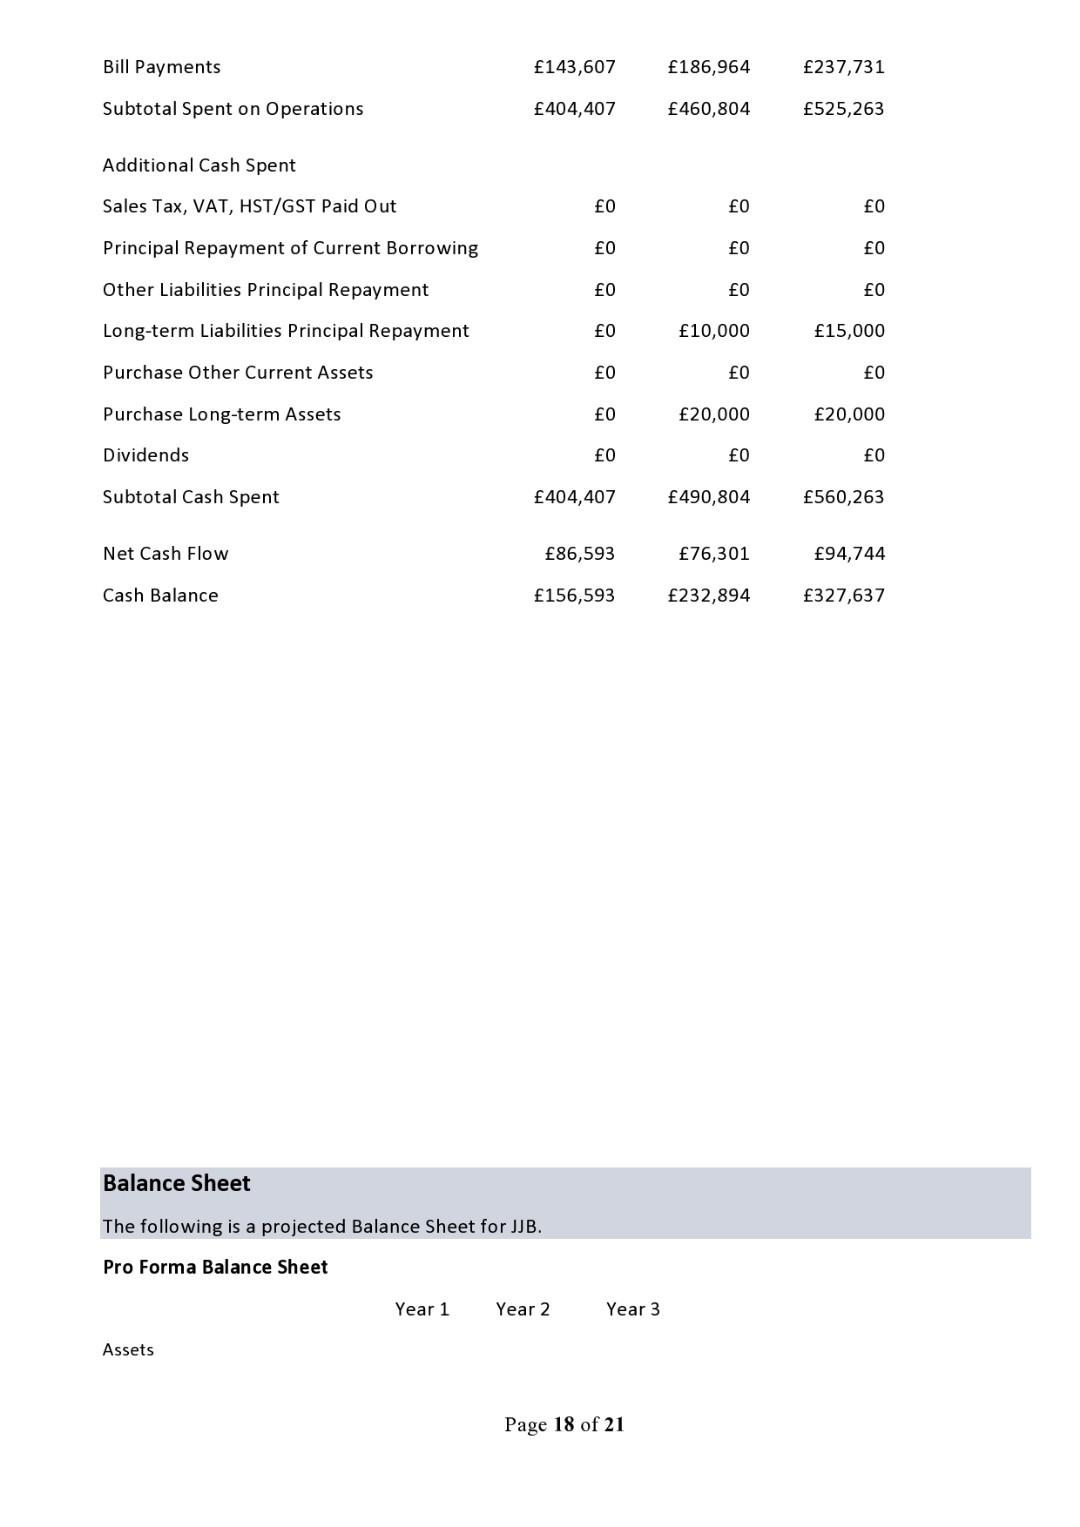
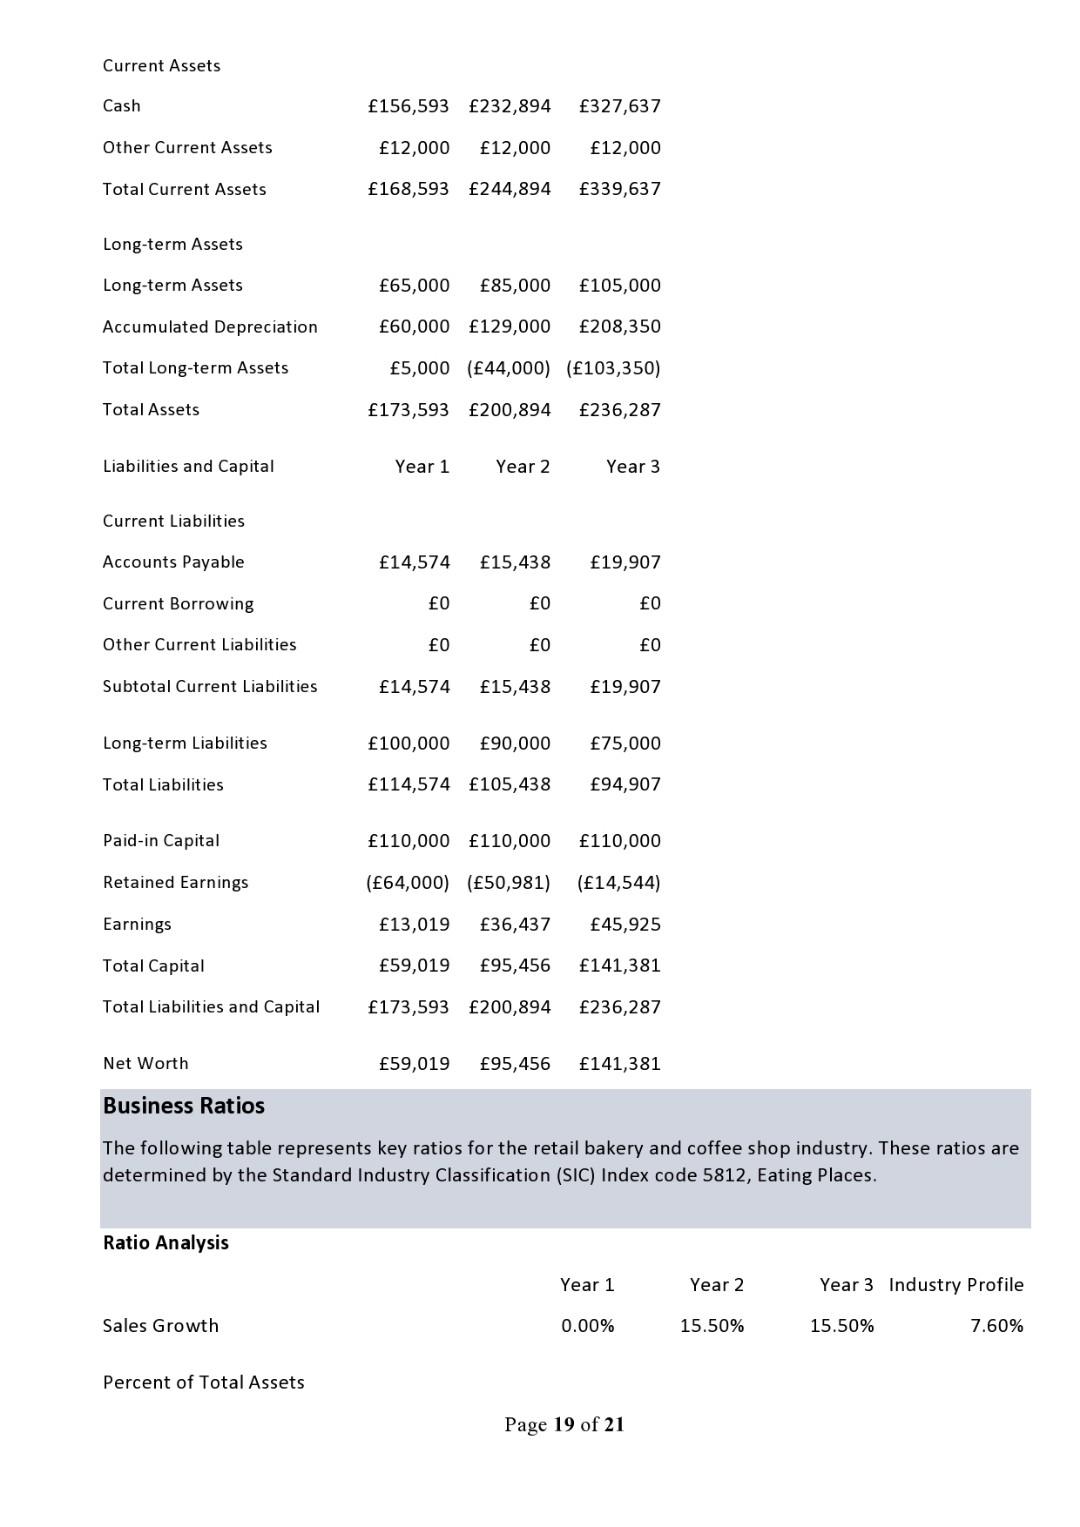
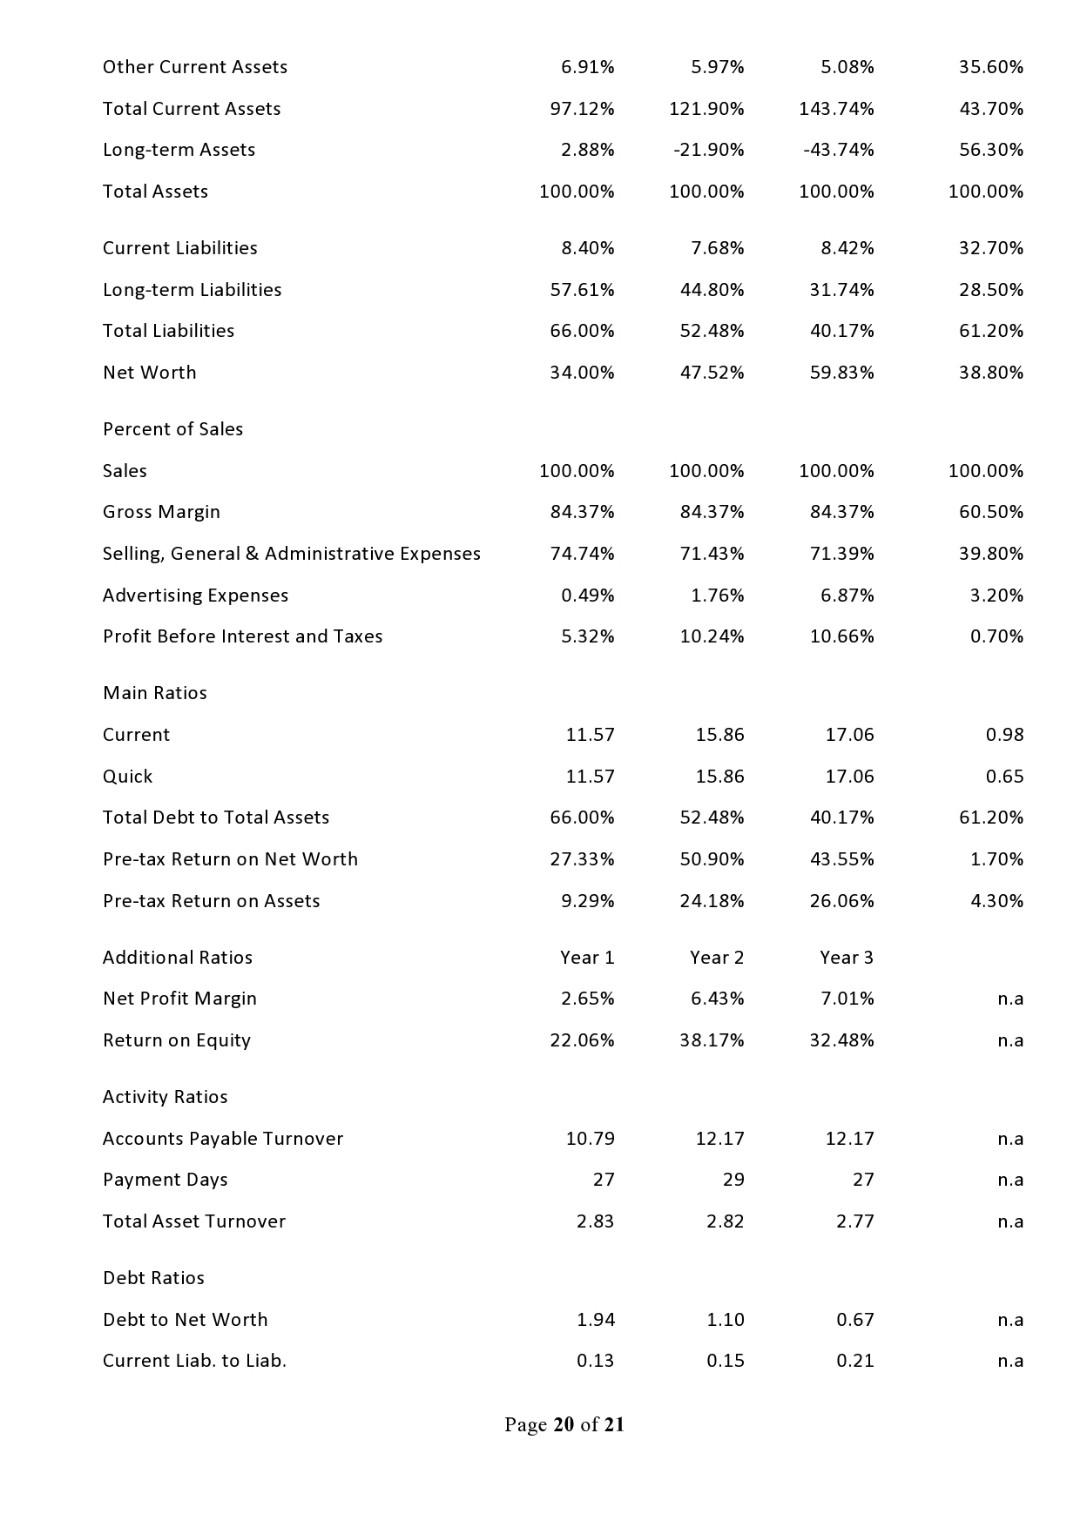
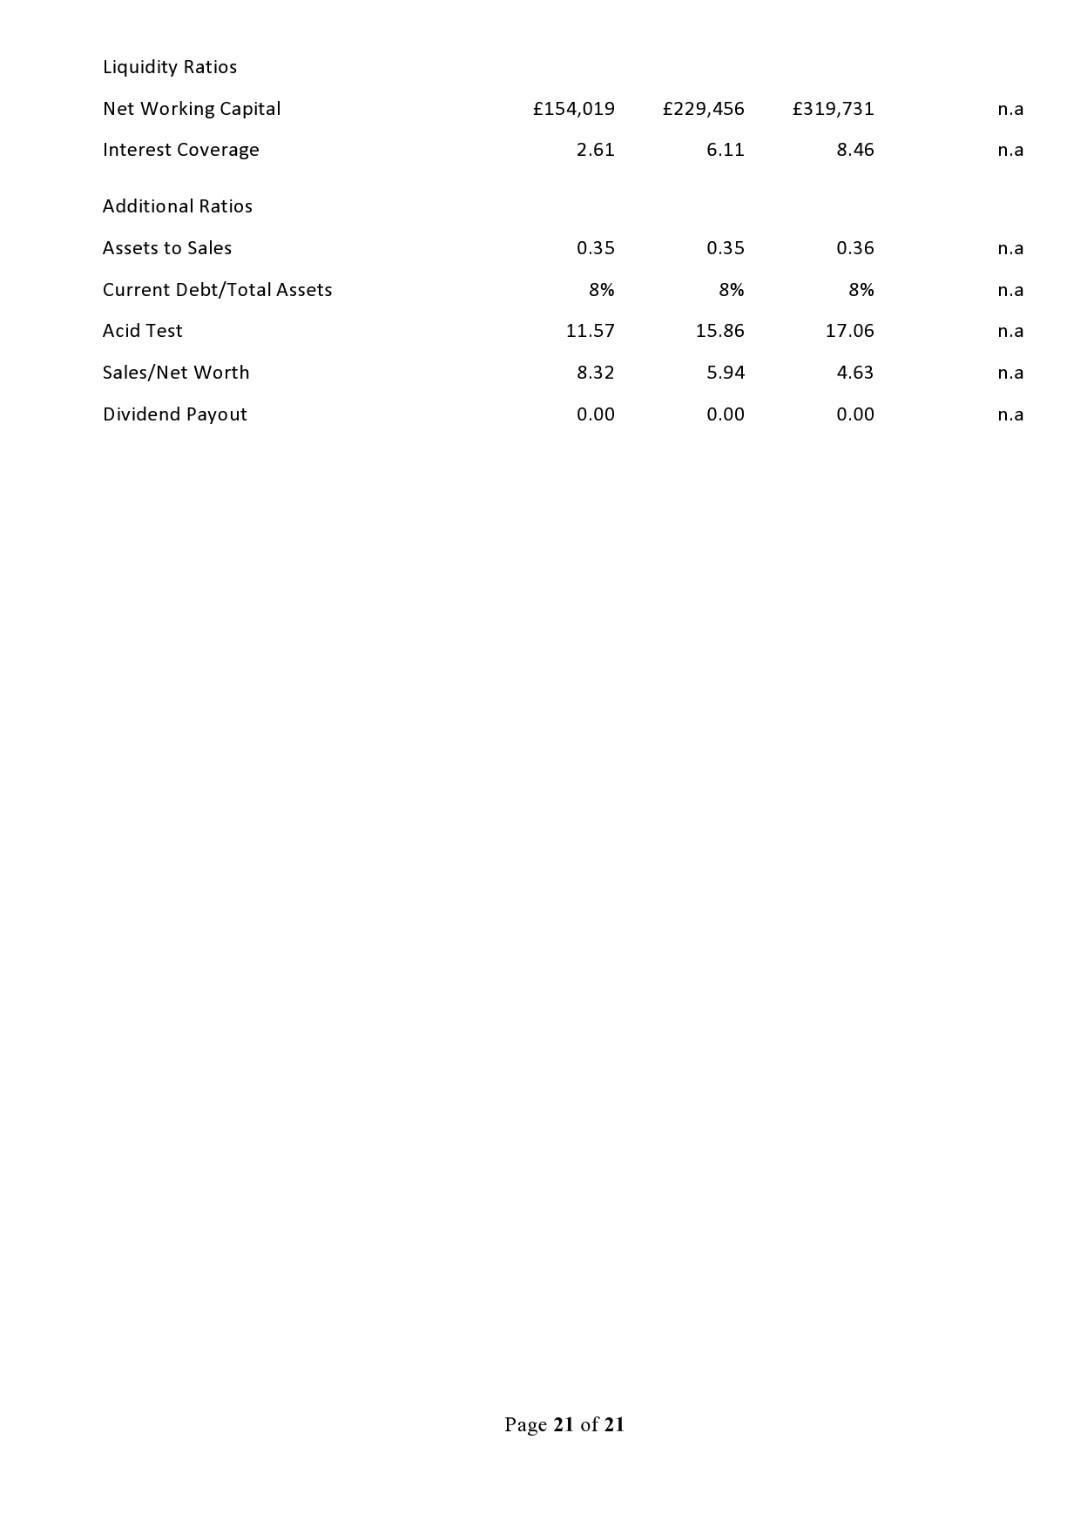
I need explanation for those tables. I need the rules for every part.
The country is Oman
Section Ten Financial Plan Projected Profit and Loss As the Profit and Loss table shows, JJB expects to continue its steady growth in profitability over the next three years of operations. Pro Forma Profit and Loss Year 1 Year 2 Year 3 Sales 491,000 567,105 655,006 Direct Cost of Sales 76,750 88,646 102,386 Other fo O FO Total Cost of Sales 76,750 88,646 102,386 Gross Margin 414,250 478,459 552,620 Gross Margin % 84.37% 84.37% 84.37% Expenses Payroll 260,800 273,840 287,532 Sales and Marketing and Other Expenses 27,000 35,200 71,460 Depreciation 60,000 69,000 79,350 Utilities 1,200 1,260 1,323 Payroll Taxes 39,120 41,076 43,130 Other 0 O EO Total Operating Expenses 388,120 420,376 482,795 Profit Before Interest and Taxes 26,130 58,083 69,825 EBITDA 86,130 127,083 149,175 Interest Expense 10,000 9,500 8,250 Taxes Incurred 3,111 12,146 15,650 Net Profit 13,019 36,437 45,925 Net Profit/Sales 2.65% 6.43% 7.01% Projected Cash Flow Page 16 of 21 The cash flow projection shows that provisions for ongoing expenses are adequate to meet JJB's needs as the business generates cash flow sufficient to support operations. Cash $160,000 $140,000 $120,000 $100,000 NetCash Flow $80,000 Cash Balance $60,000 $40,000 $20.000 10 Month Pro Forma Cash Flow Year 1 Year 2 Year 3 Cash Received Cash from Operations Cash Sales 491,000 567,105 655,006 Subtotal Cash from Operations 491,000 567,105 655,006 Additional Cash Received Sales Tax, VAT, HST/GST Received O O New Current Borrowing O 0 EO New Other Liabilities interest-free) 0 O EO New Long-term Liabilities 0 O O Sales of Other Current Assets O O EO Sales of Long-term Assets O O EO New Investment Received 0 O FO Subtotal Cash Received 491,000 567,105 655,006 Expenditures Year 1 Year 2 Year 3 Expenditures from Operations Cash Spending 260,800 273,840 287,532 Page 17 of 21 Bill Payments 143,607 186,964 237,731 Subtotal Spent on Operations 404,407 460,804 525,263 Additional Cash Spent Sales Tax, VAT, HST/GST Paid Out O O EO Principal Repayment of Current Borrowing O 90 EO Other Liabilities Principal Repayment O O 0 Long-term Liabilities Principal Repayment EO 10,000 15,000 Purchase Other Current Assets 0 O O Purchase Long-term Assets 0 20,000 20,000 Dividends EO EO O Subtotal Cash Spent 404,407 490,804 560,263 Net Cash Flow 86,593 76,301 94,744 Cash Balance 156,593 232,894 327,637 Balance Sheet The following is a projected Balance Sheet for JJB. Pro Forma Balance Sheet Year 1 Year 2 Year 3 Assets Page 18 of 21 Current Assets Cash 156,593 232,894 327,637 Other Current Assets 12,000 12,000 12,000 Total Current Assets 168,593 244,894 339,637 Long-term Assets Long-term Assets 65,000 85,000 105,000 Accumulated Depreciation 60,000 129,000 208,350 Total Long-term Assets 5,000 (44,000) (103,350) Total Assets 173,593 200,894 236,287 Liabilities and Capital Year 1 Year 2 Year 3 Current Liabilities Accounts Payable 14,574 15,438 19,907 Current Borrowing O 0 EO Other Current Liabilities 0 EO O Subtotal Current Liabilities 14,574 15,438 19,907 Long-term Liabilities 100,000 90,000 75,000 Total Liabilities 114,574 105,438 94,907 Paid-in Capital 110,000 110,000 110,000 Retained Earnings (64,000) (50,981) (14,544) Earnings 13,019 36,437 45,925 Total Capital 59,019 95,456 141,381 Total Liabilities and Capital 173,593 200,894 236,287 Net Worth 59,019 95,456 141,381 Business Ratios The following table represents key ratios for the retail bakery and coffee shop industry. These ratios are determined by the Standard Industry Classification (SIC) Index code 5812, Eating Places. Ratio Analysis Year 1 Year 2 Year 3 Industry Profile Sales Growth 0.00% 15.50% 15.50% 7.60% Percent of Total Assets Page 19 of 21 Other Current Assets 6.91% 5.97% 5.08% 35.60% Total Current Assets 97.12% 121.90% 143.74% 43.70% Long-term Assets 2.88% -21.90% -43.74% 56.30% Total Assets 100.00% 100.00% 100.00% 100.00% Current Liabilities 8.40% 7.68% 8.42% 32.70% Long-term Liabilities 57.61% 44.80% 31.74% 28.50% Total Liabilities 66.00% 52.48% 40.17% 61.20% Net Worth 34.00% 47.52% 59.83% 38.80% Percent of Sales Sales 100.00% 100.00% 100.00% 100.00% Gross Margin 84.37% 84.37% 84.37% 60.50% Selling, General & Administrative Expenses 74.74% 71.43% 71.39% 39.80% Advertising Expenses 0.49% 1.76% 6.87% 3.20% Profit Before Interest and Taxes 5.32% 10.24% 10.66% 0.70% Main Ratios Current 11.57 15.86 17.06 0.98 Quick 11.57 15.86 17.06 0.65 Total Debt to Total Assets 66.00% 52.48% 40.17% 61.20% Pre-tax Return on Net Worth 27.33% 50.90% 43.55% 1.70% Pre-tax Return on Assets 9.29% 24.18% 26.06% 4.30% Additional Ratios Year 1 Year 2 Year 3 Net Profit Margin 2.65% 6.43% 7.01% n.a Return on Equity 22.06% 38.17% 32.48% n.a Activity Ratios Accounts Payable Turnover 10.79 12.17 12.17 n.a Payment Days 27 29 27 n.a Total Asset Turnover 2.83 2.82 2.77 n.a Debt Ratios Debt to Net Worth 1.94 1.10 0.67 n.a Current Liab. to Liab. 0.13 0.15 0.21 n.a Page 20 of 21 Liquidity Ratios Net Working Capital 154,019 229,456 319,731 na Interest Coverage 2.61 6.11 8.46 n.a Additional Ratios Assets to Sales 0.35 0.35 0.36 n.a Current Debt/Total Assets 8% 8% 8% n.a Acid Test 11.57 15.86 17.06 n.a Sales/Net Worth 8.32 5.94 4.63 n.a Dividend Payout 0.00 0.00 0.00 n.a Page 21 of 21 Section Ten Financial Plan Projected Profit and Loss As the Profit and Loss table shows, JJB expects to continue its steady growth in profitability over the next three years of operations. Pro Forma Profit and Loss Year 1 Year 2 Year 3 Sales 491,000 567,105 655,006 Direct Cost of Sales 76,750 88,646 102,386 Other fo O FO Total Cost of Sales 76,750 88,646 102,386 Gross Margin 414,250 478,459 552,620 Gross Margin % 84.37% 84.37% 84.37% Expenses Payroll 260,800 273,840 287,532 Sales and Marketing and Other Expenses 27,000 35,200 71,460 Depreciation 60,000 69,000 79,350 Utilities 1,200 1,260 1,323 Payroll Taxes 39,120 41,076 43,130 Other 0 O EO Total Operating Expenses 388,120 420,376 482,795 Profit Before Interest and Taxes 26,130 58,083 69,825 EBITDA 86,130 127,083 149,175 Interest Expense 10,000 9,500 8,250 Taxes Incurred 3,111 12,146 15,650 Net Profit 13,019 36,437 45,925 Net Profit/Sales 2.65% 6.43% 7.01% Projected Cash Flow Page 16 of 21 The cash flow projection shows that provisions for ongoing expenses are adequate to meet JJB's needs as the business generates cash flow sufficient to support operations. Cash $160,000 $140,000 $120,000 $100,000 NetCash Flow $80,000 Cash Balance $60,000 $40,000 $20.000 10 Month Pro Forma Cash Flow Year 1 Year 2 Year 3 Cash Received Cash from Operations Cash Sales 491,000 567,105 655,006 Subtotal Cash from Operations 491,000 567,105 655,006 Additional Cash Received Sales Tax, VAT, HST/GST Received O O New Current Borrowing O 0 EO New Other Liabilities interest-free) 0 O EO New Long-term Liabilities 0 O O Sales of Other Current Assets O O EO Sales of Long-term Assets O O EO New Investment Received 0 O FO Subtotal Cash Received 491,000 567,105 655,006 Expenditures Year 1 Year 2 Year 3 Expenditures from Operations Cash Spending 260,800 273,840 287,532 Page 17 of 21 Bill Payments 143,607 186,964 237,731 Subtotal Spent on Operations 404,407 460,804 525,263 Additional Cash Spent Sales Tax, VAT, HST/GST Paid Out O O EO Principal Repayment of Current Borrowing O 90 EO Other Liabilities Principal Repayment O O 0 Long-term Liabilities Principal Repayment EO 10,000 15,000 Purchase Other Current Assets 0 O O Purchase Long-term Assets 0 20,000 20,000 Dividends EO EO O Subtotal Cash Spent 404,407 490,804 560,263 Net Cash Flow 86,593 76,301 94,744 Cash Balance 156,593 232,894 327,637 Balance Sheet The following is a projected Balance Sheet for JJB. Pro Forma Balance Sheet Year 1 Year 2 Year 3 Assets Page 18 of 21 Current Assets Cash 156,593 232,894 327,637 Other Current Assets 12,000 12,000 12,000 Total Current Assets 168,593 244,894 339,637 Long-term Assets Long-term Assets 65,000 85,000 105,000 Accumulated Depreciation 60,000 129,000 208,350 Total Long-term Assets 5,000 (44,000) (103,350) Total Assets 173,593 200,894 236,287 Liabilities and Capital Year 1 Year 2 Year 3 Current Liabilities Accounts Payable 14,574 15,438 19,907 Current Borrowing O 0 EO Other Current Liabilities 0 EO O Subtotal Current Liabilities 14,574 15,438 19,907 Long-term Liabilities 100,000 90,000 75,000 Total Liabilities 114,574 105,438 94,907 Paid-in Capital 110,000 110,000 110,000 Retained Earnings (64,000) (50,981) (14,544) Earnings 13,019 36,437 45,925 Total Capital 59,019 95,456 141,381 Total Liabilities and Capital 173,593 200,894 236,287 Net Worth 59,019 95,456 141,381 Business Ratios The following table represents key ratios for the retail bakery and coffee shop industry. These ratios are determined by the Standard Industry Classification (SIC) Index code 5812, Eating Places. Ratio Analysis Year 1 Year 2 Year 3 Industry Profile Sales Growth 0.00% 15.50% 15.50% 7.60% Percent of Total Assets Page 19 of 21 Other Current Assets 6.91% 5.97% 5.08% 35.60% Total Current Assets 97.12% 121.90% 143.74% 43.70% Long-term Assets 2.88% -21.90% -43.74% 56.30% Total Assets 100.00% 100.00% 100.00% 100.00% Current Liabilities 8.40% 7.68% 8.42% 32.70% Long-term Liabilities 57.61% 44.80% 31.74% 28.50% Total Liabilities 66.00% 52.48% 40.17% 61.20% Net Worth 34.00% 47.52% 59.83% 38.80% Percent of Sales Sales 100.00% 100.00% 100.00% 100.00% Gross Margin 84.37% 84.37% 84.37% 60.50% Selling, General & Administrative Expenses 74.74% 71.43% 71.39% 39.80% Advertising Expenses 0.49% 1.76% 6.87% 3.20% Profit Before Interest and Taxes 5.32% 10.24% 10.66% 0.70% Main Ratios Current 11.57 15.86 17.06 0.98 Quick 11.57 15.86 17.06 0.65 Total Debt to Total Assets 66.00% 52.48% 40.17% 61.20% Pre-tax Return on Net Worth 27.33% 50.90% 43.55% 1.70% Pre-tax Return on Assets 9.29% 24.18% 26.06% 4.30% Additional Ratios Year 1 Year 2 Year 3 Net Profit Margin 2.65% 6.43% 7.01% n.a Return on Equity 22.06% 38.17% 32.48% n.a Activity Ratios Accounts Payable Turnover 10.79 12.17 12.17 n.a Payment Days 27 29 27 n.a Total Asset Turnover 2.83 2.82 2.77 n.a Debt Ratios Debt to Net Worth 1.94 1.10 0.67 n.a Current Liab. to Liab. 0.13 0.15 0.21 n.a Page 20 of 21 Liquidity Ratios Net Working Capital 154,019 229,456 319,731 na Interest Coverage 2.61 6.11 8.46 n.a Additional Ratios Assets to Sales 0.35 0.35 0.36 n.a Current Debt/Total Assets 8% 8% 8% n.a Acid Test 11.57 15.86 17.06 n.a Sales/Net Worth 8.32 5.94 4.63 n.a Dividend Payout 0.00 0.00 0.00 n.a Page 21 of 21Step by Step Solution
There are 3 Steps involved in it
Step: 1

Get Instant Access to Expert-Tailored Solutions
See step-by-step solutions with expert insights and AI powered tools for academic success
Step: 2

Step: 3

Ace Your Homework with AI
Get the answers you need in no time with our AI-driven, step-by-step assistance
Get Started


