

Answered step by step
Verified Expert Solution
Question
1 Approved Answer
I need final page completed regarding PV, capital spending, pv amount, and npv. Calibri A A 29 Wrap Text Custom Paste A 120 B IU

I need final page completed regarding PV, capital spending, pv amount, and npv. 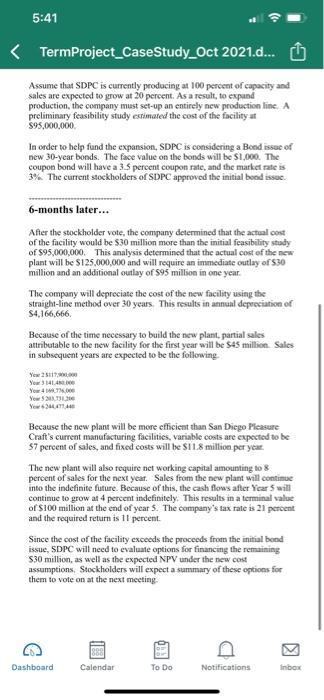
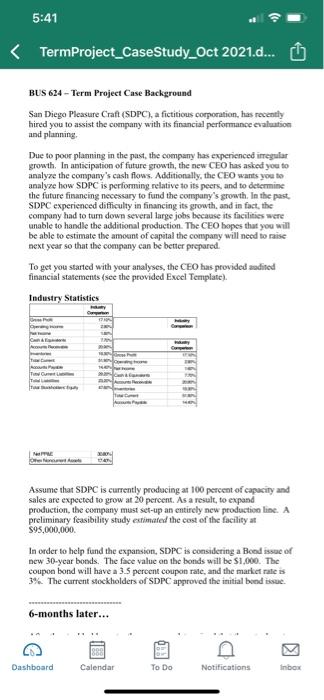
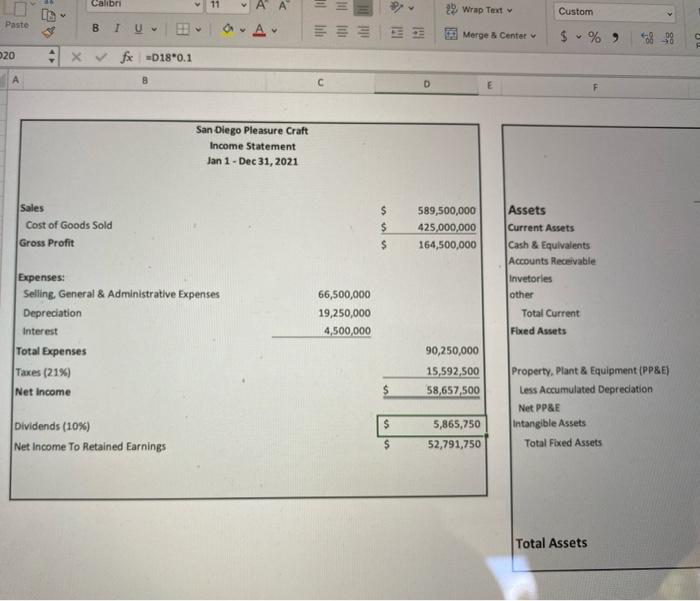
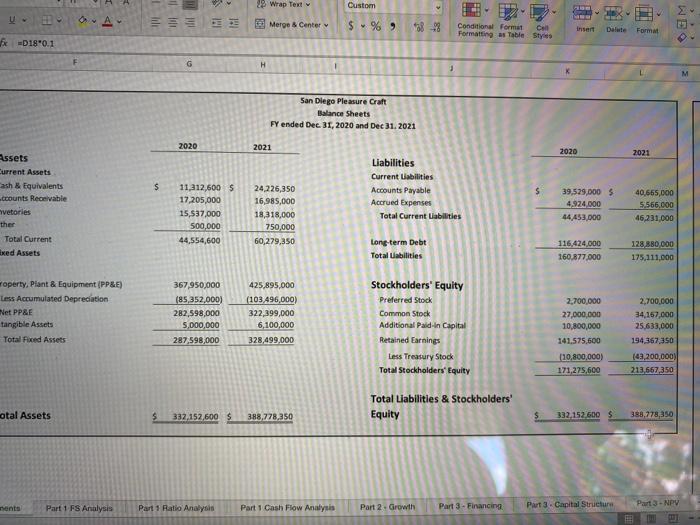
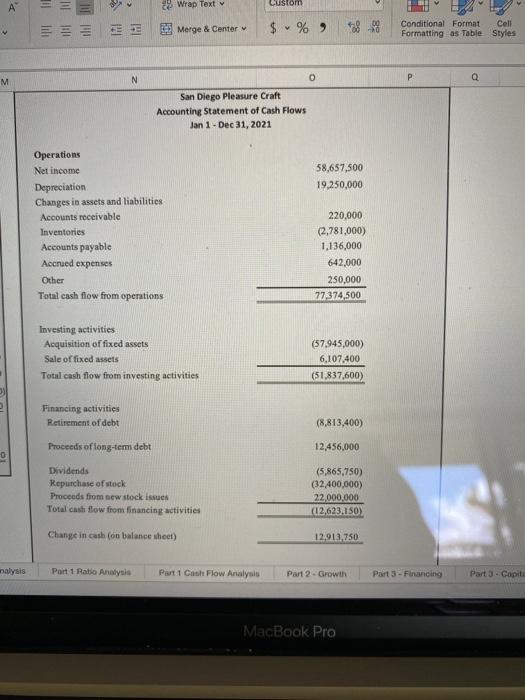
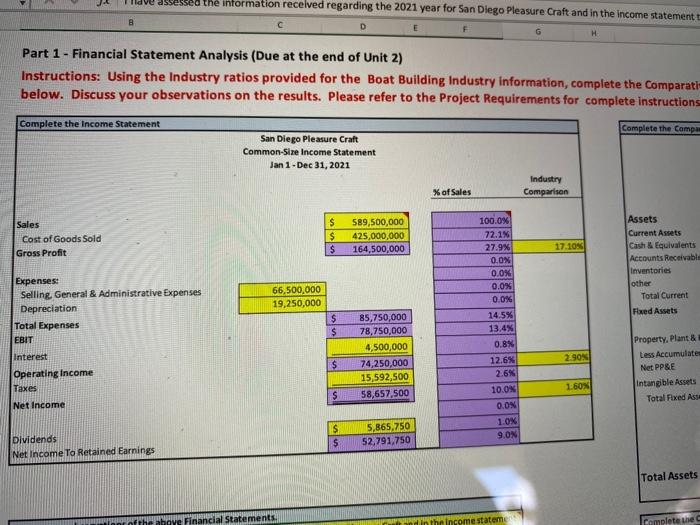
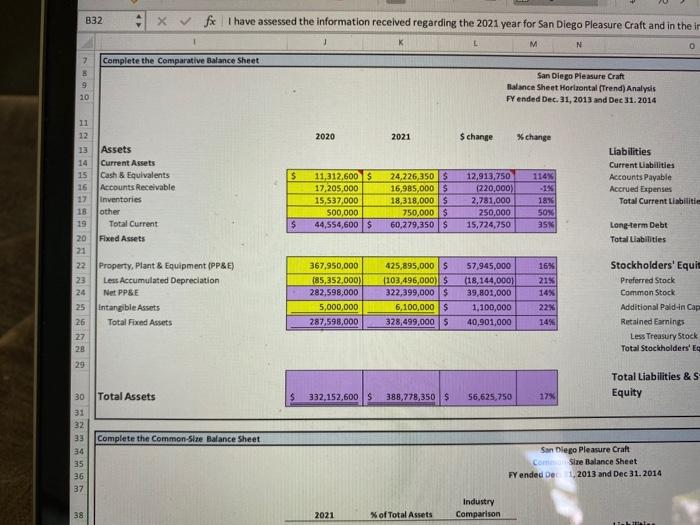
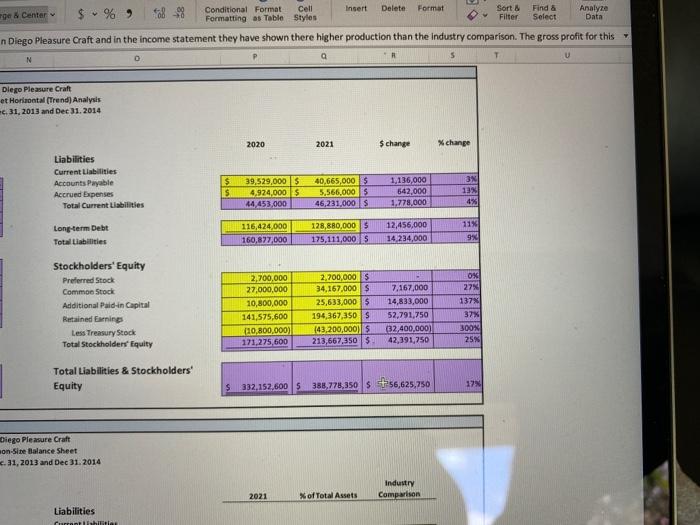
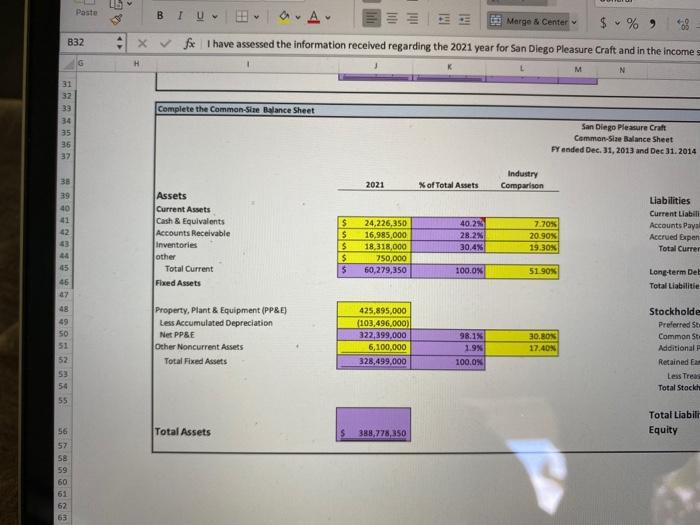
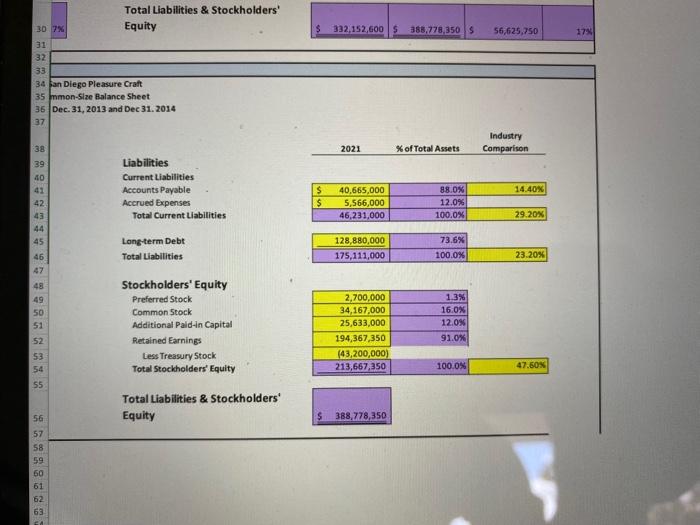
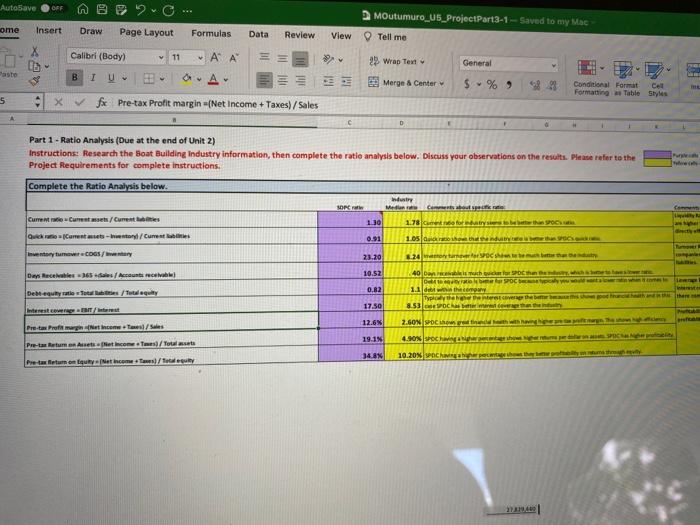
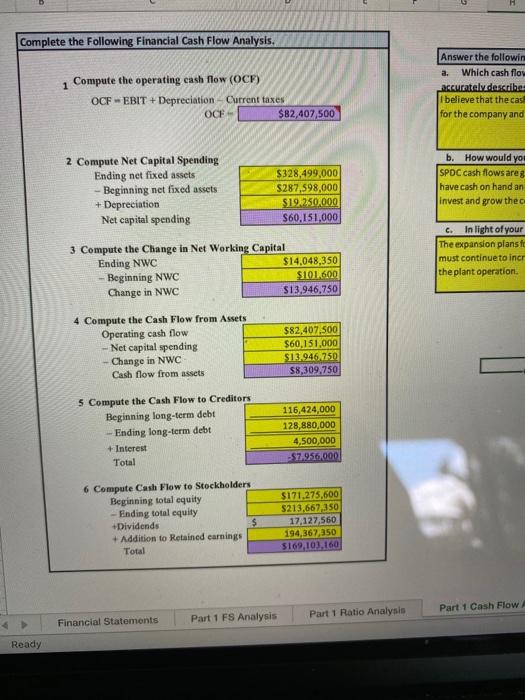
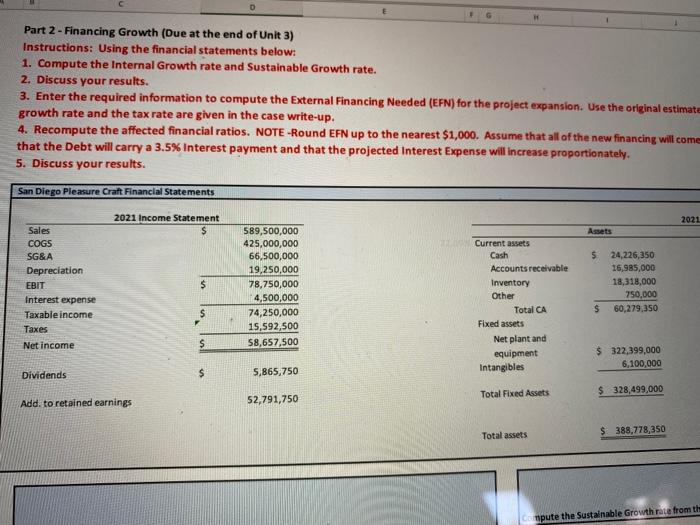
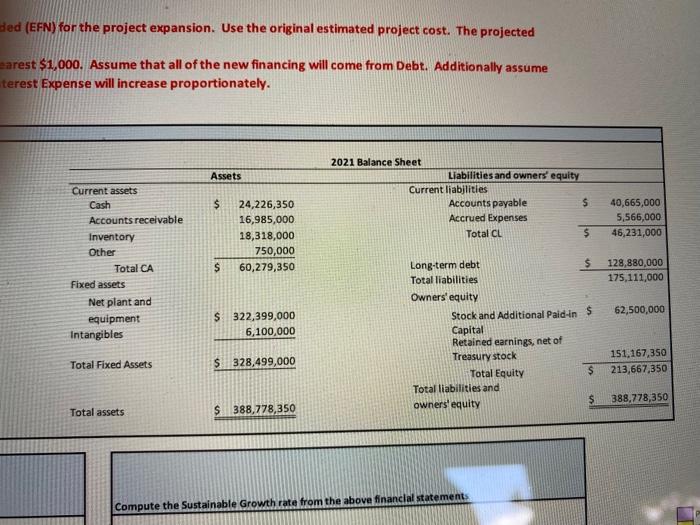
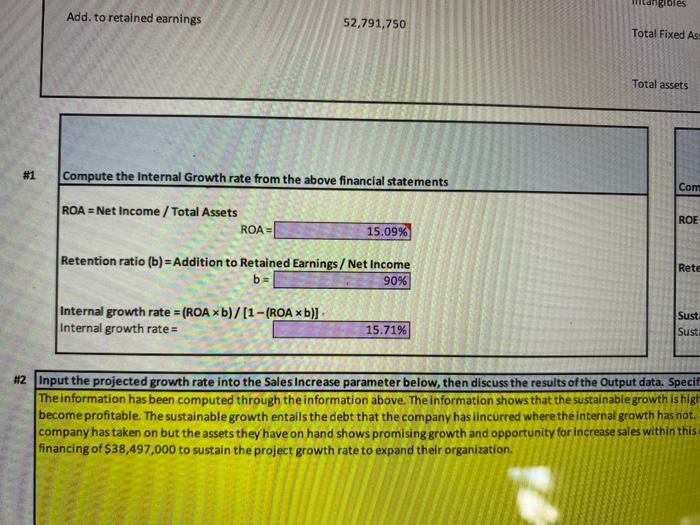
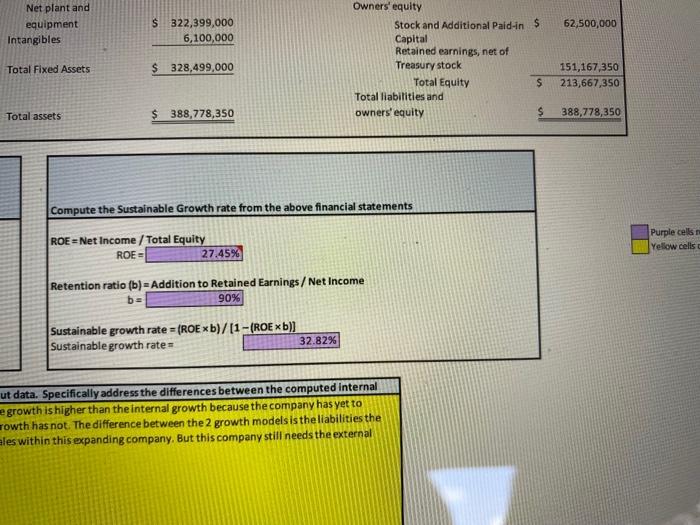
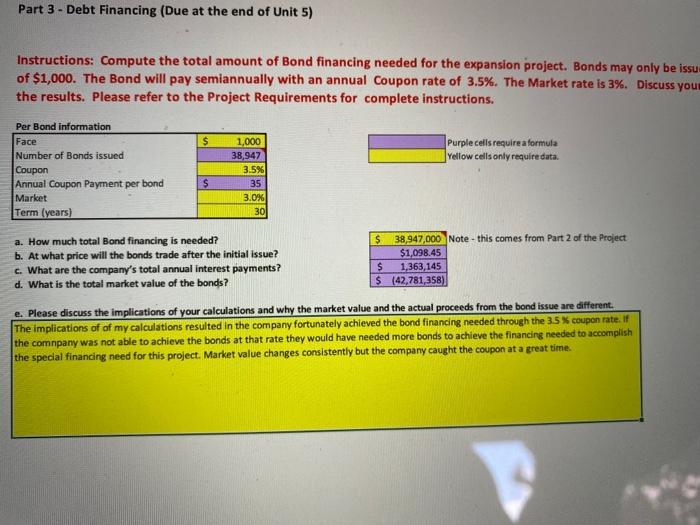
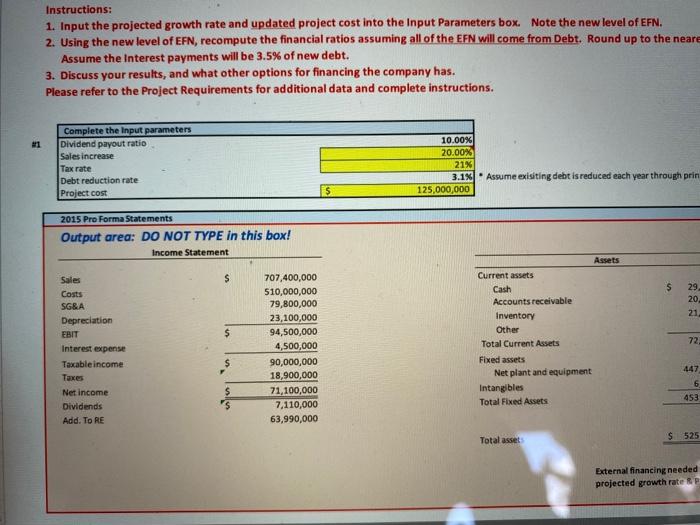
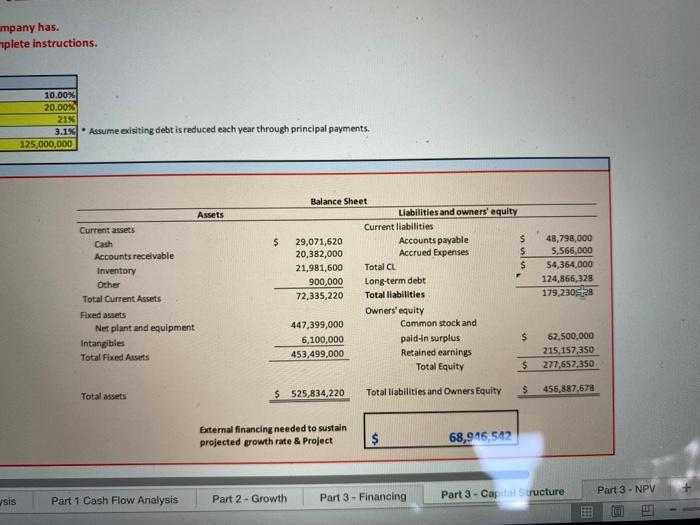
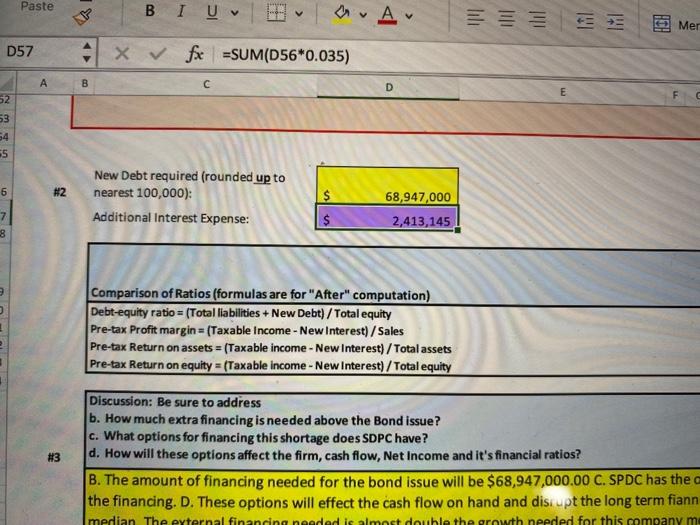
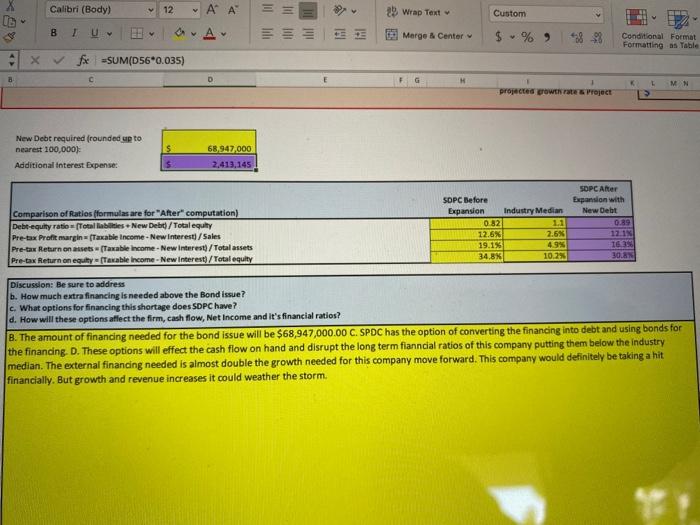
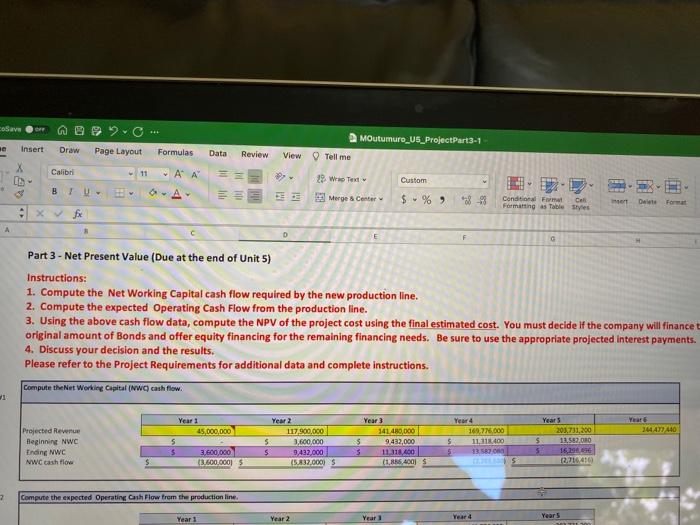
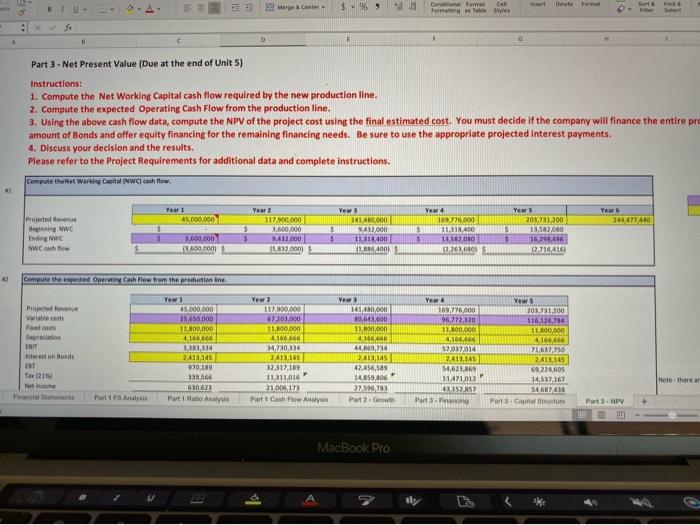
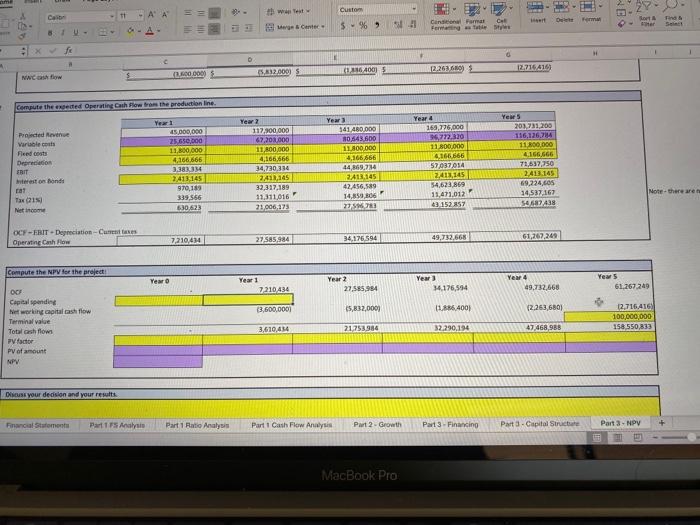
Calibri A A 29 Wrap Text Custom Paste A 120 B IU -A- Merge & Center $ % ) 20 X fx 018*0.1 B E San Diego Pleasure Craft Income Statement Jan 1 - Dec 31, 2021 Sales Cost of Goods Sold Gross Profit $ $ $ 589,500,000 425,000,000 164,500,000 Expenses: Selling General & Administrative Expenses Depreciation Interest Total Expenses Taxes (21%) Net Income Assets Current Assets Cash & Equivalents Accounts Receivable Invetories other Total Current Fixed Assets 66,500,000 19,250,000 4,500,000 90,250,000 15,592,500 58,657,500 Property. Plant & Equipment (PP&E) Less Accumulated Depreciation Net PP&E Intangible Assets Total Fixed Assets $ Dividends (10%) Net Income To Retained Earnings 5,865,750 52,791,750 Total Assets 22 Wrap Text Custom WE Merge Center $ % 9 Conditional Format Call Formatting as Table Sty Insert Delete Format F =D18*0.1 G H 1 M San Diego Pleasure Craft Balance Sheets FY ended Dec 31, 2020 and Dec 31, 2021 2020 2021 2020 2021 S Assets urrent Assets Cash & Equivalents .ccounts Receivable vetories ther Total Current axed Assets $ 11,212,600 5 17,205,000 15,537,000 500,000 44,554,600 Liabilities Current Liabilities Accounts Payable Accrued Expenses Total Current Liabilities 24.226,350 16,985,000 18,318,000 750,000 60,279,350 39,529,000 4,924.000 44,453,000 40,665,000 5.566,000 46,231,000 long-term Debt Total abilities 116,424,000 160.877.000 128 880 000 175,111,000 roperty, Piant & Equipment (PP&E) Less Accumulated Depreciation Net PP&E tangible Assets Total Fixed Assets 367,950,000 (85,352,000) 282,598,000 5,000,000 287,598,000 425,895,000 (103.496,000 322,399,000 6,100,000 328,499.000 Stockholders' Equity Preferred Stock Common Stock Additional Paid-in Capital Retained Earnings Less Treasury Stock Total Stockholders' Equity 2,700,000 27,000,000 10,800,000 141,575,500 (10,800,000) 171,275,600 2,700.000 34.167,000 25,633,000 194367.350 (43,200,000) 213,667,350 Total Liabilities & Stockholders' Equity otal Assets $ 337.152,500 $ 388.778.350 $ 332.152.600S 388,778,350 Part 1 FS Analysis Part 1 Ratio Analysis Part 1 Cash Flow Analysis Part 2 - Growth Part 3 - Financing Part 3 - NPV Part 3. Capital Structure " 2 Wrap Text Custom ilillo Merge & Center $ % 8-98 Conditional Format Cell Formatting as Table Styles M N P Q 0 San Diego Pleasure Craft Accounting Statement of Cash Flows Jan 1 - Dec 31, 2021 58,657,500 19,250,000 Operations Net income Depreciation Changes in assets and liabilities Accounts receivable Inventories Accounts payable Accrued expenses Other Total cash flow from operations 220,000 (2,781,000) 1,136,000 642,000 250,000 77,374,500 Investing activities Acquisition of fixed assets Sale of fixed assets Total cash flow from investing activities (57.945,000) 6,107,400 (51,837,600) Financing activities Retirement of debt (8,813,400) Proceeds of long-term debt 12,456,000 0 Dividends Repurchase of stock Proceeds from new stock issues Total cash flow from financing activities (5,865,750) (32.400,000) 22,000,000 (12,623.150) Change in cash (on balance sheet) 12.913.750 nalysis Part 1 Ratio Analysis Part 1 Cash Flow Analysis Part 2 - Growth Part 3 - Financing Part 3 - Copit MacBook Pro assessed the information received regarding the 2021 year for San Diego Pleasure Craft and in the income statement D E H B Part 1 - Financial Statement Analysis (Due at the end of Unit 2) Instructions: Using the Industry ratios provided for the Boat Building Industry Information, complete the Comparati- below. Discuss your observations on the results. Please refer to the Project Requirements for complete instructions Complete the Income Statement Complete the Camp San Diego Pleasure Craft Common-Size Income Statement Jan 1 - Dec 31, 2021 Industry Comparison % of Sales Sales Cost of Goods Sold Gross Profit $ $ S 589,500,000 425,000,000 164,500,000 17.10% 100.0% 1218 27.9% 0.0% OOX 0.0% 0.0% 14.5% 13.4% Assets Current Assets Cash & Equivalents Accounts Receivable Inventories other Total Current Fixed Assets 66,500,000 19,250,000 Expenses Selling General & Administrative Expenses Depreciation Total Expenses EBIT $ $ 0.8% 85,750,000 78,750,000 4,500,000 74,250,000 15,592,500 58,657,500 2.90% Interest Operating Income Taxes Net Income $ Property. Plant & Less Accumulate Net PP&E Intangible Assets Total Fixed Ass 1.60% 12.6% 2.6% 10.0% 0.ON 1.0% 9.ON $ $ $ 5,865,750 52,791,750 Dividends Net Income To Retained Earnings Total Assets heye Financial Statements the income stateme Complete the B32 x fx have assessed the information received regarding the 2021 year for San Diego Pleasure Craft and in their K L M N 0 Complete the Comparative Balance Sheet 7 B 9 10 San Diego Pleasure Craft Balance Sheet Horizontal Trend Analysis FY ended Dec 31, 2013 and Dec 31, 2014 11 12 2020 2021 Schange % change $ Assets Current Assets Cash & Equivalents Accounts Receivable Inventories other Total Current Fixed Assets 11,312,600S 17,205,000 15,537,000 500,000 44,554,600 $ 24,226,350 $ 16,985,000 $ 18,318,000 $ 750,000 $ 60,279,350 $ 12,913,750 (220,000) 2,781,000 250,000 15,724,750 114% -0% 18% 50% 35 Liabilities Current Liabilities Accounts Payable Accrued Expenses Total Current Liabilitie $ Long-term Debt Total Liabilities 14 15 16 17 18 19 20 21 22 23 24 25 26 27 28 29 16% Property, Plant & Equipment (PP&E) Less Accumulated Depreciation Net PP&E Intangible Assets Total Fixed Assets 367,950,000 185,352,000) 282,598,000 5,000,000 287,598,000 425,895,000 5 (103.496,000 $ 322,399,000 $ 6,100,000 $ 328,499,000 57,945,000 (18,144,0001 39,801,000 1,100,000 40,901,000 21% 14% 22% 14% Stockholders' Equit Preferred Stock Common Stock Additional Paid-in Cap Retained Earnings Less Treasury Stock Total Stockholders' E Total Liabilities & S Equity 30 Total Assets 332,152,600 S 388,778,350 $ 56,625,750 17% Complete the Common-Size Balance Sheet 31 32 33 34 35 36 37 San Diego Pleasure Craft CamSize Balance Sheet FY ended Dec 2013 and Dec 31. 2014 Industry Comparison 38 2021 of Total Assets LE Conditional Format ge & Center $ % Cell Insert Delete Format Sort & Find a Analyze Formatting as Table Styles Filter Select Data n Diego Pleasure Craft and in the income statement they have shown there higher production than the industry comparison. The gross profit for this N 0 a 5 T U Diego Pleasure Craft et Horizontal (Trend Analysis ec 31, 2013 and Dec 31, 2014 2020 2021 $ change % change Liabilities Current Liabilities Accounts Payable Accrued Expenses Total Current Liabilities $ S 39,529,000 $ 4.924,000 $ 44.453,000 40,665,000 $ 5,566,000 46,231,000 1,136.000 542,000 1,778,000 3 13 435 Long-term Debt Total Liabilities 116,424,000 160,877,000 128,880,000 $ 175,111,000 5 12,456,000 14 234,000 11% 9% Stockholders' Equity Preferred Stock Common Stock Additional Paid in Capital Retained Earnings Less Treasury Stock Total Stockholders' Equity 2,700,000 27,000,000 10,800,000 141,575,600 (10,800,000) 171,275,600 2,700,000 34,167,000 $ 25,633,000 $ 194,367,350 $ 143,200,000 $ 213,667.3505 7,167,000 14,833,000 52,791,750 32,400,000) 42,391,750 OX 27% 137% 37% 300% 25% Total Liabilities & Stockholders Equity $ 332,152,6005 388,778,350 $ 556,625,750 17% Diego Pleasure Craft on-Site Balance Sheet 31, 2013 and Dec 31.2014 Industry Comparison 2021 Xof Total Assets Liabilities Current liabilities LE Paste BIU a. Au Marge & Center $ % 63 x fx I have assessed the information received regarding the 2021 year for San Diego Pleasure Craft and in the income B32 G 1 M N 31 32 33 Complete the Common-Size Balance Sheet San Diego Pleasure Craft Common Size Balance Sheet FYanded Dec 31, 2013 and Dec 31, 2014 37 2021 Xof Total Assets Industry Comparison 38 39 40 41 42 Assets Current Assets Cash & Equivalents Accounts Receivable Inventories other Total Current Fixed Assets uuuu 24,226,350 16,985,000 18,318,000 750,000 60,279,350 40.2% 28.2 30.4% 7.709 20-90% 19.30% Liabilities Current Liabili Accounts Paya Accrued Expen Total Currer 65 5 100.0% 51.90% 46 Long-term Del Total Liabilitie 48 49 50 51 52 53 54 55 Property, Plant & Equipment (PP&E) Less Accumulated Depreciation Net PPSE Other Noncurrent Assets Total Fixed Assets 425,895,000 (103,496,000) 322,399,000 6,100,000 328,499,000 98.1% 1.9% 100.0% 30.BON 17.40N Stockholde Preferred sc Commons Additional Retained Less Treas Total Stockh Total Liabili Equity 56 Total Assets 388,778,350 57 58 59 60 61 62 63 332 152,600S 388,778, 350 S 56,625,750 17% Total Liabilities & Stockholders' 30 7% Equity 31 32 33 34 San Diego Pleasure Craft 35 mon-Size Balance Sheet 36 Dec 31, 2013 and Dec 31, 2014 37 2021 % of Total Assets Industry Comparison 38 39 40 41 42 43 44 45 Liabilities Current Liabilities Accounts Payable Accrued Expenses Total Current Liabilities 14.40% $ $ 40.565,000 5,566,000 46,231,000 88.0% 12.0% 100.0% 29.20% Long-term Debt Total Liabilities 128,880,000 175,111,000 73.6% 100.0% 46 23.20% 47 48 49 50 51 52 Stockholders' Equity Preferred Stock Common Stock Additional Pald-in Capital Retained Earnings Less Treasury Stock Total Stockholders' Equity 2,700,000 34,167,000 25,633,000 194,367,350 (43,200,000) 213,667,350 1.3% 16.0% 12.0% 91.0% 53 54 55 100.0% 47.50% Total Liabilities & Stockholders Equity $ 388,778,350 56 57 58 59 60 61 62 63 AutoSave OFF 2- Page Layout MOutumuro_U5_ProjectPart3-1 - Saved to my Mac ome Insert Draw Formulas Data Review View Tell me Calibrl(Body) 11 A A == 29 Wrap Text , General Waste B IU Merge & Center $% 9 98 99 Conditional Format Cell Formatting Table Styles 5 ox fx Pre-tax Profit margin (Net Income Taxes)/Sales D Part 1 - Ratio Analysis (Due at the end of Unit 2) Instructions: Research the Boat Building Industry Information, then complete the ratio analysis below. Discuss your observations on the results. Please refer to the Project Requirements for complete instructions. Complete the Ratio Analysis below. Industry Men . Campe 130 1.78mfort Current Cust/Currentes Qudurres-tary/current 0.91 1.05 android Inventory many 23.20 3.24 Woch De Recer 365 secount 10.52 40 Dance much in the DU 1.1 the company 0.82 Debe equations / Tulaquity 17.50 8.53 12.6% 2.6ONIC Pre-tex Prof National Sales 19.1% 4.90 och Pre-tretman Arts et income.es/Yout 14.8% 10.20% ench um Preturn on the hostel Complete the following Financial Cash Flow Analysis. 1 Compute the operating eash flow (OCF) OCF-EBIT + Depreciation - Current taxes OCE $82,407,500 Answer the followin a. Which cash flow accurately describe I believe that the cas for the company and 2 Compute Net Capital Spending Ending net fixed assets - Beginning net fixed assets + Depreciation Net capital spending $328,499,000 $287,598,000 $19.250.000 S60,151.000 b. How would you SPDC cash flows areg have cash on hand an invest and grow the 3 Compute the Change in Net Working Capital Ending NWC $14,048,350 --- Beginning NWC $101.600 Change in NWC $13,946,750 C. In light of your The expansion plans fo must continue to incr the plant operation 4 Compute the Cash Flow from Assets Operating cash flow - Net capital spending - Change in NWC Cash flow from assets $82,407,500 $60,151,000 $13.946,250 $8,309.750 5 Compute the Cash Flow to Creditors Beginning long-term debt - Ending long-term debt + Interest Total 116.424,000 128,880,000 4,500,000 $7.956.000 6 Compute Cash Flow to Stockholders Beginning total equity - Ending total equity Dividends $ Addition to Retained earnings Total $171,275,600 S213,667,350 17,127,560 194,367,350 $169,103,160 Part 1 Ratio Analysis Part 1 Cash Flow Financial Statements Part 1 FS Analysis Ready Part 2 - Financing Growth (Due at the end of Unit 3) Instructions: Using the financial statements below: 1. Compute the Internal Growth rate and Sustainable Growth rate. 2. Discuss your results. 3. Enter the required information to compute the External Financing Needed (EFN) for the project expansion. Use the original estimate growth rate and the tax rate are given in the case write-up. 4. Recompute the affected financial ratios. NOTE-Round EFN up to the nearest $1,000. Assume that all of the new financing will come that the Debt will carry a 3.5% Interest payment and that the projected Interest Expense will increase proportionately. 5. Discuss your results. San Diego Pleasure Craft Financial Statements 2021 Income Statement 2021 Assets 5 $ Sales COGS SG&A Depreciation EBIT Interest expense Taxable income Taxes Net income 589,500,000 425,000,000 66,500,000 19,250,000 78,750,000 4,500,000 74,250,000 15,592,500 58,657,500 Current assets Cash Accounts receivable Inventory Other Total CA Fixed assets Net plant and equipment Intangibles 24,226,350 16,985,000 18,318,000 750,000 60,279,350 $ S $ $ 322,399,000 6,100,000 Dividends $ 5,865,750 Total Fixed Assets $ 328,499,000 Add. to retained earnings 52,791,750 Total assets $ 388,778,350 pute the Sustalnable Growth rate from the ded (EFN) for the project expansion. Use the original estimated project cost. The projected earest $1,000. Assume that all of the new financing will come from Debt. Additionally assume terest Expense will increase proportionately. Assets 2021 Balance Sheet Liabilities and owners' equity Current liabilities Accounts payable S Accrued Expenses Total CL $ $ Current assets Cash Accounts receivable Inventory Other Total CA Fixed assets Net plant and equipment Intangibles 24,226,350 16,985,000 18,318,000 750,000 60,279,350 40,665,000 5,566,000 46,231,000 $ 128,880,000 175,111,000 62,500,000 $ 322,399,000 6,100,000 Long-term debt $ Total liabilities Owners' equity Stock and Additional Paid-in $ Capital Retained earnings, net of Treasury stock Total Equity $ Total liabilities and owners' equity $ Total Fixed Assets $ 328,499,000 151,167,350 213,667,350 388.778,350 Total assets $ 388,778,350 Compute the Sustainable Growth rate from the above financial statements Bioles Add. to retained earnings 52,791,750 Total Fixed As Total assets #1 Compute the Internal Growth rate from the above financial statements Com ROA = Net Income / Total Assets ROA ROE 15.09% Retention ratio (b) = Addition to Retained Earnings / Net Income b= 90% Rete Internal growth rate = (ROA b)/(1-(ROA b)] Internal growth rate= Sust Sust 15.71% #2 Input the projected growth rate into the Sales Increase parameter below, then discuss the results of the Output data. Specif The information has been computed through the information above. The information shows that the sustainable growth is high become profitable. The sustainable growth entails the debt that the company has incurred where the internal growth has not. company has taken on but the assets they have on hand shows promising growth and opportunity for increase sales within this financing of $38,497,000 to sustain the project growth rate to expand their organization. Net plant and equipment Intangibles 62,500,000 $ 322,399,000 6,100,000 Owners' equity Stock and Additional Paid-in $ Capital Retained earnings, net of Treasury stock Total Equity s Total liabilities and owners' equity Total Fixed Assets $ 328,499,000 151,167,350 213,667,350 Total assets $ 388,778,350 388,778,350 Compute the Sustainable Growth rate from the above financial statements ROE = Net Income / Total Equity ROE 27.45% Purple cells Yellow cells Retention ratio (b) = Addition to Retained Earnings / Net Income 90% be Sustainable growth rate= (ROExb)/(1 - (ROE xb)] Sustainable growth rate 32.82% ut data. Specifically address the differences between the computed internal e growth is higher than the internal growth because the company has yet to rowth has not. The difference between the 2 growth models is the liabilities the ales within this expanding company. But this company still needs the external Part 3 - Debt Financing (Due at the end of Unit 5) Instructions: Compute the total amount of Bond financing needed for the expansion project. Bonds may only be issu of $1,000. The Bond will pay semiannually with an annual Coupon rate of 3.5%. The Market rate is 3%. Discuss you the results. Please refer to the Project Requirements for complete instructions. $ Purple cells require a formula Yellow cells only require data Per Bond information Face Number of Bonds issued Coupon Annual Coupon Payment per bond Market Term (years) 1,000 38,947 3.5% 35 3.0% 30 $ a. How much total Bond financing is needed? b. At what price will the bonds trade after the initial issue? c. What are the company's total annual interest payments? d. What is the total market value of the bonds? $ 38,947,000 Note- this comes from Part 2 of the Project $1,098.45 $ 1,363,145 $ (42.781,358) e. Please discuss the implications of your calculations and why the market value and the actual proceeds from the bond issue are different. The implications of of my calculations resulted in the company fortunately achieved the bond financing needed through the 3.5 % coupon rate. If the company was not able to achieve the bonds at that rate they would have needed more bonds to achieve the financing needed to accomplish the special financing need for this project. Market value changes consistently but the company caught the coupon at a great time. Instructions: 1. Input the projected growth rate and updated project cost into the Input Parameters box. Note the new level of EFN. 2. Using the new level of EFN, recompute the financial ratios assuming all of the EFN will come from Debt. Round up to the neare Assume the Interest payments will be 3.5% of new debt. 3. Discuss your results, and what other options for financing the company has. Please refer to the Project Requirements for additional data and complete instructions. 1 Complete the input parameters Dividend payout ratio Sales increase Tax rate Debt reduction rate Project cost 10.00% 20.00% 21% 3.1% Assume existing debt is reduced each year through prin 125,000,000 2015 Pro Forma Statements Output area: DO NOT TYPE in this box! Income Statement $ $ 29 20 21 Sales Costs SGRA Depreciation EBIT Interest expense Taxable income Taxes Net income Dividends Add. To RE 72 Assets Current assets Cash Accounts receivable Inventory Other Total Current Assets Fixed assets Net plant and equipment Intangibles Total Fixed Assets 707,400,000 510,000,000 79,800,000 23,100,000 94,500,000 4,500,000 90,000,000 18,900,000 71,100,000 7,110,000 63,990,000 $ 447 5 453 Total asset $ 525 External financing needed projected growth rate e mpany has. plete instructions. 10.00% 20.00% 21% 3.1% Assume existing debt is reduced each year through principal payments. 125,000,000 $ Assets Current assets Cash Accounts receivable Inventory Other Total Current Assets Fixed assets Net plant and equipment Intangibles Total Fixed Assets Balance Sheet Liabilities and owners' equity Current liabilities 29,071,620 Accounts payable $ 20,382,000 Accrued Expenses $ 21,981,600 Total CL $ 900.000 Long-term debt 72,335,220 Total liabilities Owners'equity 447,399,000 Common stock and 6,100,000 paid-in surplus $ 453,499,000 Retained earnings Total Equity $ 48,798,000 5,566,000 54,364,000 124,866,328 179,2305128 62,500,000 215,157,350 277,657,350 $ Total assets $ 525,834,220 Total liabilities and Owners Equity 456,887,678 External financing needed to sustain projected growth rate & Project $ 68,946,542 Part 3 - NPV sis Part 1 Cash Flow Analysis Part 2 - Growth Part 3 - Capital Structure Part 3 - Financing 51 Paste BIU V V a. Av CH Mer D57 x Xfx =SUM(D56*0.035) A B D E 52 53 54 55 6 #2 New Debt required (rounded up to nearest 100,000): Additional Interest Expense: 68,947,000 2,413,145 7 8 2 Comparison of Ratios (formulas are for "After" computation) Debt-equity ratio = (Total liabilities + New Debt) / Total equity Pre-tax Profit margin = (Taxable income - New Interest) / Sales Pre-tax Return on assets = (Taxable income - New Interest) / Total assets Pre-tax Return on equity = (Taxable income - New Interest) /Total equity = #3 Discussion: Be sure to address b. How much extra financing is needed above the Bond issue? c. What options for financing this shortage does SDPC have? d. How will these options affect the firm, cash flow, Net Income and it's financial ratios? B. The amount of financing needed for the bond issue will be $68,947,000.00 C. SPDC has the the financing. D. These options will effect the cash flow on hand and disrupt the long term fiann median The external financing needed is almost double the growth needed for this company m Calibri (Body) v 12 == Custom - A A 29 Wrap Text Marge & Center U == = | HE += % 9 Conditional Format Formatting as Table =SUM(D56*0.035) D G MN projectes rotate Project New Debt required frounded up to nearest 100,000) Additional interest Expense: s 68.947.000 2,413,145 Comparison of Ratios (formulas are for "After computation) Debt-equity ratio [Totallaties New Debit/Total equilty Pre-tax Profit margin (Taxable income. New interest/Sales Pre-tax Return on assets [Taxable income-New interest/Total assets Pre-tax Return on equity Taxable income - New Interest)/Total equity SDPC Before Expansion Industry Median 082 1.1 12.6% 2.6% 19.1% 4.9% 34.8% 10.2% SDPC Atter Expansion with New Debt 0.89 17.1% 16.356 30. Discussion: Be sure to address b. How much extra financing is needed above the Bond issue? c. What options for financing this shortage does SDPC have? d. How will these options affect the firm, cash flow, Net Income and it's financial ratios? B. The amount of financing needed for the bond issue will be $68,947,000.00 C. SPDC has the option of converting the financing into debt and using bonds for the financing. D. These options will effect the cash flow on hand and disrupt the long term fiancial ratios of this company putting them below the industry median. The external financing needed is almost double the growth needed for this company move forward. This company would definitely be taking a hit financially. But growth and revenue increases it could weather the storm. Save 2 MOutumuro_05_ProjectPart3-1 View Tell me Insert Draw Page Layout Formulas Data Review X Calibri 11 - A A 19 Wrio Text Custom OA Merge Center 3 B : x x $ % ) 18-23 Conditional mat Ces Formatting as Table Styles Delete Format E Part 3 - Net Present Value (Due at the end of Unit 5) Instructions: 1. Compute the Net Working Capital cash flow required by the new production line. 2. Compute the expected Operating Cash Flow from the production line. 3. Using the above cash flow data, compute the NPV of the project cost using the final estimated cost. You must decide if the company will finance original amount of Bonds and offer equity financing for the remaining financing needs. Be sure to use the appropriate projected interest payments. 4. Discuss your decision and the results. Please refer to the Project Requirements for additional data and complete instructions. Compute the Net Working Capital (NW) cash flow. 21 144477 440 Projected Revenue Beginning NwC Ending wc NWC cash flow Year 1 45,000,000 5 $ 3.600.000 (3.600.00015 Year 2 117.900.000 5 3.600.000 5 9.492.000 (50832,000) Year 3 141.480,000 $ 9432,000 5 11 318.400 (1,400S Year 4 169,716.000 5 11,118400 5 13.57 5 Years 203.731,200 S 12.582.000 5 16,29.01 12.2004 S 7 Compute the expected Operating Cash Flow from the production line Year 1 Year 2 Year Year 4 Years 1 $ % ) Carrer F Delete Font BU - OA Xfx D 1 Part 3 - Net Present Value (Due at the end of Unit 5) Instructions: 1. Compute the Net Working Capital cash flow required by the new production line. 2. Compute the expected Operating Cash Flow from the production line. 3. Using the above cash flow data, compute the NPV of the project cost using the final estimated cost. You must decide if the company will finance the entire pre amount of Bonds and offer equity financing for the remaining financing needs. Be sure to use the appropriate projected interest payments. 4. Discuss your decision and the results. Please refer to the Project Requirements for additional data and complete instructions. Compute the Net Working Capital WC cash flow. Year 1 45,000,000 Yes 244 A77440 5 Projected Reve Ben WC Ending we Wash flow 5 5 Year 117.900.000 3.000.000 3,412,000 (5,812.000) Year 341 410.000 $ 94,000 $ 11. 400 1640015 Wewe 162.770.000 5 11,31 40 5 13. DEC (2.263.680 5 5 Years 203,721 300 13,522.000 15,298,496 3,600,000 (1.600.000 0.716.4163 Compute the speed Operating Cash Flow from the production line Projecte www.com Facom Orion ERIT on Bonde Yew 1 45.000.000 15/650.000 11.800,000 2.166.66 3.383,134 2,411,145 970,189 339566 630.623 Part Analysis Yew 2 117,900,000 67,201,000 11.800.000 4,166.666 34.730.334 241111 32.317,109 Yew 141/480,000 16,613,000 11,00,000 26 449,234 2413,45 42.456,583 16.159,806 22 23 Part 2. Grow Year 169.276.000 96,722,120 11,100,000 1416644 57,087,014 2,411,145 54,6258 11 471012 4115 Part TES 203231 200 116,126,784 11.000.000 1. 71,632.750 2,413,165 69,224.605 14,517,167 5467438 Parts Capit TXIN 110110 Note-there ar 21.005.122 Part 1 Cash For Any Part NOV MacBook Pro Percent $%% Cena FW Delete Font F bat XFx Part 3 .Net Present Value (Due at the end of Unit 5) Instructions: 1. Compute the Net Working Capital cash flow required by the new production line. 2. Compute the expected Operating Cash Flow from the production line. 3. Using the above cash flow data, compute the NPV of the project cost using the final estimated cost. You must decide if the company will finance the entire pre amount of Bonds and offer equity financing for the remaining financing needs. Be sure to use the appropriate projected Interest payments. 4. Discuss your decision and the results. Please refer to the Project Requirements for additional data and complete instructions. Compute the Net Working Capital NWC hf. 21 Year 1 3.000.000 Yes 244 A77440 Project Revers Begin WC Ending we wash fow 5 5 Year 117.900.000 3.000.000 5,412,000 (5,817.000) Year 341.410.000 $ 42.000 $ 11.118.400 14001 5. 5 Yew 16.276.000 11 SIRADO 13. DEO 2.263.66 Years 203721 300 13,582.000 16,293,496 5 3,000,000 01.600.000 0.716.416 Compare the speed Operating Cash Flow from the production line Projecten Vale con Falco Orion ht erron Bonde A5.000.000 75450.000 11.100.000 4.166666 3,383,114 2,411,145 970.189 339566 630623 Part Analysis Year 2 117,900,000 67,201.000 11.800.000 4,166866 34.730.334 2411145 32.317,109 Vw 141/430,000 39,641,400 11,00,000 16 44.169,224 2,413,145 42.456,589 1459.806 27 201 Part2.row Year 109.776.000 96,272,120 11 M00.000 14166.40 57,017,014 2.41.14S 54,623,869 11A71012 43157 Part Yes 203,731,200 116,120,214 11.200,000 4,165,666 71,612150 2,413,145 69,224.605 14,517,167 546743 Para Capil Structure TCHINI come 110110 Note thereas PF Analys 21.005 123 Part 1 Cash For Any Part 3. NOV MacBook Pro Custom Case RES 11 ' 0-A thwest Cente Cal . Dum 5% 1 Canon Parmar Ferma l xf 6 c 12.716 4163 5,812.000) 12.263.680) (1116 400) 5 (3.600.000 WC at Commute the deed Operating Cash Flowbrom the production line Poneded Revue Variable costs Fleed costs Der ERIT Interest Bonde rat Tax (21 Net income Year 45.000.000 25.650.000 11,00.000 4,166 666 3.38331 2,413,145 970,183 339556 6:30 623 Year 2 117.900.000 67,200.000 11,800.000 4,166,666 34,730,334 211,145 32,317,189 Year 3 341 480.000 30.545.600 1.800.000 4,166666 44,869,714 241.145 42,456,589 14.859 06 2753 Year 4 163.776.000 36,772,320 11 800.000 61666 57037014 2,413,145 54,623,869 11,471,012 83 152857 Year 5 203,731,200 116,126714 11.000 4.166GGG 71,617.750 2,412145 69,224,LOS 14,537, 167 56687438 Note- there are 11.311.016 21,006,173 OCY-FRIT Depreciation - Curses Operating Cash Flow 27585984 34,176594 49,732,668 7,210.414 61,267,200 Compute the NPV for the project Year Year 1 7210434 Year 2 27,585,954 Year 14.176,594 Year 4 49,732,668 Years 61,267,249 13,600,000 15,832,0001 (1.686.400) 2.263,680) OCH Capital spending Networking capital cash flow Terminal value Toblash flows PV for PV of amount NPV 12,716416 100,000,000 158,550,833 3,610,414 21,753384 32.290.194 47,468,988 Discuss your decision and your results. Financial Statement Part 1 75 Analysis Part 1 Ratio Analysis Part 1 Cash Flow Analysis Part 2 - Growth Part 3 - Financing Part 3. Capital Structure Part 3. NPV MacBook Pro 5:41 Step by Step Solution
There are 3 Steps involved in it
Step: 1

Get Instant Access to Expert-Tailored Solutions
See step-by-step solutions with expert insights and AI powered tools for academic success
Step: 2

Step: 3
Ace Your Homework with AI
Get the answers you need in no time with our AI-driven, step-by-step assistance
Get Started
Mathematics Of Finance
Authors: Petr Zima
2nd Edition
0070082030, 9780070082038