

Answered step by step
Verified Expert Solution
Question
1 Approved Answer
I need Gannt chart for each Queue 1 and 2 Exercise 2: Consider below table of four processes under Multi-level queue scheduling. Queue number denotes
I need Gannt chart for each Queue 1 and 2 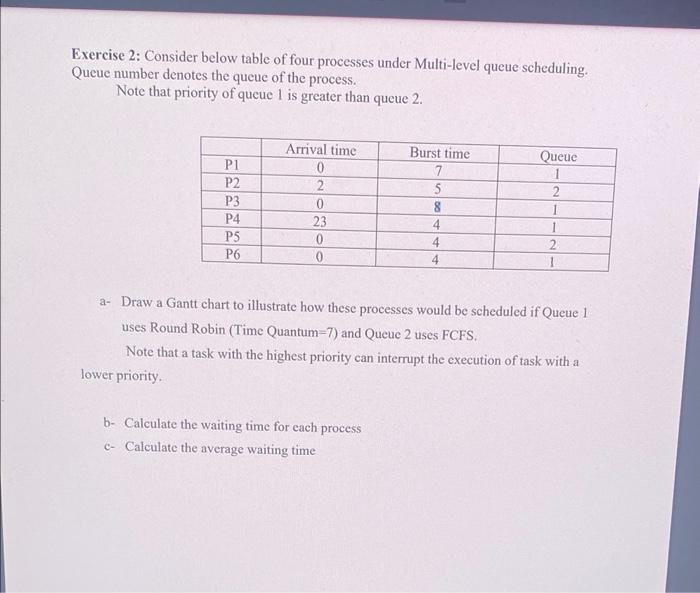
Exercise 2: Consider below table of four processes under Multi-level queue scheduling. Queue number denotes the queue of the process. Note that priority of queue 1 is greater than queue 2. a- Draw a Gantt chart to illustrate how these processes would be scheduled if Queue 1 uses Round Robin (Time Quantum=7) and Queue 2 uses FCFS. Note that a task with the highest priority can interrupt the execution of task with a lower priority. b- Calculate the waiting time for each process c- Calculate the average waiting time Step by Step Solution
There are 3 Steps involved in it
Step: 1

Get Instant Access to Expert-Tailored Solutions
See step-by-step solutions with expert insights and AI powered tools for academic success
Step: 2

Step: 3
Ace Your Homework with AI
Get the answers you need in no time with our AI-driven, step-by-step assistance
Get Started
Database And Expert Systems Applications 24th International Conference Dexa 2013 Prague Czech Republic August 2013 Proceedings Part 2 Lncs 8056
Authors: Hendrik Decker ,Lenka Lhotska ,Sebastian Link ,Josef Basl ,A Min Tjoa
2013th Edition
3642401724, 978-3642401725