

Answered step by step
Verified Expert Solution
Question
1 Approved Answer
I need help calculating the formulas listed in yellow for each of the 4 years using the financial statements provided. Caico the date of each
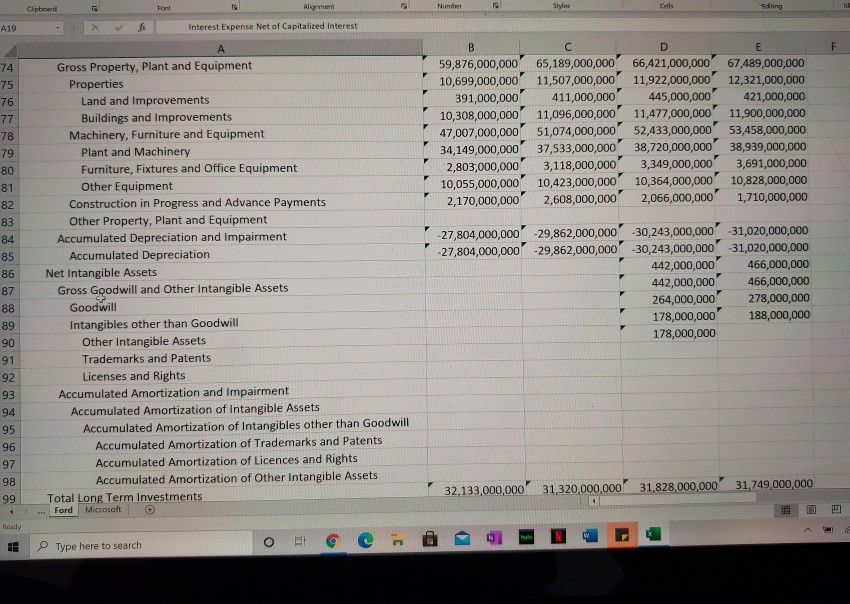
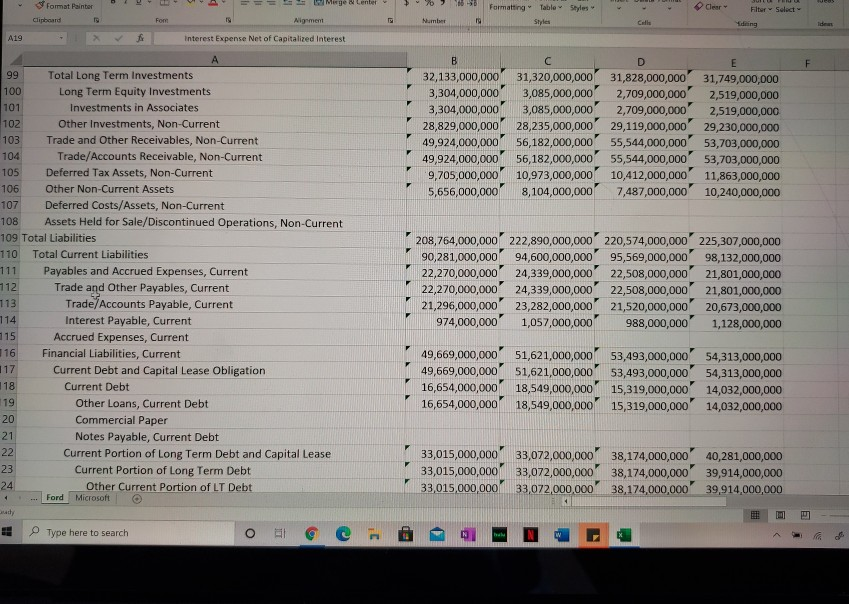
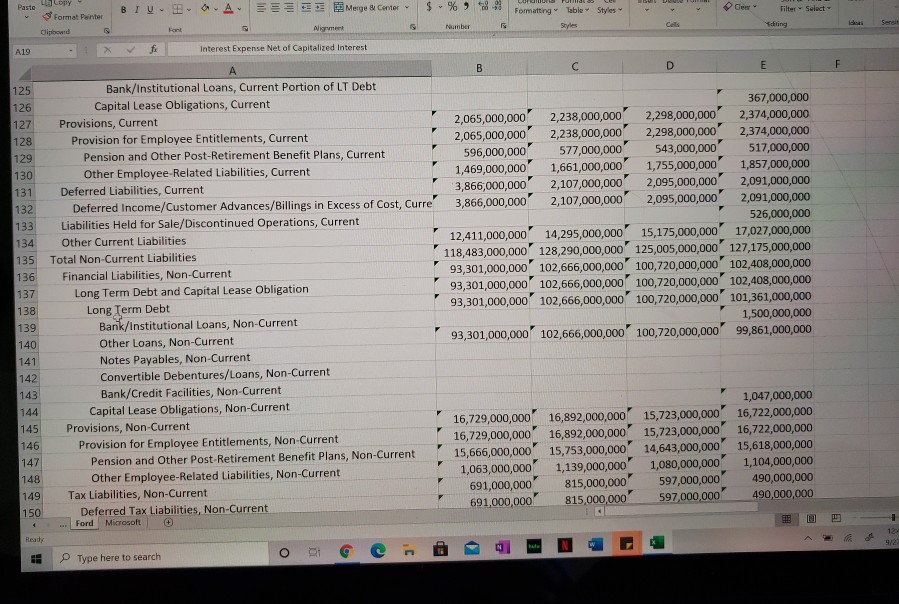
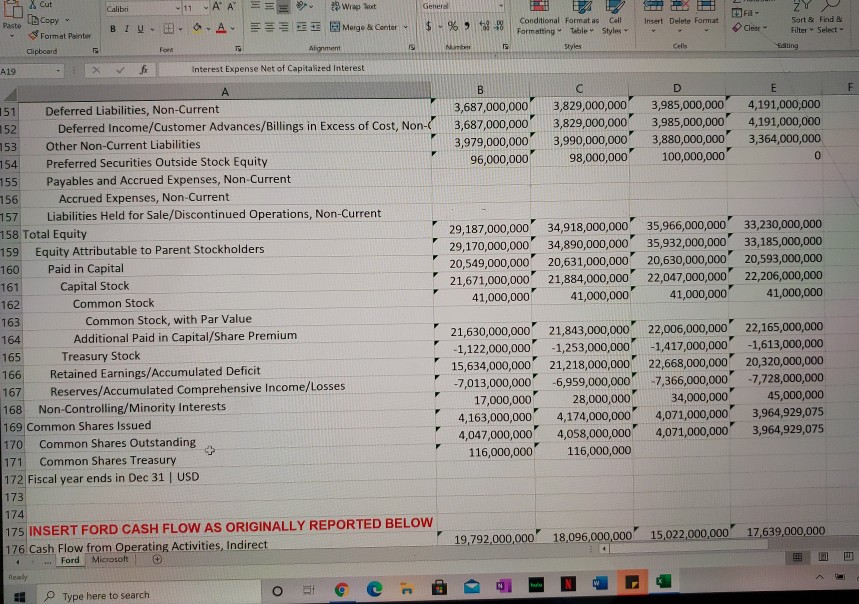
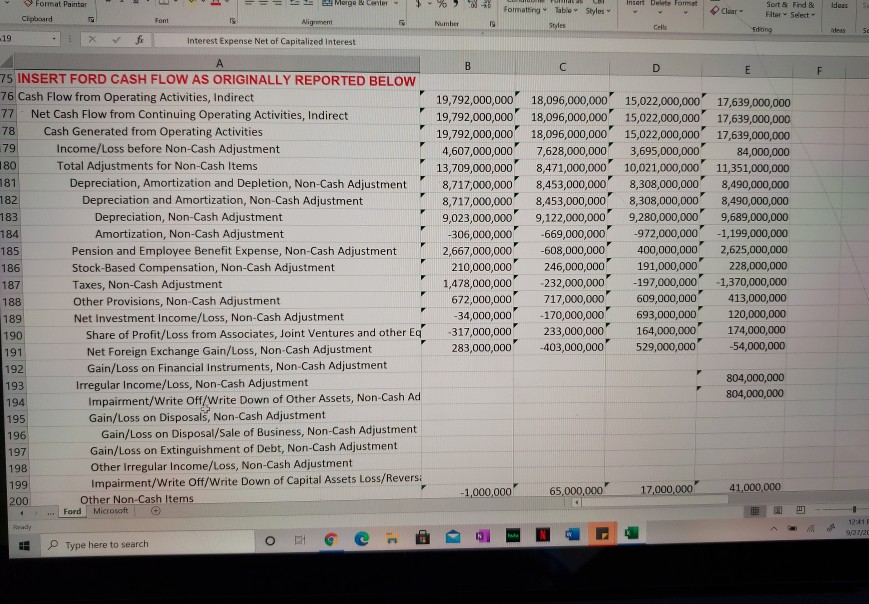
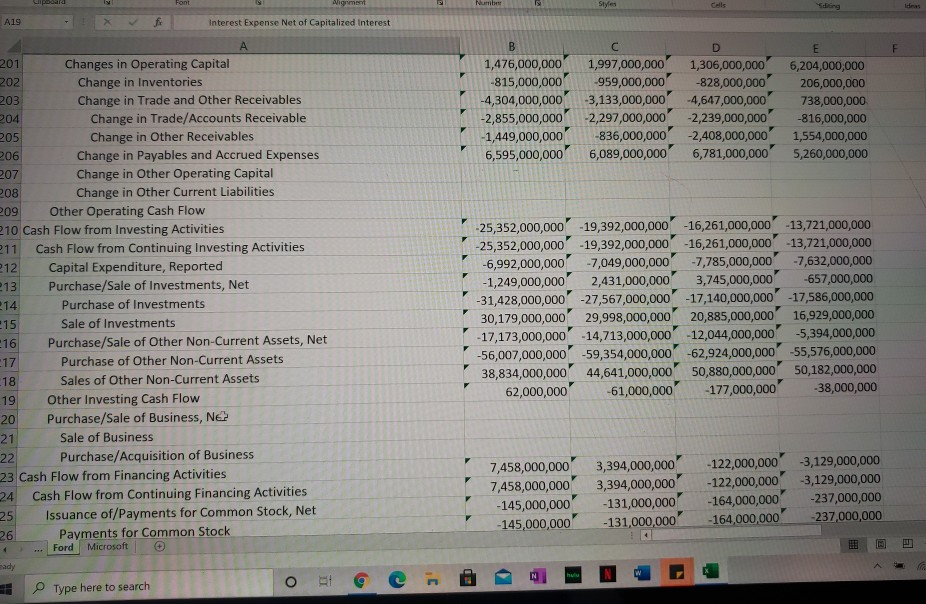
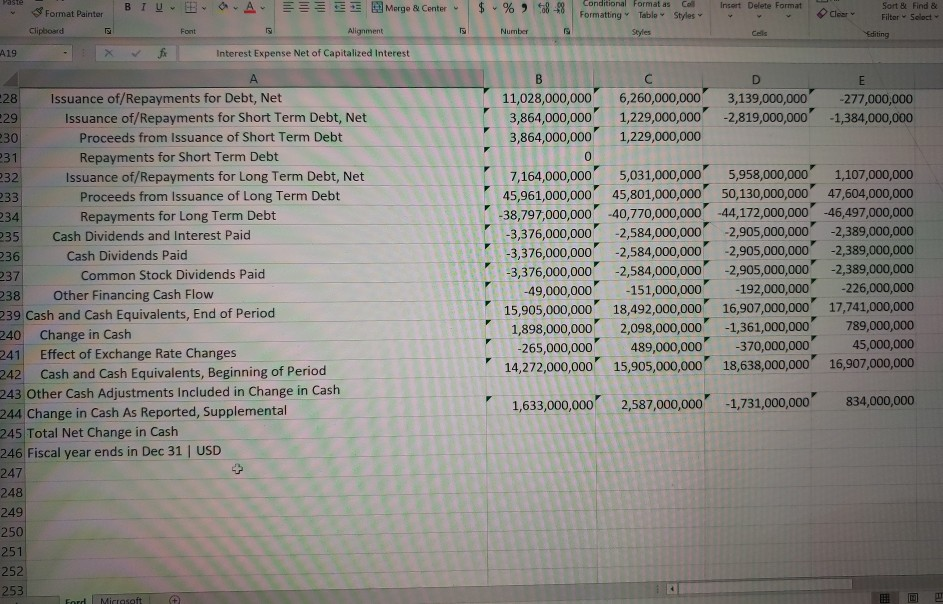
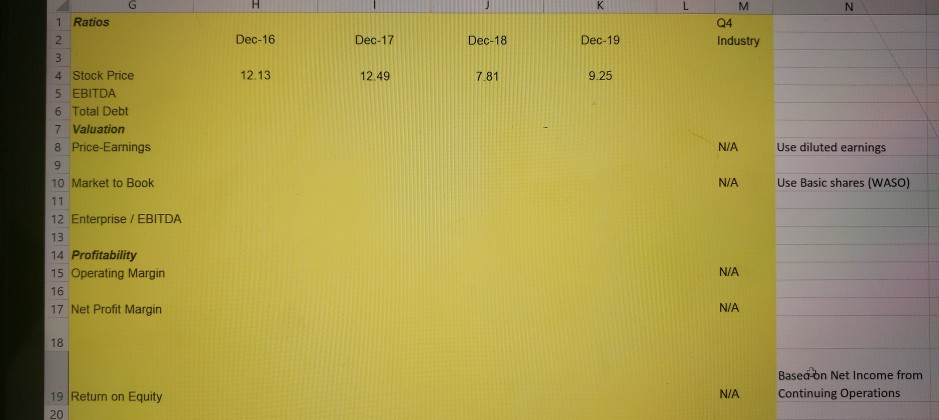
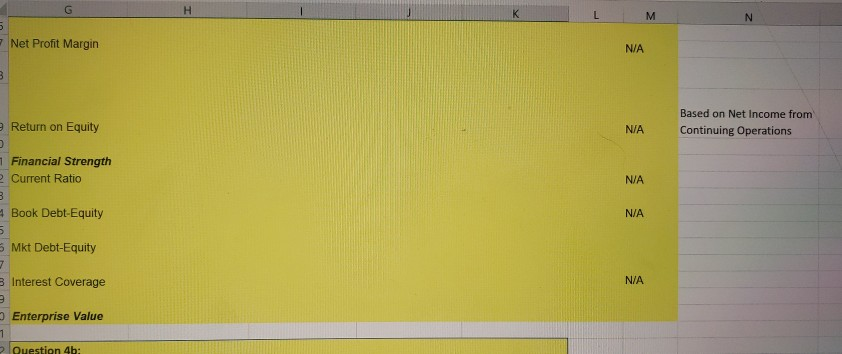
I need help calculating the formulas listed in yellow for each of the 4 years using the financial statements provided.
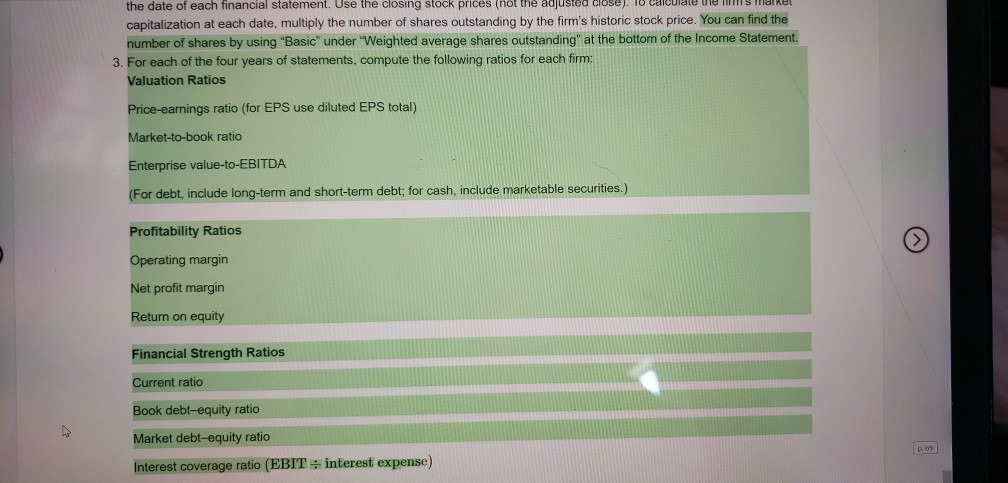
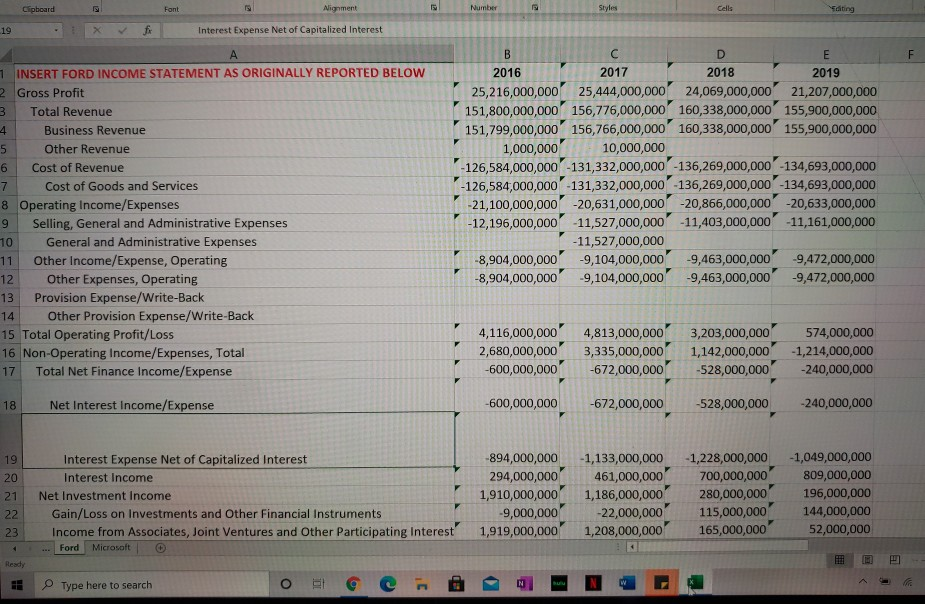
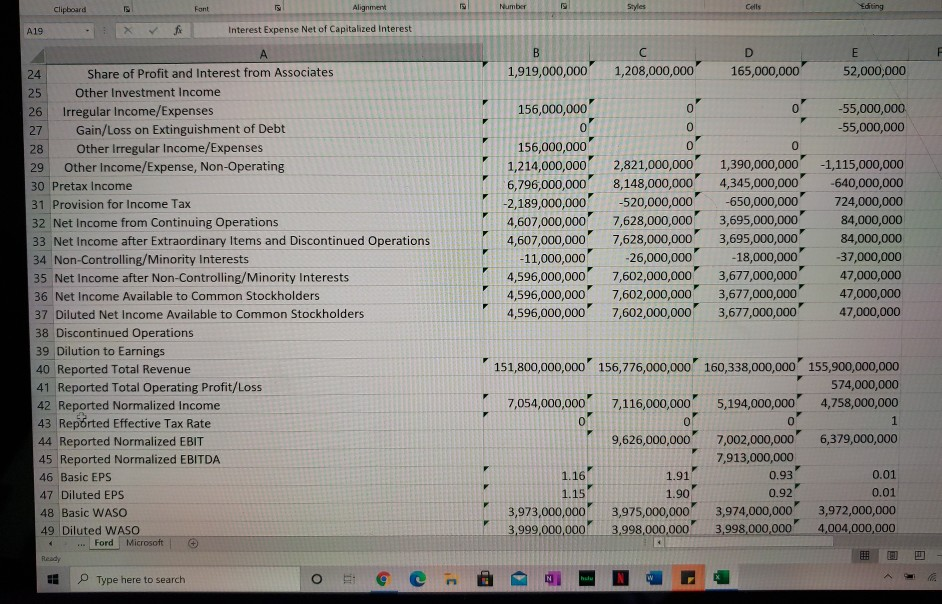
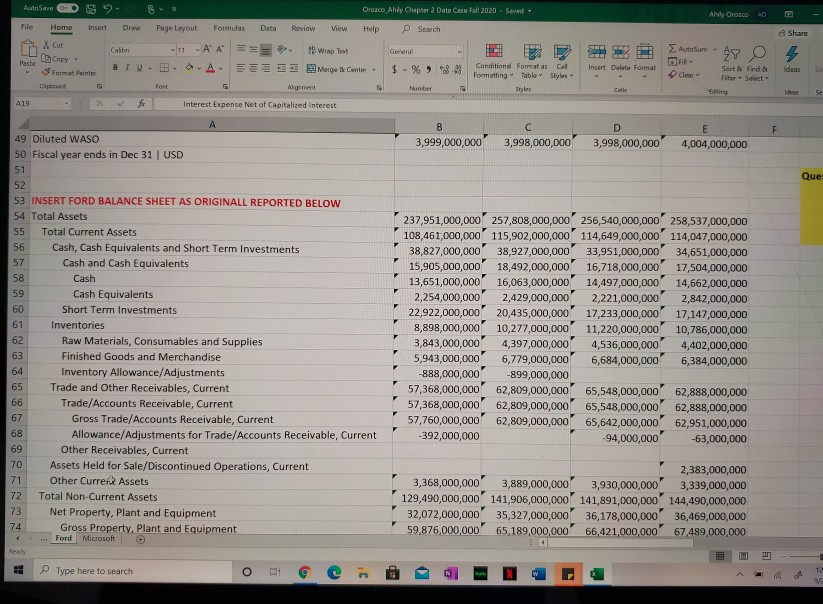
Caico the date of each financial statement. Use the closing stock prices (not the adjusted close). capitalization at each date, multiply the number of shares outstanding by the firm's historic stock price. You can find the number of shares by using "Basic" under "Weighted average shares outstanding" at the bottom of the Income Statement 3. For each of the four years of statements, compute the following ratios for each firm: Valuation Ratios Price-earnings ratio (for EPS use diluted EPS total) Market-to-book ratio Enterprise value-to-EBITDA (For debt, include long-term and short-term debt; for cash, include marketable securities.) Profitability Ratios Operating margin Net profit margin Return on equity Financial Strength Ratios Current ratio Book debt-equity ratio Market debt-equity ratio Interest coverage ratio (EBIT - interest expense) Clipboard Font Nigament Number Styles Cells 19 f Interest Expense Net of Capitalized Interest F A 1 INSERT FORD INCOME STATEMENT AS ORIGINALLY REPORTED BELOW 2 Gross Profit 3 Total Revenue 4 Business Revenue 5 Other Revenue 6 Cost of Revenue 7 Cost of Goods and Services 8 Operating Income/Expenses 9 Selling, General and Administrative Expenses 10 General and Administrative Expenses 11 Other Income/Expense, Operating 12 Other Expenses, Operating 13 Provision Expense/Write-Back 14 Other Provision Expense/Write-Back 15 Total Operating Profit/Loss 16 Non-Operating Income/Expenses, Total 17 Total Net Finance Income/Expense B C D E 2016 2017 2018 2019 25,216,000,000 25,444,000,000 24,069,000,000' 21,207,000,000 151,800,000,000 156,776,000,000 160,338,000,000 155,900,000,000 151,799,000,000 156,766,000,000 160,338,000,000 155,900,000,000 1,000,000 10,000,000 -126,584,000,000 -131,332,000,000 -136,269,000,000 -134,693,000,000 -126,584,000,000'-131,332,000,000 -136,269,000,000 -134,693,000,000 -21,100,000,000 -20,631,000,000 -20,866,000,000 -20,633,000,000 -12,196,000,000 -11,527,000,000 -11,403,000,000 -11,161,000,000 -11,527,000,000 -8,904,000,000 -9,104,000,000 -9,463,000,000 -9,472,000,000 -8,904,000,000 -9,104,000,000 -9,463,000,000 -9,472,000,000 4,116,000,000' 4,813,000,000 2,680,000,000 3,335,000,000 -600,000,000 -672,000,000 3,203,000,000 1,142,000,000 -528,000,000 574,000,000 -1,214,000,000 -240,000,000 18 Net Interest Income/Expense -600,000,000 -672,000,000 -528,000,000 -240,000,000 19 20 21 Interest Expense Net of Capitalized Interest Interest Income Net Investment Income Gain/Loss on Investments and Other Financial Instruments Income from Associates, Joint Ventures and Other Participating interest Ford Microsoft -894,000,000 294,000,000 1,910,000,000 -9,000,000 1,919,000,000 -1,133,000,000 461,000,000 1,186,000,000 -22,000,000 1,208,000,000 -1,228,000,000 700,000,000 280,000,000 115,000,000 165,000,000 -1,049,000,000 809,000,000 196,000,000 144,000,000 52,000,000 22 23 Type here to search O Clipboard Fant Alignment Number Styles Cells diting A19 Interest Expense Net of Capitalized interest B 1,919,000,000 C 1,208,000,000 D 165,000,000 E 52,000,000 0 0 -55,000,000 -55,000,000 A 24 Share of Profit and Interest from Associates 25 Other Investment Income 26 Irregular Income/Expenses 27 Gain/Loss on Extinguishment of Debt 28 Other Irregular Income/Expenses 29 Other Income/Expense, Non-Operating 30 Pretax Income 31 Provision for Income Tax 32 Net Income from Continuing Operations 33 Net Income after Extraordinary Items and Discontinued Operations 34 Non-Controlling/Minority Interests 35 Net Income after Non-Controlling/Minority Interests 36 Net Income Available to Common Stockholders 37 Diluted Net Income Available to Common Stockholders 38 Discontinued Operations 39 Dilution to Earnings 40 Reported Total Revenue 41 Reported Total Operating Profit/Loss 42 Reported Normalized Income 43 Reported Effective Tax Rate 44 Reported Normalized EBIT 45 Reported Normalized EBITDA 46 Basic EPS 47 Diluted EPS 48 Basic WASO 49 Diluted WASO Microsoft 156,000,000 0 156,000,000 1,214,000,000 6,796,000,000 -2,189,000,000 4,607,000,000 4,607,000,000 -11,000,000 4,596,000,000 4,596,000,000 4,596,000,000 0 0 2,821,000,000 8,148,000,000 -520,000,000 7,628,000,000 7,628,000,000 -26,000,000 7,602,000,000 7,602,000,000 7,602,000,000 0 1,390,000,000 4,345,000,000 -650,000,000 3,695,000,000 3,695,000,000 -18,000,000 3,677,000,000 3,677,000,000 3,677,000,000 -1,115,000,000 -640,000,000 724,000,000 84,000,000 84,000,000 37,000,000 47,000,000 47,000,000 47,000,000 0 0 151,800,000,000' 156,776,000,000 160,338,000,000 155,900,000,000 574,000,000 7,054,000,000 7,116,000,000 5,194,000,000 4,758,000,000 1 9,626,000,000 7,002,000,000 6,379,000,000 7,913,000,000 1.16 1.91 0.93 0.01 1.15 1.90 0.92 0.01 3,973,000,000 3,975,000,000 3,974,000,000 3,972,000,000 3,999,000,000 3,998,000,000 3,998,000,000 4,004,000,000 Ford Ready Type here to search o H N AutoSave $ Orozco Ahiy Chapter 2 Data Case Fall 2020 - Saved - Ahily Orozco AO File Home Insert Draw Page Layout Formulas Data Review View Help Search Share Calon & Cut Lh Copy Paste A == Wrap Test Autosum - - AY BTV - B - Morge & Conte $ % 98% Insert Delate Format Ideas 5 Conditional Format as cal Formatting Table Styles Styles Sort & Find & Fiber Select Cler Font Algiment Number Calls Se A19 Interest Expense Net of Capitalized interest F B 3,999,000,000 C 3,998,000,000 D 3,998,000,000 E 4,004,000,000 Que A 49 Diluted WASO 50 Fiscal year ends in Dec 31 USD 51 52 53 INSERT FORD BALANCE SHEET AS ORIGINALL REPORTED BELOW 54 Total Assets 55 Total Current Assets 56 Cash, Cash Equivalents and Short Term Investments 57 Cash and Cash Equivalents 58 Cash 59 Cash Equivalents 60 Short Term Investments 61 Inventories 62 Raw Materials, Consumables and Supplies 63 Finished Goods and Merchandise 64 Inventory Allowance/Adjustments 65 Trade and Other Receivables, Current 66 Trade/Accounts Receivable, Current 67 Gross Trade/Accounts Receivable, Current 68 Allowance/Adjustments for Trade/Accounts Receivable, Current 69 Other Receivables, Current 70 Assets Held for Sale/Discontinued Operations, Current 71 Other Current Assets 72 Total Non-Current Assets 73 Net Property, Plant and Equipment 74 Gross Property, plant and Equipment 237,951,000,000 257,808,000,000 256,540,000,000 258,537,000,000 108,461,000,000 115,902,000,000' 114,649,000,000' 114,047,000,000 38,827,000,000 38,927,000,000 33,951,000,000 34,651,000,000 15,905,000,000 18,492,000,000 16,718,000,000 17,504,000,000 13,651,000,000 16,063,000,000 14,497,000,000 14,662,000,000 2,254,000,000 2,429,000,000 2,221,000,000 2,842,000,000 22,922,000,000 20,435,000,000 17,233,000,000 17,147,000,000 8,898,000,000 10,277,000,000 11,220,000,000 10,786,000,000 3,843,000,000 4,397,000,000 4,536,000,000 4,402,000,000 5,943,000,000 6,779,000,000 6,684,000,000 6,384,000,000 -888,000,000 -899,000,000 57,368,000,000 62,809,000,000 65,548,000,000 62,888,000,000 57,368,000,000 62,809,000,000 65,548,000,000 62,888,000,000 57,760,000,000' 62,809,000,000' 65,642,000,000 62,951,000,000 -392,000,000 -94,000,000 -63,000,000 2,383,000,000 3,368,000,000 3,889,000,000 3,930,000,000 3,339,000,000 129,490,000,000 141,906,000,000 141,891,000,000 144,490,000,000 32,072,000,000 35,327,000,000 36,178,000,000 36,469,000,000 59,876,000,000 65,189,000,000 66,421,000,000 67,489,000,000 Ford Microsoft Ready H Type here to search lo 13 2 Clipboard Font Number Styles Id Alignment Interest Expense Net of Capitalized interest A19 X A D 74 75 76 77 B E 59,876,000,000 65,189,000,000 66,421,000,000 67,489,000,000 10,699,000,000 11,507,000,000' 11,922,000,000 12,321,000,000 391,000,000 411,000,000 445,000,000 421,000,000 10,308,000,000 11,096,000,000 11,477,000,000 11,900,000,000 47,007,000,000 51,074,000,000 52,433,000,000 53,458,000,000 34,149,000,000 37,533,000,000 38,720,000,000 38,939,000,000 2,803,000,000 3,118,000,000 3,349,000,000 3,691,000,000 10,055,000,000 10,423,000,000 10,364,000,000' 10,828,000,000 2,170,000,000 2,608,000,000 2,066,000,000 1,710,000,000 78 79 80 81 82 83 84 85 86 87 88 A Gross Property, Plant and Equipment Properties Land and Improvements Buildings and improvements Machinery, Furniture and Equipment Plant and Machinery Furniture, Fixtures and Office Equipment Other Equipment Construction in Progress and Advance Payments Other Property, Plant and Equipment Accumulated Depreciation and Impairment Accumulated Depreciation Net Intangible Assets Gross Goodwill and Other Intangible Assets Goodwill Intangibles other than Goodwill Other Intangible Assets Trademarks and Patents Licenses and Rights Accumulated Amortization and Impairment Accumulated Amortization of Intangible Assets Accumulated Amortization of Intangibles other than Goodwill Accumulated Amortization of Trademarks and Patents Accumulated Amortization of Licences and Rights Accumulated Amortization of Other Intangible Assets Total Long Term Investments -27,804,000,000 -29,862,000,000' -30,243,000,000' 31,020,000,000 -27,804,000,000 -29,862,000,000' 30,243,000,000 31,020,000,000 442,000,000 466,000,000 442,000,000 466,000,000 264,000,000 278,000,000 178,000,000 188,000,000 178,000,000 89 90 91 92 93 94 95 96 97 98 99 32, 133,000,000 31,320,000,000 31,828,000,000 31,749,000,000 Ford Microsoft Ready Type here to search Format Painter Mage Center Clear Filter Select Formatting Table Styles Styles Clipboard 19 Font Nigamem Number 19 dem A19 Interest Expense Net of Capitalized Interest A D F B C E 32,133,000,000 31,320,000,000 31,828,000,000 31,749,000,000 3,304,000,000 3,085,000,000 2,709,000,000 2,519,000,000 3,304,000,000 3,085,000,000 2,709,000,000 2,519,000,000 28,829,000,000 28,235,000,000 29,119,000,000 29,230,000,000 49,924,000,000 56,182,000,000 55,544,000,000' 53,703,000,000 49,924,000,000 56,182,000,000 55,544,000,000 53,703,000,000 9,705,000,000 10,973,000,000 10,412,000,000 11,863,000,000 5,656,000,000 8,104,000,000 7,487,000,000 10,240,000,000 99 Total Long Term Investments 100 Long Term Equity Investments 101 Investments in Associates 102 Other Investments, Non-Current 103 Trade and Other Receivables, Non-Current 104 Trade/Accounts Receivable, Non-Current 105 Deferred Tax Assets, Non-Current 106 Other Non-Current Assets 107 Deferred Costs/Assets, Non-Current 108 Assets Held for Sale/Discontinued Operations, Non-Current 109 Total Liabilities 110 Total Current Liabilities 111 Payables and Accrued Expenses, Current Trade and Other Payables, Current 113 Trade/Accounts Payable, Current 114 Interest Payable, Current 115 Accrued Expenses, Current 116 Financial Liabilities, Current 117 Current Debt and Capital Lease Obligation Current Debt 19 Other Loans, Current Debt 20 Commercial Paper 21 Notes Payable, Current Debt Current Portion of Long Term Debt and Capital Lease 23 Current Portion of Long Term Debt 24 Other Current Portion of LT Debt Microsoft 712 208,764,000,000 222,890,000,000 220,574,000,000 225,307,000,000 90,281,000,000 94,600,000,000 95,569,000,000 98,132,000,000 22,270,000,000 24,339,000,000 22,508,000,000 21,801,000,000 22,270,000,000 24,339,000,000 22,508,000,000 21,801,000,000 21,296,000,000 23,282,000,000 21,520,000,000 20,673,000,000 974,000,000 1,057,000,000 988,000,000 1,128,000,000 49,669,000,000 49,669,000,000 16,654,000,000 16,654,000,000 18 51,621,000,000 53,493,000,000 54,313,000,000 51,621,000,000 53,493,000,000 54,313,000,000 18,549,000,000 15,319,000,000 14,032,000,000 18,549,000,000 15,319,000,000 14,032,000,000 22 33,015,000,000 33,072,000,000 38,174,000,000 40,281,000,000 33,015,000,000 33,072,000,000 38,174,000,000 39,914,000,000 33,015,000,000 33,072,000,000 38,174,000,000 39,914,000,000 Ford 51 Type here to search C Paste BIU SEE Merge Center $ % 948-23 Clen Copy Format Painter clipboard Formatting Table Styles Styles Tilter Select diting Sent Font Alignment Number A19 f Interest Expense Net of Capitalized Interest B C D E F 125 126 127 128 129 130 131 132 133 134 135 136 137 138 139 140 141 142 143 1144 145 146 147 148 149 150 Bank/Institutional Loans, Current Portion of LT Debt Capital Lease Obligations, Current Provisions, Current Provision for Employee Entitlements, Current Pension and Other Post-Retirement Benefit Plans, Current Other Employee Related Liabilities, Current Deferred Liabilities, Current Deferred Income/Customer Advances/Billings in Excess of Cost, Curre Liabilities Held for Sale/Discontinued Operations, Current Other Current Liabilities Total Non-Current Liabilities Financial Liabilities, Non-Current Long Term Debt and Capital Lease Obligation Long Term Debt Bank/Institutional Loans, Non-Current Other Loans, Non-Current Notes Payables, Non-Current Convertible Debentures/Loans, Non-Current Bank/Credit Facilities, Non-Current Capital Lease Obligations, Non-Current Provisions, Non-Current Provision for Employee Entitlements, Non-Current Pension and Other Post-Retirement Benefit Plans, Non-Current Other Employee Related Liabilities, Non-Current Tax Liabilities, Non-Current Deferred Tax Liabilities, Non-Current Ford Microsoft 367,000,000 2,065,000,000 2,238,000,000 2,298,000,000 2,374,000,000 2,065,000,000 2,238,000,000 2,298,000,000 2,374,000,000 596,000,000 577,000,000 543,000,000 517,000,000 1,469,000,000 1,661,000,000 1,755,000,000 1,857,000,000 3,866,000,000 2,107,000,000 2,095,000,000 2,091,000,000 3,866,000,000 2,107,000,000 2,095,000,000 2,091,000,000 526,000,000 12,411,000,000 14,295,000,000 15,175,000,000' 17,027,000,000 118,483,000,000 128,290,000,000 125,005,000,000 127,175,000,000 93,301,000,000 102,666,000,000 100,720,000,000 102,408,000,000 93,301,000,000 102,666,000,000 100,720,000,000 102,408,000,000 93,301,000,000' 102,666,000,000' 100,720,000,000' 101,361,000,000 1,500,000,000 93,301,000,000' 102,666,000,000 100,720,000,000 99,861,000,000 1,047,000,000 16,729,000,000' 16,892,000,000 15,723,000,000' 16,722,000,000 16,729,000,000 16,892,000,000 15,723,000,000 16,722,000,000 15,666,000,000 15,753,000,000 14,643,000,000 15,618,000,000 1,063,000,000 1,139,000,000 1,080,000,000 1,104,000,000 691,000,000 815,000,000 597,000,000 490,000,000 691,000,000 815,000,000 597,000,000 490,000,000 1 124 9/21 hade O C H Type here to search Cut Calibri Generd Fil Copy 11 AA 29 Wrap Text A. SEE Merge & Center Insert Delete Format ZY Sort & Find & Filter Select Paste $ -% $8. Clear Conditional Format as Cell Formatting Table Styles Styles Format Painter Clipboard F Font Number Alignment Cells A19 fy Interest Expense Net of Capitalized interest F B 3,687,000,000 3,687,000,000 3,979,000,000 96,000,000 3,829,000,000 3,829,000,000 3,990,000,000 98,000,000 D 3,985,000,000 3,985,000,000 3,880,000,000 100,000,000 E 4,191,000,000 4,191,000,000 3,364,000,000 0 29,187,000,000 34,918,000,000 35,966,000,000 33,230,000,000 29,170,000,000 34,890,000,000 35,932,000,000 33,185,000,000 20,549,000,000 20,631,000,000 20,630,000,000 20,593,000,000 21,671,000,000 21,884,000,000 22,047,000,000 22,206,000,000 41,000,000 41,000,000 41,000,000 41,000,000 A 151 Deferred Liabilities, Non-Current 152 Deferred Income/Customer Advances/Billings in Excess of Cost, Non- 153 Other Non-Current Liabilities 154 Preferred Securities Outside Stock Equity 155 Payables and Accrued Expenses, Non Current 156 Accrued Expenses, Non-Current 157 Liabilities Held for Sale/Discontinued Operations, Non-Current 158 Total Equity 159 Equity Attributable to Parent Stockholders 160 Paid in Capital 161 Capital Stock 162 Common Stock 163 Common Stock, with Par Value 164 Additional Paid in Capital/Share Premium 165 Treasury Stock 166 Retained Earnings/Accumulated Deficit 167 Reserves/Accumulated Comprehensive Income/Losses 168 Non-Controlling/Minority Interests 169 Common Shares Issued 170 Common Shares Outstanding 171 Common Shares Treasury 172 Fiscal year ends in Dec 31 USD 173 174 175 INSERT FORD CASH FLOW AS ORIGINALLY REPORTED BELOW 176 Cash Flow from Operating Activities, Indirect Ford Microsoft Ready Type here to search 21,630,000,000' 21,843,000,000' 22,006,000,000 22,165,000,000 -1,122,000,000 -1,253,000,000 -1,417,000,000 -1,613,000,000 15,634,000,000 21,218,000,000 22,668,000,000 20,320,000,000 -7,013,000,000 -6,959,000,000 -7,366,000,000 -7,728,000,000 17,000,000 28,000,000 34,000,000 45,000,000 4,163,000,000 4,174,000,000 4,071,000,000 3,964,929,075 4,047,000,000 4,058,000,000 4,071,000,000 3,964,929,075 116,000,000 116,000,000 19,792,000,000 18,096,000,000 15,022,000,000 17,639,000,000 + hu Merge Center 01-18 Insert Delete Format Format Painter Clipboard & Clear Ideas Sort & Find & Fiter Select Formatting Table Styles Styles Fom Number Cells Editing des .19 X fi Alignment Interest Expense Net of Capitalized Interest B D E F 75 INSERT FORD CASH FLOW AS ORIGINALLY REPORTED BELOW 76 Cash Flow from Operating Activities, Indirect 77 Net Cash Flow from Continuing Operating Activities, Indirect 78 Cash Generated from Operating Activities 79 Income/Loss before Non-Cash Adjustment 180 Total Adjustments for Non-Cash Items 181 Depreciation, Amortization and Depletion, Non-Cash Adjustment 182 Depreciation and Amortization, Non-Cash Adjustment 183 Depreciation, Non-Cash Adjustment 184 Amortization, Non-Cash Adjustment 185 Pension and Employee Benefit Expense, Non-Cash Adjustment 186 Stock-Based Compensation, Non-Cash Adjustment 187 Taxes, Non-Cash Adjustment 188 Other Provisions, Non-Cash Adjustment 189 Net Investment Income/Loss, Non-Cash Adjustment 190 Share of Profit/Loss from Associates, Joint Ventures and other Ed 191 Net Foreign Exchange Gain/Loss, Non-Cash Adjustment 192 Gain/Loss on Financial Instruments, Non-Cash Adjustment 193 Irregular Income/Loss, Non-Cash Adjustment 194 Impairment/Write Off/Write Down of Other Assets, Non-Cash Ad 195 Gain/Loss on Disposals, Non-Cash Adjustment 196 Gain/Loss on Disposal/Sale of Business, Non-Cash Adjustment 197 Gain/Loss on Extinguishment of Debt, Non-Cash Adjustment 198 Other Irregular Income/Loss, Non-Cash Adjustment 199 Impairment/Write Off/Write Down of Capital Assets Loss/Reversi Other Non-Cash Items 19,792,000,000 18,096,000,000 15,022,000,000' 17,639,000,000 19,792,000,000 18,096,000,000 15,022,000,000 17,639,000,000 19,792,000,000 18,096,000,000 15,022,000,000 17,639,000,000 4,607,000,000 7,628,000,000 3,695,000,000 84,000,000 13,709,000,000 8,471,000,000' 10,021,000,000' 11,351,000,000 8,717,000,000 8,453,000,000 8,308,000,000 8,490,000,000 8,717,000,000 8,453,000,000 8,308,000,000 8,490,000,000 9,023,000,000 9,122,000,000 9,280,000,000 9,689,000,000 -306,000,000 -669,000,000 -972,000,000 -1,199,000,000 2,667,000,000 -608,000,000 400,000,000 2,625,000,000 210,000,000 246,000,000 191,000,000 228,000,000 1,478,000,000 -232,000,000 -197,000,000 -1,370,000,000 672,000,000 717,000,000 609,000,000 413,000,000 -34,000,000 -170,000,000 693,000,000 120,000,000 -317,000,000 233,000,000 164,000,000 174,000,000 283,000,000 -403,000,000 529,000,000 -54,000,000 804,000,000 804,000,000 -1,000,000 65,000,000 17,000,000 41,000,000 200 Ford Microsoft 124411 Type here to search Font Wigent Nu Cells A19 Interest Expense Net of Capitalized Interest B 1,476,000,000 -815,000,000 -4,304,000,000 -2,855,000,000 -1,449,000,000 6,595,000,000 C 1,997,000,000 1,306,000,000 -959,000,000 -828,000,000 -3,133,000,000 -4,647,000,000 -2,297,000,000 -2,239,000,000 -836,000,000 -2,408,000,000 6,089,000,000 6,781,000,000 E 6,204,000,000 206,000,000 738,000,000 -816,000,000 1,554,000,000 5,260,000,000 201 Changes in Operating Capital 202 Change in Inventories 203 Change in Trade and Other Receivables 204 Change in Trade/Accounts Receivable 205 Change in Other Receivables 206 Change in Payables and Accrued Expenses 207 Change in Other Operating Capital 208 Change in Other Current Liabilities 209 Other Operating Cash Flow 210 Cash Flow from Investing Activities 211 Cash Flow from Continuing Investing Activities 212 Capital Expenditure, Reported 13 Purchase/Sale of Investments, Net 214 Purchase of Investments 15 Sale of Investments -16 Purchase/Sale of Other Non-Current Assets, Net 17 Purchase of Other Non-Current Assets -18 Sales of Other Non-Current Assets 19 Other Investing Cash Flow 20 Purchase/Sale of Business, Ne 21 Sale of Business 22 Purchase/Acquisition of Business 23 Cash Flow from Financing Activities 24 Cash Flow from Continuing Financing Activities 25 Issuance of/Payments for Common Stock, Net 26 Payments for Common Stock Microsoft -25,352,000,000 -19,392,000,000 -16,261,000,000 -13,721,000,000 -25,352,000,000 -19,392,000,000 -16,261,000,000 -13,721,000,000 -6,992,000,000 -7,049,000,000 -7,785,000,000 -7,632,000,000 -1,249,000,000 2,431,000,000 3,745,000,000 -657,000,000 -31,428,000,000 -27,567,000,000 -17,140,000,000 -17,586,000,000 30,179,000,000 29,998,000,000 20,885,000,000 16,929,000,000 -17,173,000,000 -14,713,000,000 -12,044,000,000 5,394,000,000 -56,007,000,000 -59,354,000,000 -62,924,000,000 -55,576,000,000 38,834,000,000 44,641,000,000 50,880,000,000 50,182,000,000 62,000,000 -61,000,000 -177,000,000 -38,000,000 7,458,000,000 7,458,000,000 -145,000,000 -145,000,000 3,394,000,000 3,394,000,000 - 131,000,000 - 131,000,000 -122,000,000 -122,000,000 -164,000,000 -164,000,000 -3,129,000,000 -3,129,000,000 -237,000,000 -237,000,000 Ford El eady W o hu O Type here to search Paste BIU Merge & Center $ % 48-68 Insert Delete Format Format Painter Conditional Format as Co Formatting Table Styles Styles Sort & Find & Filter Select Clipboard Font Alignment Number Cels Editing A19 Interest Expense Net of Capitalized Interest A 28 Issuance of/Repayments for Debt, Net 229 Issuance of/Repayments for Short Term Debt, Net 30 Proceeds from Issuance of Short Term Debt 31 Repayments for Short Term Debt 232 Issuance of/Repayments for Long Term Debt, Net 233 Proceeds from Issuance of Long Term Debt 234 Repayments for Long Term Debt 235 Cash Dividends and Interest Paid 236 Cash Dividends Paid 237 Common Stock Dividends Paid 238 Other Financing Cash Flow 239 Cash and Cash Equivalents, End of Period 240 Change in Cash 241 Effect of Exchange Rate Changes 242 Cash and Cash Equivalents, Beginning of Period 243 Other Cash Adjustments included in Change in Cash 244 Change in Cash As Reported, Supplemental 245 Total Net Change in Cash 246 Fiscal year ends in Dec 31 USD 247 248 249 250 251 B D E 11,028,000,000 6,260,000,000 3,139,000,000 -277,000,000 3,864,000,000 1,229,000,000 -2,819,000,000 -1,384,000,000 3,864,000,000 1,229,000,000 0 7,164,000,000 5,031,000,000 5,958,000,000 1,107,000,000 45,961,000,000 45,801,000,000 50,130,000,000 47,604,000,000 -38,797,000,000 -40,770,000,000 -44,172,000,000 -46,497,000,000 -3,376,000,000 -2,584,000,000 -2,905,000,000 -2,389,000,000 -3,376,000,000 -2,584,000,000 -2,905,000,000 -2,389,000,000 -3,376,000,000 -2,584,000,000 -2,905,000,000 -2,389,000,000 -49,000,000 -151,000,000 -192,000,000 -226,000,000 15,905,000,000 18,492,000,000 16,907,000,000 17,741,000,000 1,898,000,000 2,098,000,000 -1,361,000,000 789,000,000 -265,000,000 489,000,000 -370,000,000 45,000,000 14,272,000,000 15,905,000,000 18,638,000,000 16,907,000,000 1,633,000,000 2,587,000,000 -1,731,000,000 834,000,000 252 253 IN Ford Microsoft G H K M N 04 Dec-16 Dec-17 Dec-18 Dec-19 Industry 12.13 12.49 7.81 9.25 N/A Use diluted earnings 1 Ratios 2 3 4 Stock Price 5 EBITDA 6 Total Debt 7 Valuation 8 Price-Earnings 9 10 Market to Book 11 12 Enterprise / EBITDA 13 14 Profitability 15 Operating Margin 16 17 Net Profit Margin N/A Use Basic shares (WASO) N/A N/A 18 Basea-on Net Income from Continuing Operations N/A 19 Return on Equity 20 G H 1 U K M N -Net Profit Margin N/A 3 Return on Equity Based on Net Income from Continuing Operations N/A Financial Strength Current Ratio N/A 3 Book Debt-Equity N/A N/A Mkt Debt-Equity 7 B Interest Coverage 3 Enterprise Value 1 Question 4bStep by Step Solution
There are 3 Steps involved in it
Step: 1

Get Instant Access to Expert-Tailored Solutions
See step-by-step solutions with expert insights and AI powered tools for academic success
Step: 2

Step: 3
Ace Your Homework with AI
Get the answers you need in no time with our AI-driven, step-by-step assistance
Get Started
Managerial Accounting
Authors: Kurt Heisinger, Joe Ben Hoyle
1st Edition
1453345299, 9781453345290