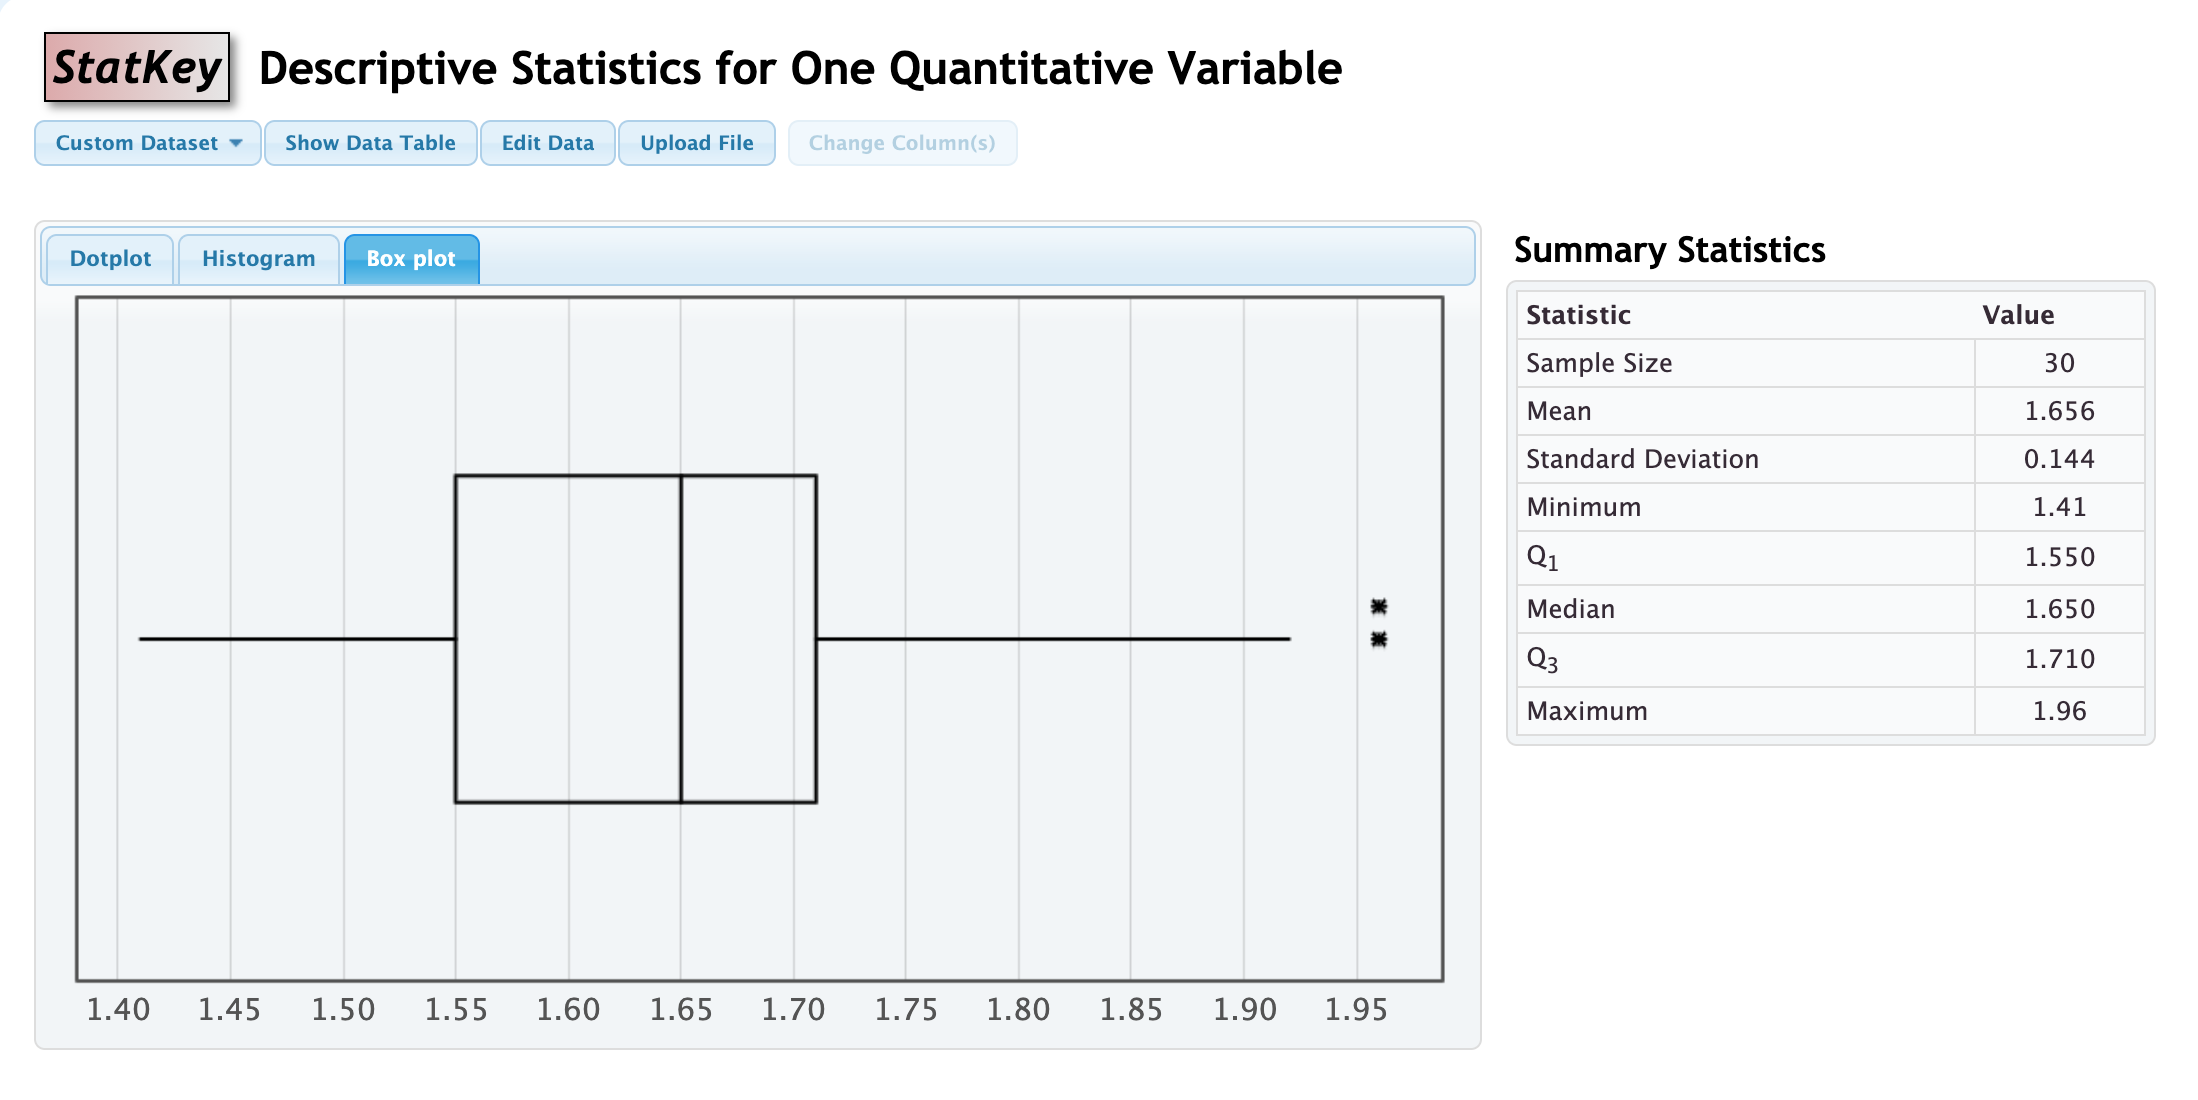
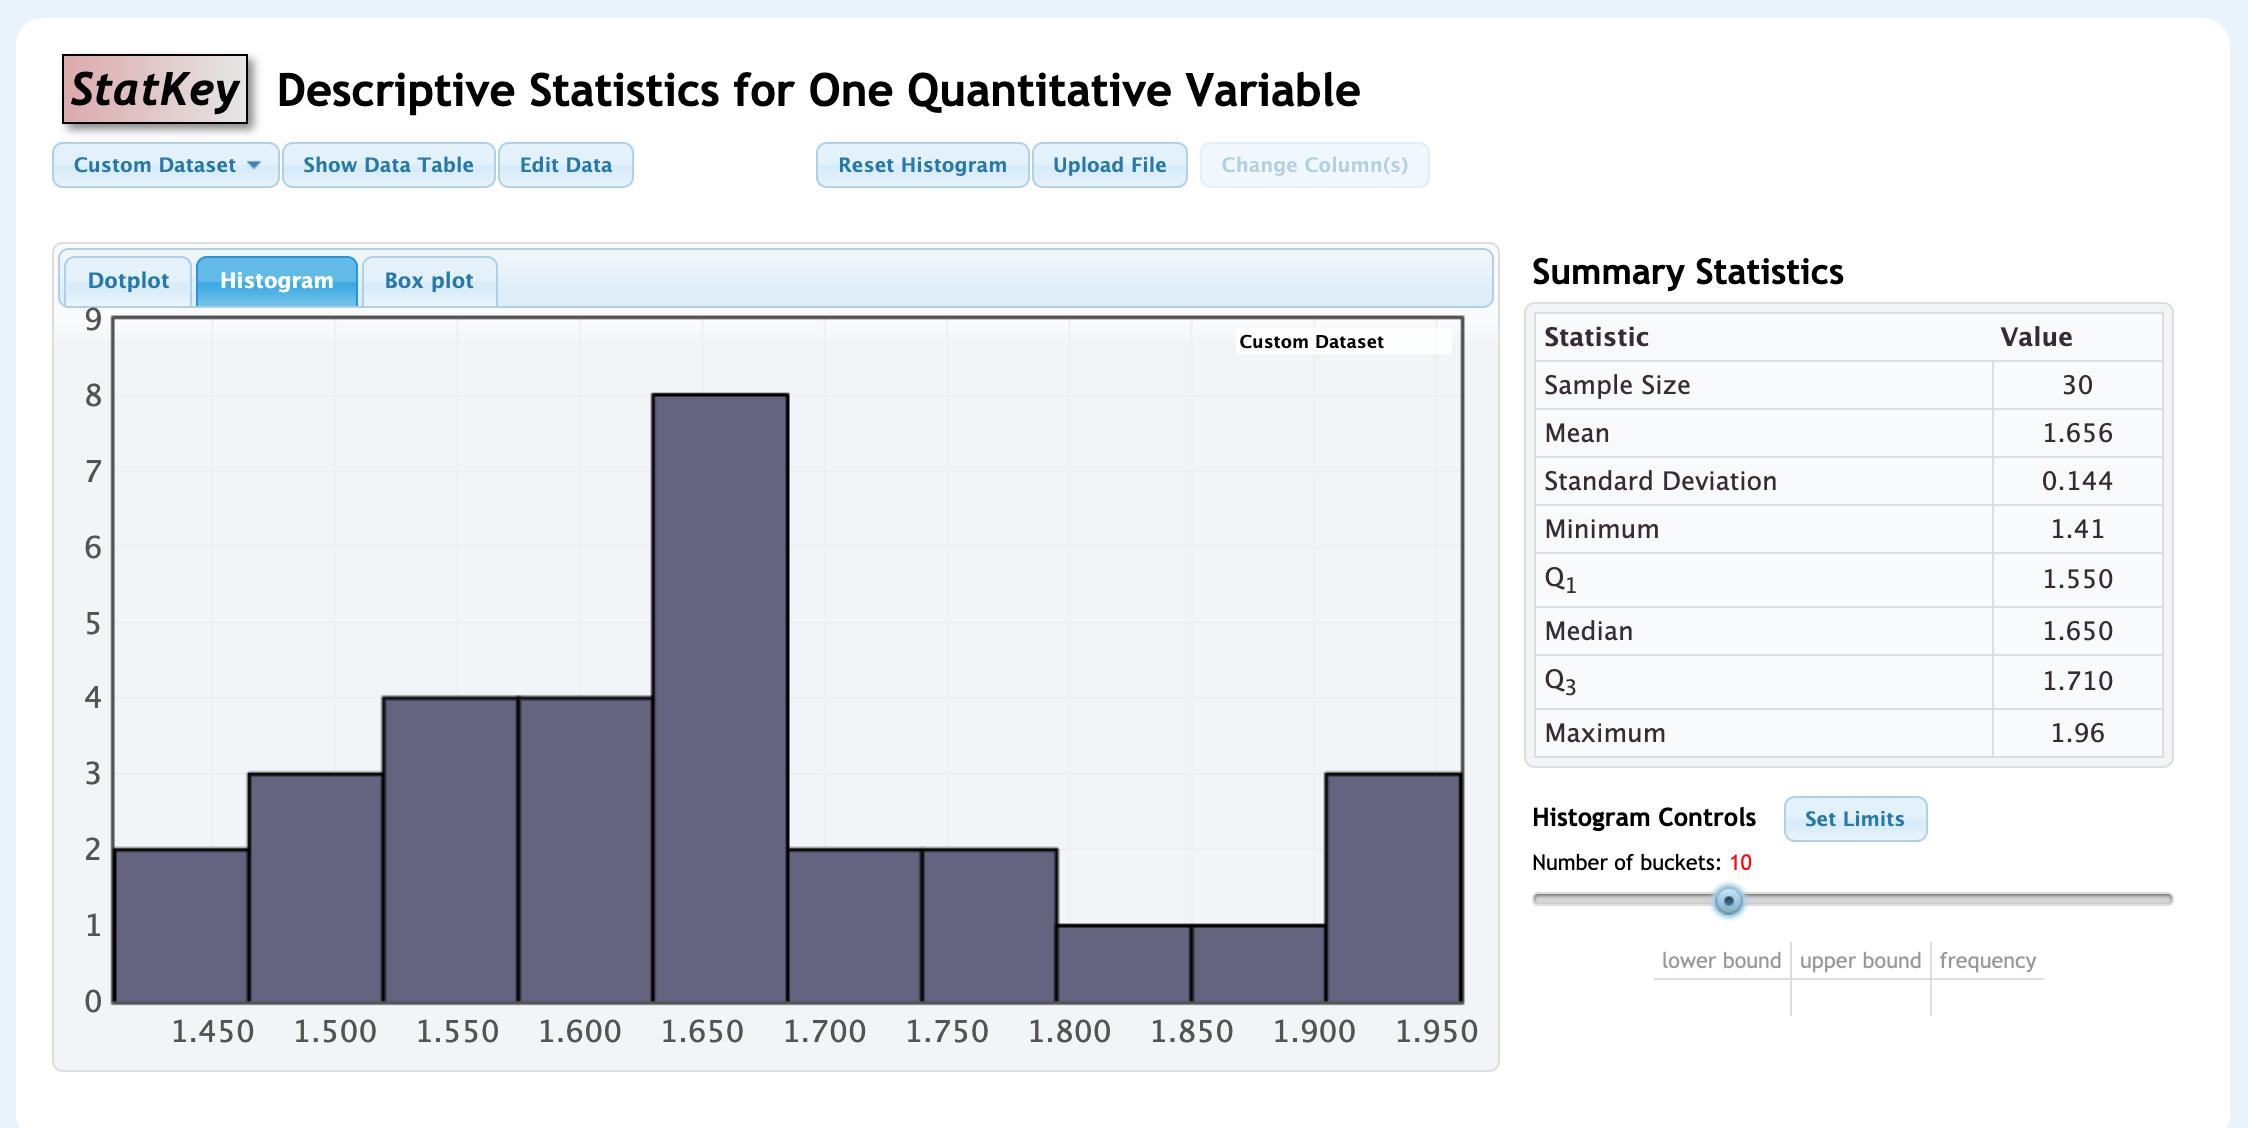
Answered step by step
Verified Expert Solution
Link Copied!

Question

1 Approved Answer

I need help describing these two graphs. (Briefly discuss shape and spread of the data. Use the mean and the median along with outliers to

I need help describing these two graphs. (Briefly discuss shape and spread of the data. Use the

mean and the median along with outliers to discuss skewness.) They are the same its just one is a histogram and the other one is a box plot.

image text in transcribedimage text in transcribed
Descriptive Statistics for One Quantitative Variable Custom Dataset v Show Data Table Edit Data Upload File Dotplot Histogram summary Statistics Statistic Value Sample Size 30 Mean 1.656 Standard Deviation 0,144 Minimum 1.41 Q1 1.550 . Median 1.550 . 03 1.710 Maximum 195 1.40 1.45 1.50 1.55 1.60 1.65 1.70 1.75 1.80 1.85 1.90 1.95 Descriptive Statistics for One Quantitative Variable H Custom Dataset v H Show Data Table H Edit Data 1 1 Reset Histogram H Upload File H . Tim: 4.}. mum H Dotplot Hm Box plot H summary Statistics '97 . Custom Dataset Statistic Value 8 Sample Size 30 Mean 1.656 7 Standard Deviation 0.144 6 Minimum 1.41 Q1 1.550 5 Median 1.650 4 Q3 1.710 Maximum 1.96 Histogram Controls 1 Set Limits 1 Number of buckets: 10 0 lower bound upper bound frequency 1.450 1.500 1.550 1.600 1.650 1.700 1.750 1.800 1.850 1.900 1.950

Step by Step Solution

There are 3 Steps involved in it

Step: 1

blur-text-image

Get Instant Access to Expert-Tailored Solutions

See step-by-step solutions with expert insights and AI powered tools for academic success

Step: 2

blur-text-image

Step: 3

blur-text-image

Ace Your Homework with AI

Get the answers you need in no time with our AI-driven, step-by-step assistance

Get Started

Recommended Textbook for

Linear Algebra A Modern Introduction

Authors: David Poole

3rd edition

9781133169574 , 978-0538735452

More Books

Students also viewed these Mathematics questions

Question

Why is information sharing important in achieving SCI?

Answered: 1 week ago