

Answered step by step
Verified Expert Solution
Question
1 Approved Answer
I need help! Each run 1-4 needs to be graph separately like the sample above Showing Final temp and Initial temp. I had a hard
I need help! Each run 1-4 needs to be graph separately like the sample above Showing Final temp and Initial temp. I had a hard time trying to graph it on execl. Please help with steps!
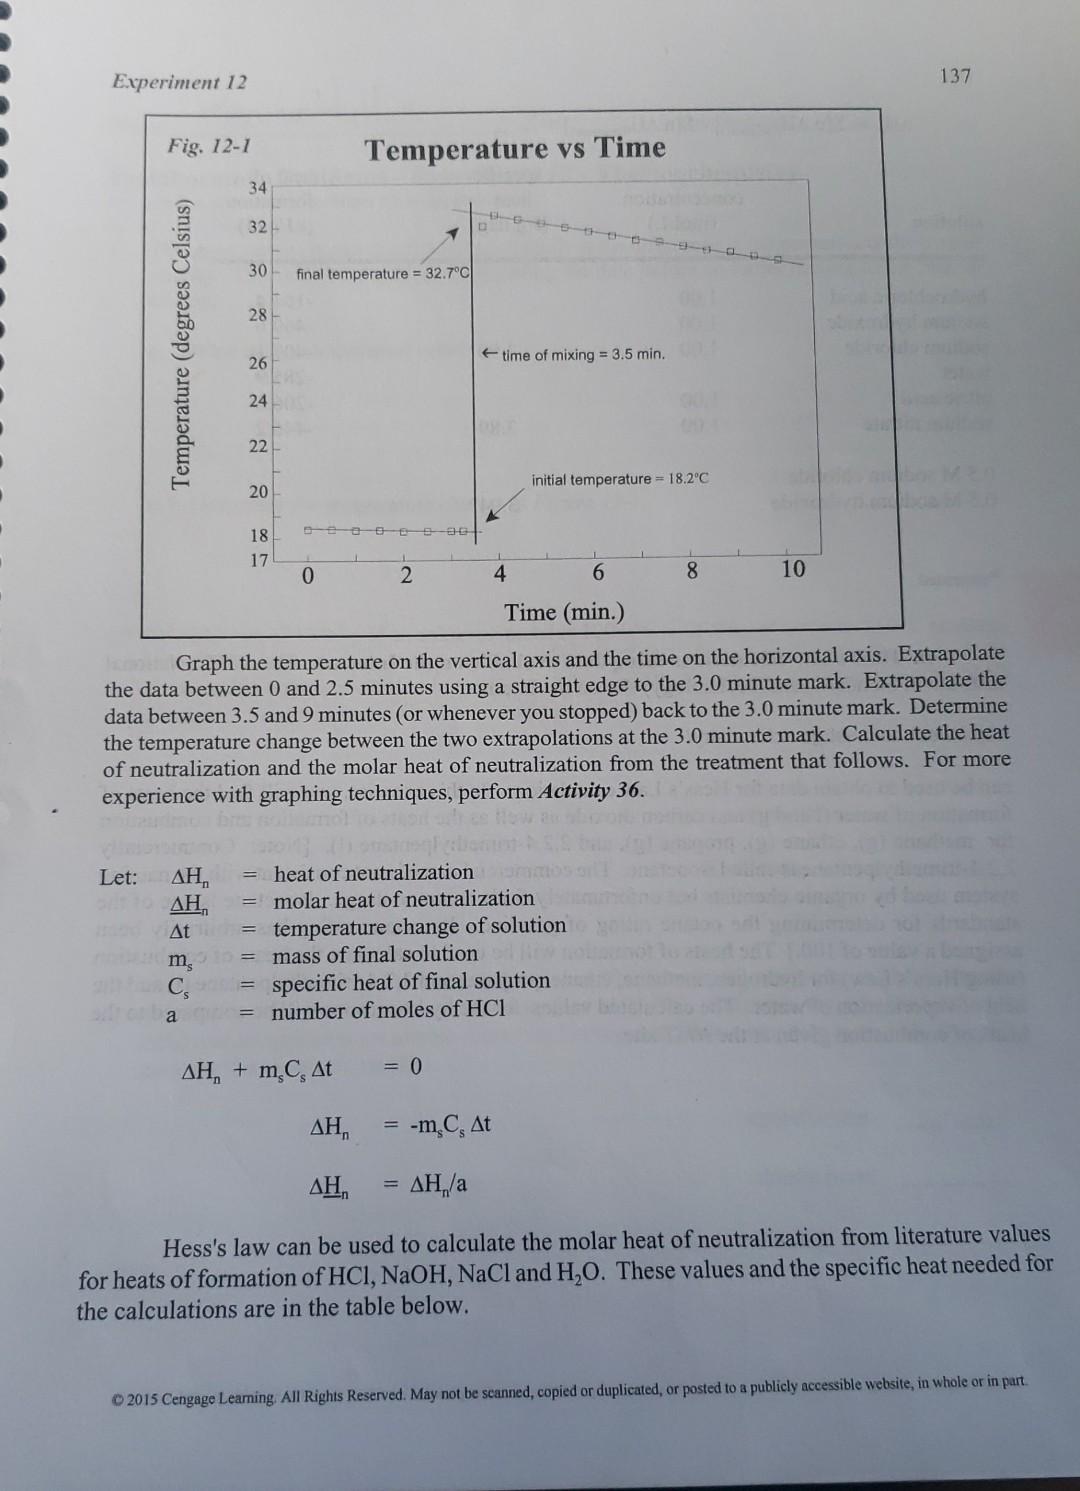
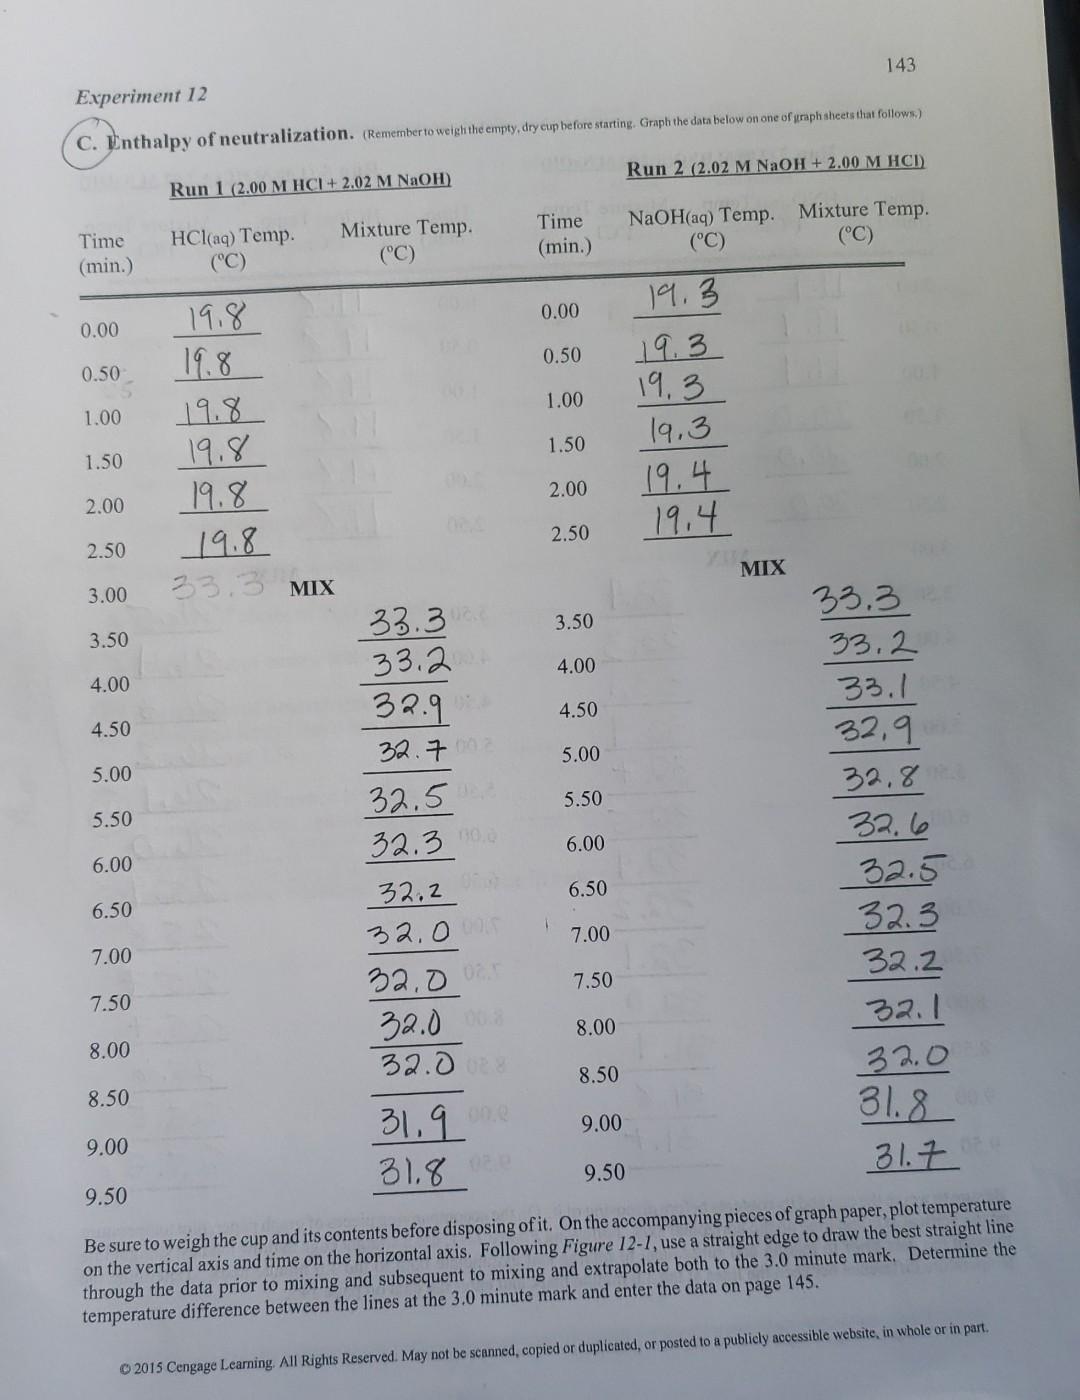
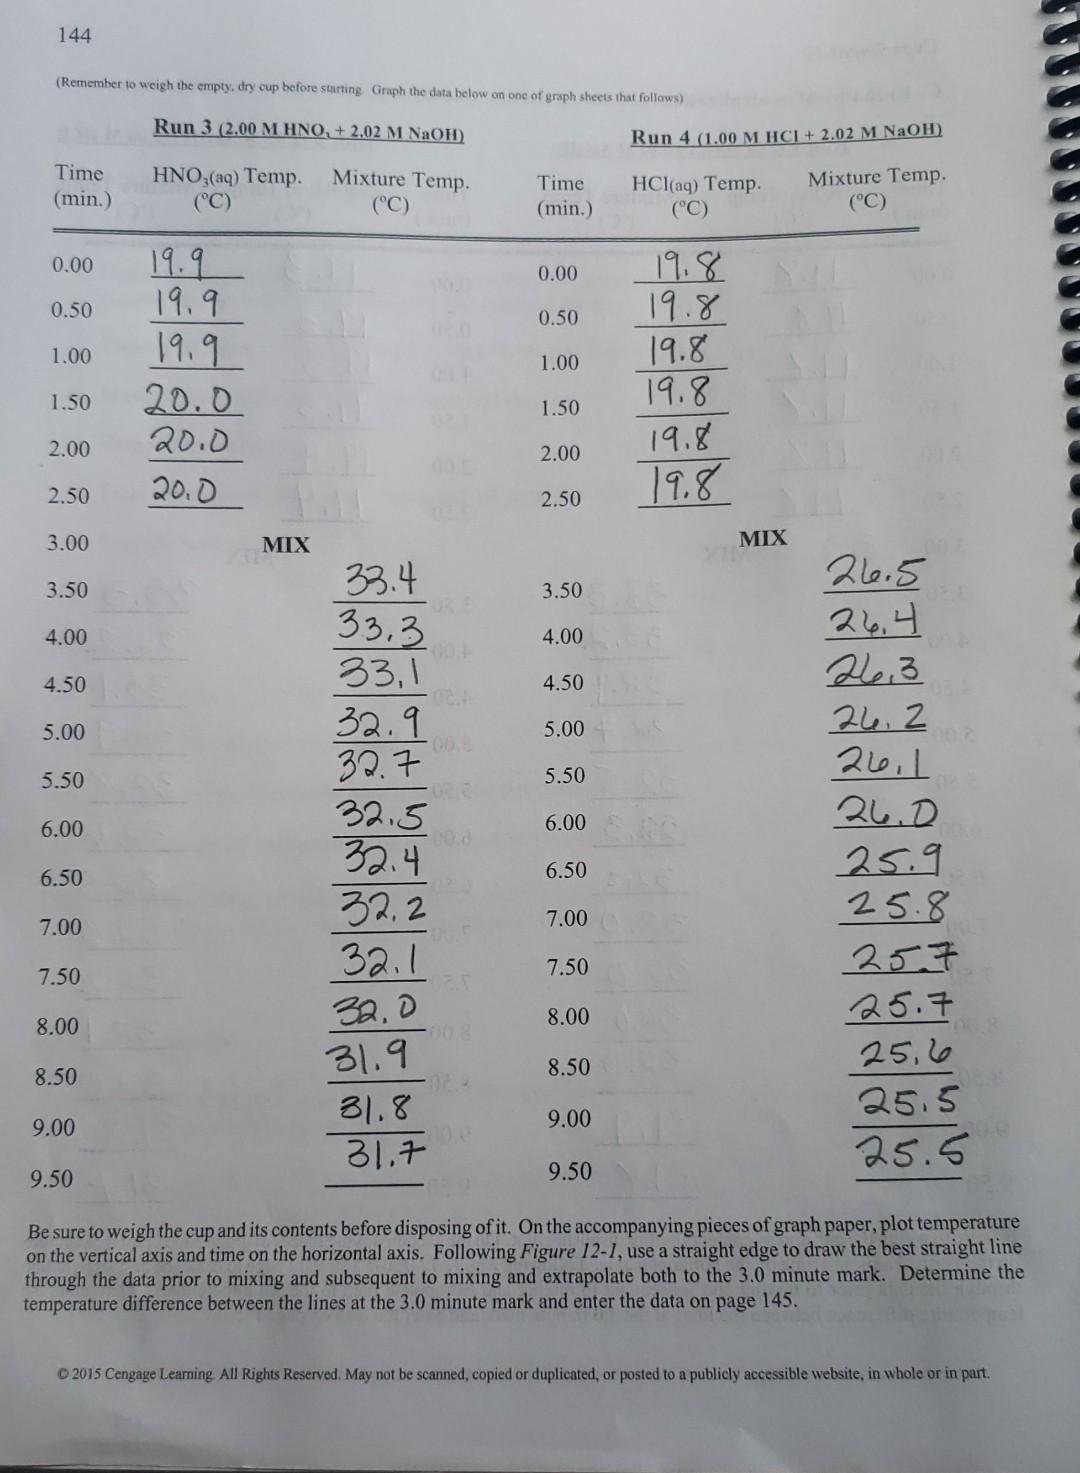
Experiment 12 137 Fig. 12-1 Temperature vs Time 34 32 30 final temperature = 32.7C 28 Temperature (degrees Celsius) 26 time of mixing = 3.5 min. 24 22 initial temperature = 18.2C 20 18 17 0 2 4 6 8 10 Time (min.) Graph the temperature on the vertical axis and the time on the horizontal axis. Extrapolate the data between 0 and 2.5 minutes using a straight edge to the 3.0 minute mark. Extrapolate the data between 3.5 and 9 minutes (or whenever you stopped) back to the 3.0 minute mark. Determine the temperature change between the two extrapolations at the 3.0 minute mark. Calculate the heat of neutralization and the molar heat of neutralization from the treatment that follows. For more experience with graphing techniques, perform Activity 36. Let: , heat of neutralization , = molar heat of neutralization At = temperature change of solution m, = mass of final solution C = specific heat of final solution a = number of moles of HCI , + m, C, ft = 0 , -m C, At , ,/a Hess's law can be used to calculate the molar heat of neutralization from literature values for heats of formation of HCl, NaOH, NaCl and H,O. These values and the specific heat needed for the calculations are in the table below. 2015 Cengage Leaming. All Rights Reserved. May not be scanned, copied or duplicated, or posted to a publicly accessible website, in whole or in part 143 Experiment 12 C. Enthalpy of neutralization. Remember to weigh the empty, dry cup before starting Graph the data below on one of yraph sheets that follows) Run 2 (2.02 M NaOH + 2.00 M HCI) Run 1 (2.00 M HCI+ 2.02 M NaOH) Time (min.) HCl(aq) Temp. (C) Mixture Temp. (C) Time (min.) NaOH(aq) Temp. Mixture Temp. (C) (C) 0.00 0.00 0.50 0.50 1.00 1.00 19.8 19.8 19.8 19.8 19.8 19.8 19.3 19.3 19.3 19.3 19.4 19.4 1.50 1.50 2.00 2.00 2.50 2.50 MIX 33.3 MIX 3.00 3.50 3.50 4.00 4.00 4.50 4.50 5.00 5.00 5.50 5.50 33.3 33. 32.9 32.7. 32.5 32.30 32.2 32.0 32.00 32.0 6.00 6.00 33.3 33.2 33.1 32,9 32.8 32.6 32.5 32.3 32.2 32.1 32.0 31.8 31.7 6.50 6.50 1 7.00 7.00 7.50 7.50 8.00 8.00 32.00 8.50 8.50 9.00 9.00 31,9 31.8 oz 9.50 9.50 Be sure to weigh the cup and its contents before disposing of it. On the accompanying pieces of graph paper, plot temperature on the vertical axis and time on the horizontal axis. Following Figure 12-1, use a straight edge to draw the best straight line through the data prior to mixing and subsequent to mixing and extrapolate both to the 3.0 minute mark. Determine the temperature difference between the lines at the 3.0 minute mark and enter the data on page 145. 2015 Cengage Learning. All Rights Reserved. May not be scanned copied or duplicated, or posted to a publicly accessible website, in whole or in part 144 (Remember to weigh the empty, dry cup before starting Graph the data below on one of graph sheets that follows) Run 3 (2.00 M HNO, + 2.02 M NaOH) Run 4 (1.00 M HCI + 2.02 M NaOH) Mixture Temp. Time (min.) HNO3(aq) Temp. (C) Time (min.) HCl(aq) Temp. Mixture Temp. (C) (C) (C) 0.00 0.00 0.50 0.50 1.00 1.00 19.9 19.9 19.9 20.0 20.0 20.0 19.8 19.8 19.8 19.8 19.8 19.8 1.50 1.50 2.00 2.00 2.50 2.50 3.00 MIX MIX 33.4 3.50 3.50 33.3 4.00 4.00 4.50 4.50 5.00 5.00 OD 5.50 5.50 6.00 6.00 26.5 26.4 26.3 26.2 26.1 D 25.9 25.8 257 25.7 25,6 25.5 25.5 6.50 33, 1 32.9 32.7 32.5 32.4 32.2 32.1 32,0 31.9 31.8 31.7 6.50 7.00 7.00 7.50 7.50 8.00 8.00 8.50 8.50 9.00 9.00 9.50 9.50 Be sure to weigh the cup and its contents before disposing of it. On the accompanying pieces of graph paper, plot temperature on the vertical axis and time on the horizontal axis. Following Figure 12-1, use a straight edge to draw the best straight line through the data prior to mixing and subsequent to mixing and extrapolate both to the 3.0 minute mark. Determine the temperature difference between the lines at the 3.0 minute mark and enter the data on page 145. 2015 Cengage Learning All Rights Reserved. May not be scanned, copied or duplicated, or posted to a publicly accessible website, in whole or in partStep by Step Solution
There are 3 Steps involved in it
Step: 1

Get Instant Access to Expert-Tailored Solutions
See step-by-step solutions with expert insights and AI powered tools for academic success
Step: 2

Step: 3
Ace Your Homework with AI
Get the answers you need in no time with our AI-driven, step-by-step assistance
Get Started
An Introduction To Fluid Mechanics
Authors: Faith A. Morrison
1st Edition
1107003539, 9781107003538