Answered step by step
Verified Expert Solution
Question
1 Approved Answer
I need help figuring out how to plot this into a scatter graph and how to do the regression analysis Mel Cheek is a fishing

I need help figuring out how to plot this into a scatter graph and how to do the regression analysis
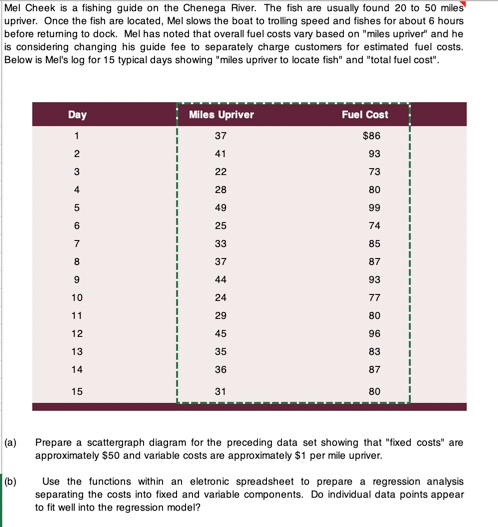
Mel Cheek is a fishing guide on the Chenega River. The fish are usually found 20 to 50 miles upriver. Once the fish are located, Mel slows the boat to trolling speed and fishes for about 6 hours before retuming to dock. Mel has noted that overall fuel costs vary based on "miles upriver" and he is considering changing his guide fee to separately charge customers for estimated fuel costs. Below is Mel's log for 15 typical days showing "miles upriver to locate fish" and "total fuel cost". Day Fuel Cost Miles Upriver 37 1 $86 93 - 2 41 1 3 22 73 4 28 80 49 99 5 6 74 25 33 85 7 8 37 87 9 44 93 77 10 11 24 29 45 80 12 96 13 35 83 14 36 87 15 31 80 (a) Prepare a scattergraph diagram for the preceding data set showing that "fixed costs" are approximately $50 and variable costs are approximately $1 per mile upriver. Use the functions within an eletronic spreadsheet to prepare a regression analysis separating the costs into fixed and variable components. Do individual data points appear to fit well into the regression model? (b)Step by Step Solution
There are 3 Steps involved in it
Step: 1

Get Instant Access to Expert-Tailored Solutions
See step-by-step solutions with expert insights and AI powered tools for academic success
Step: 2

Step: 3

Ace Your Homework with AI
Get the answers you need in no time with our AI-driven, step-by-step assistance
Get Started


