

Answered step by step
Verified Expert Solution
Question
1 Approved Answer
I need help finding calculations using the information on the financial sheets attached. Clipboard Number Font Alignment H6 F + INSERT BELOW MSFT INCOME STATEMENT
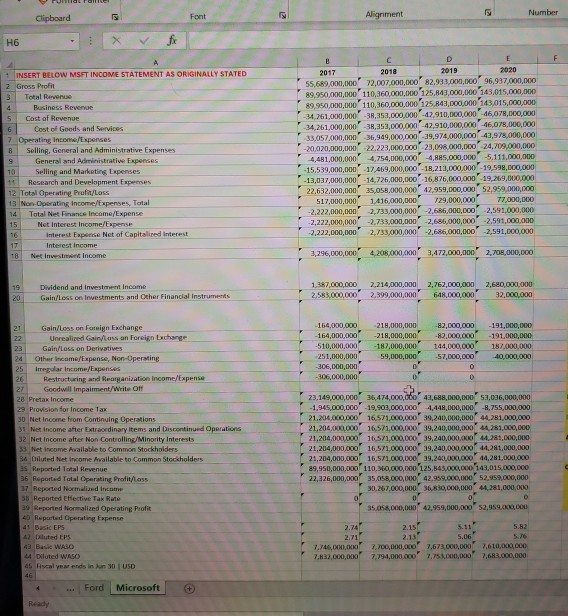
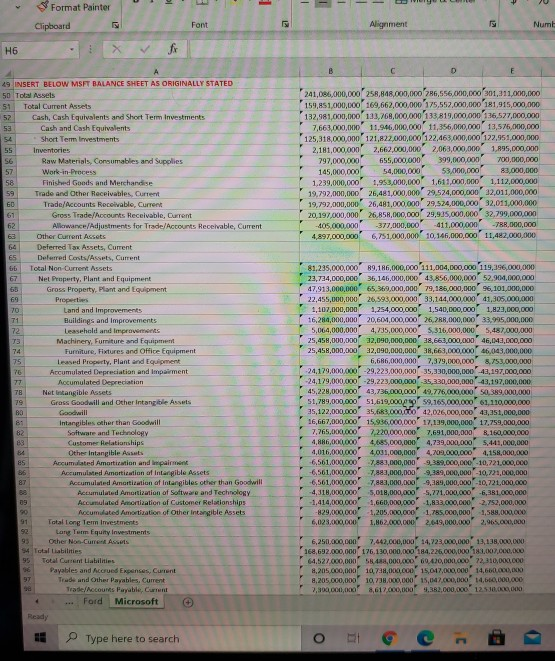
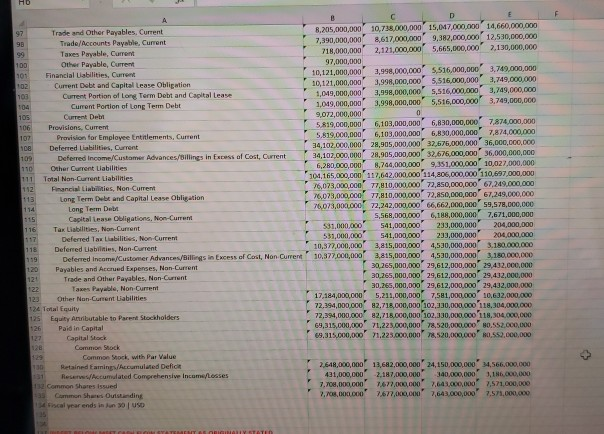
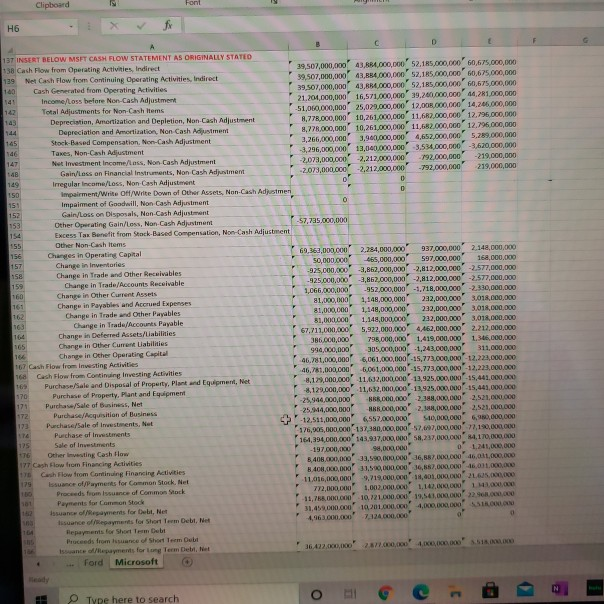
I need help finding calculations using the information on the financial sheets attached.
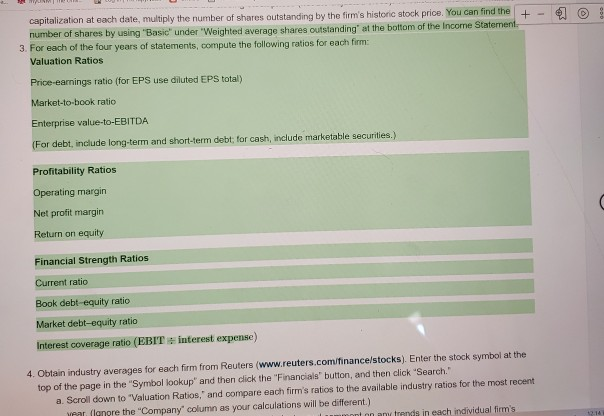
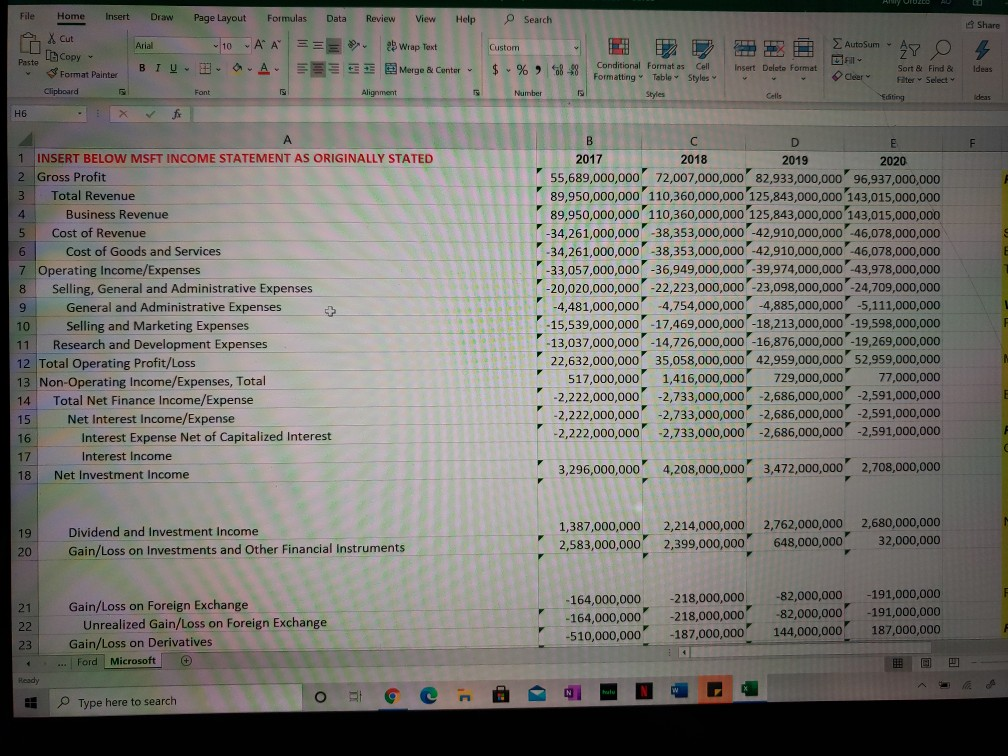
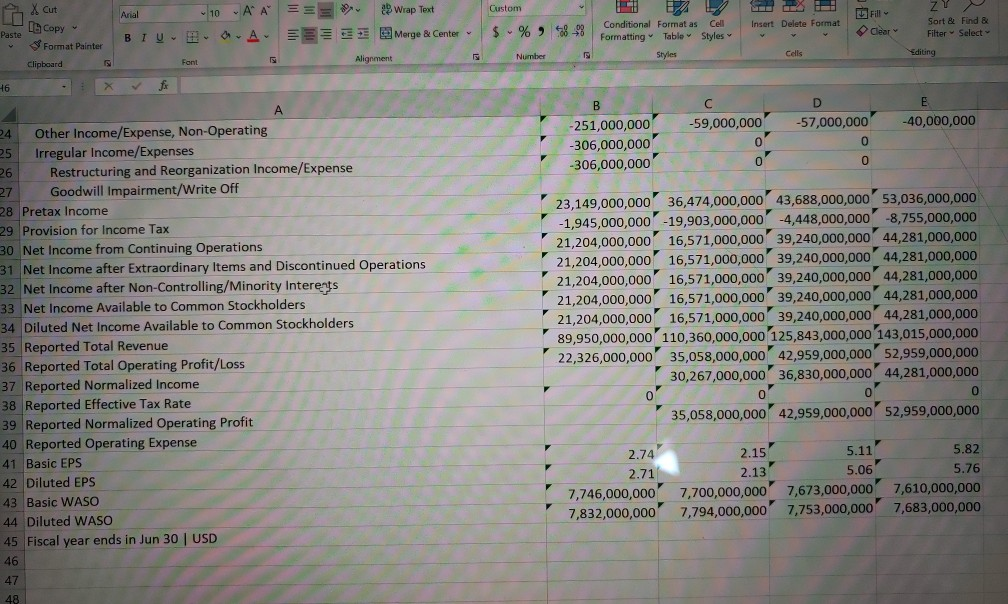
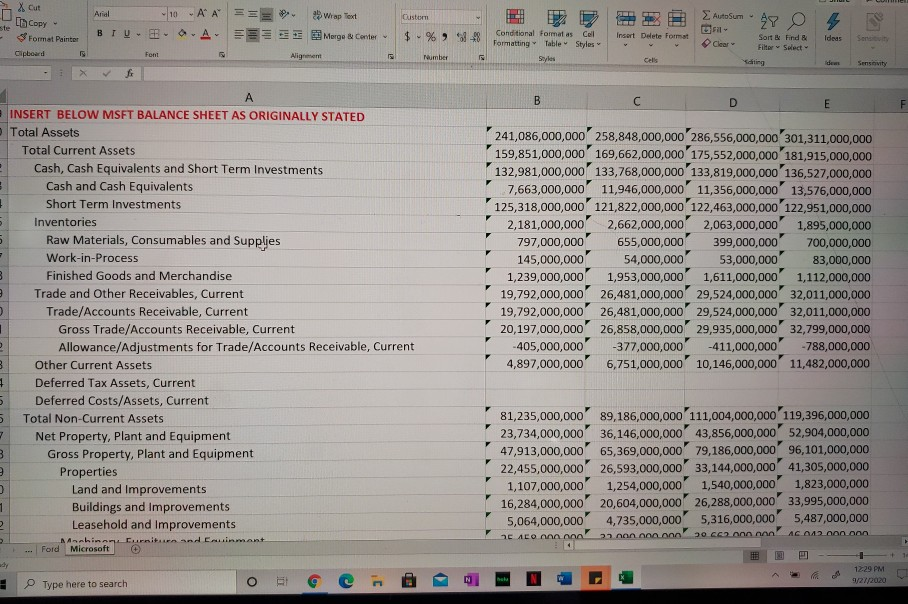
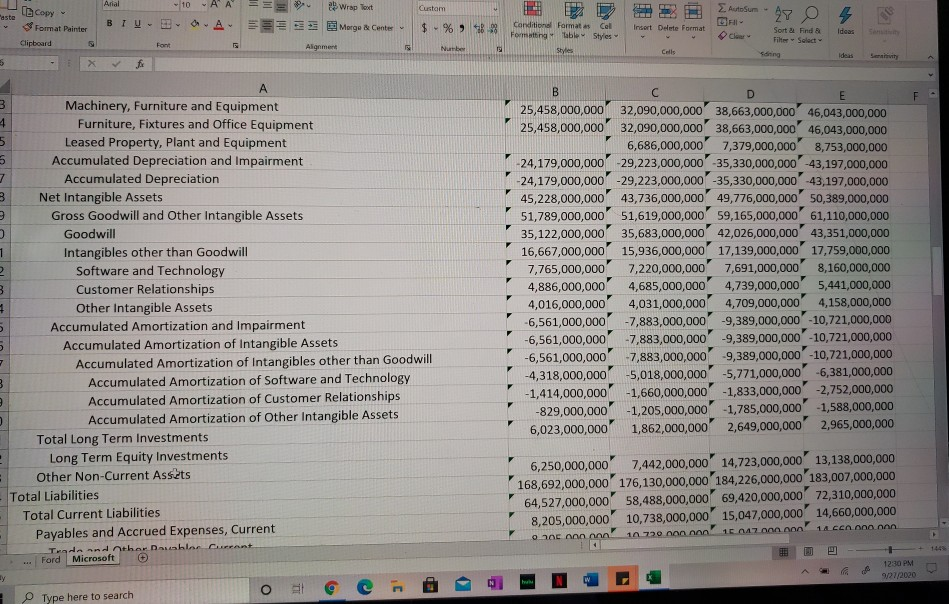
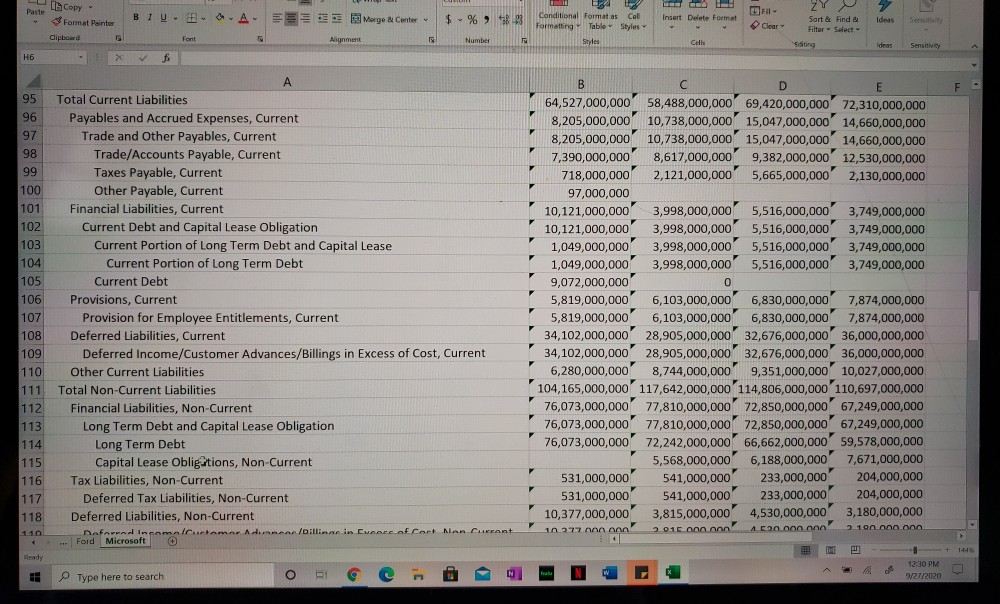
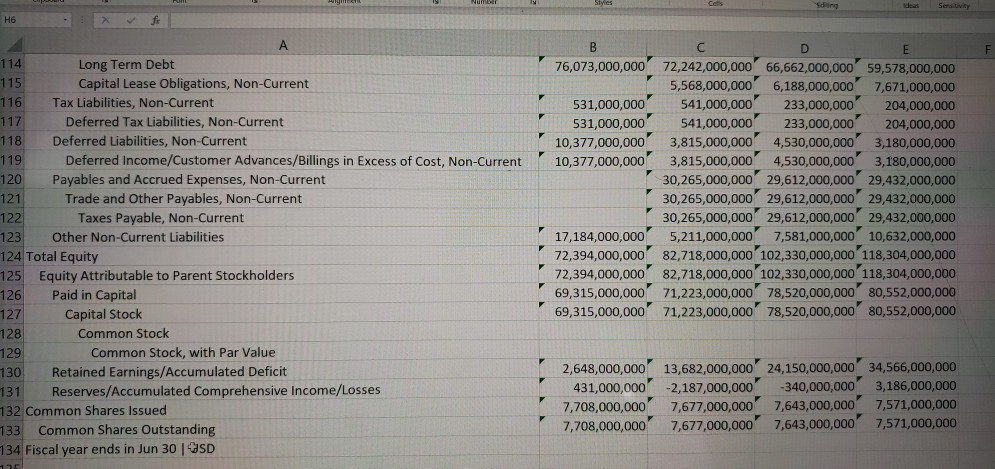
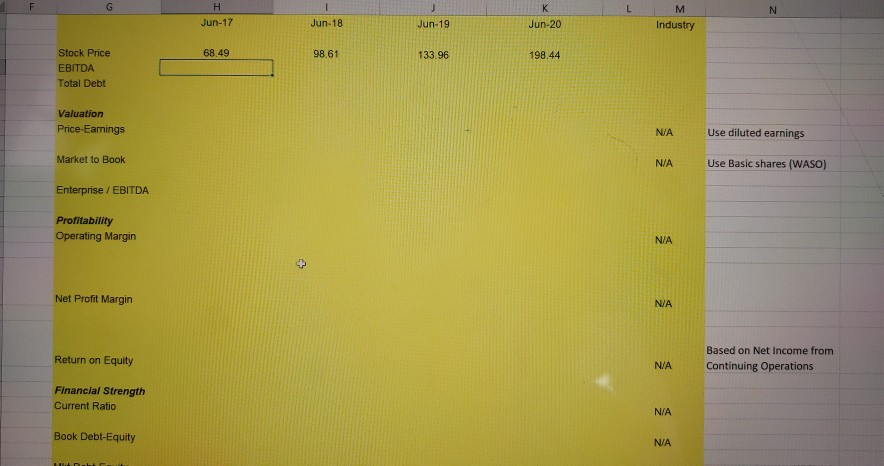
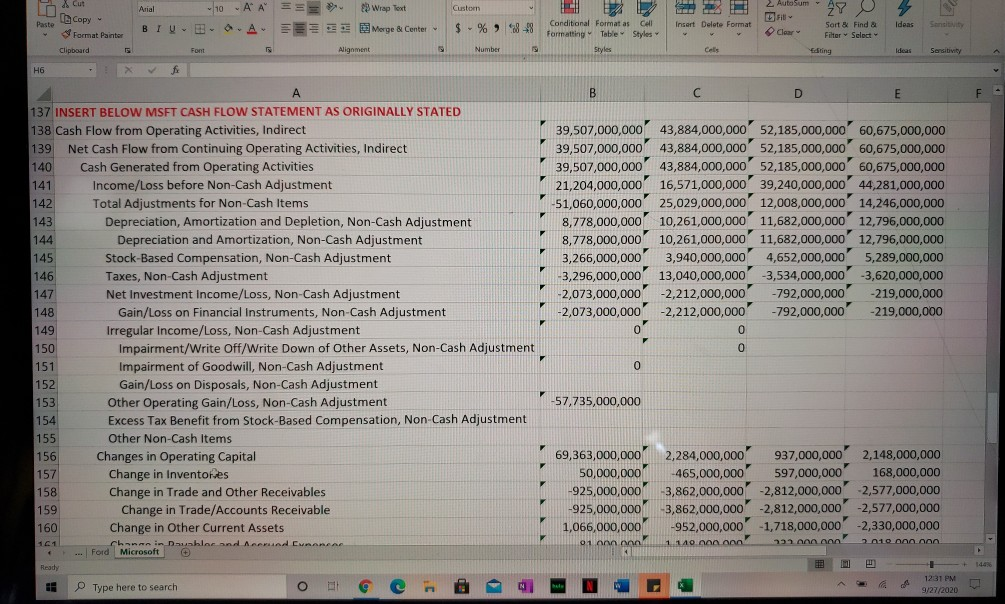
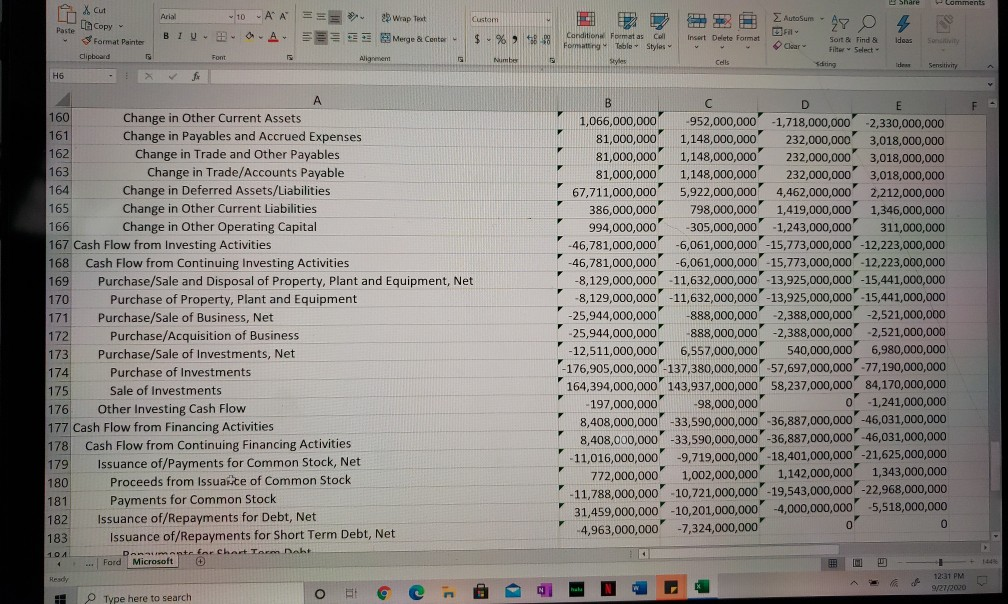
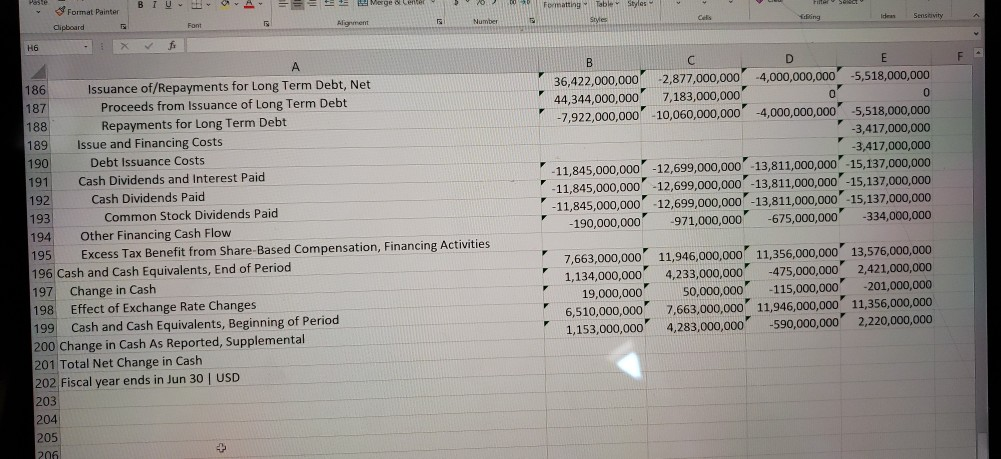
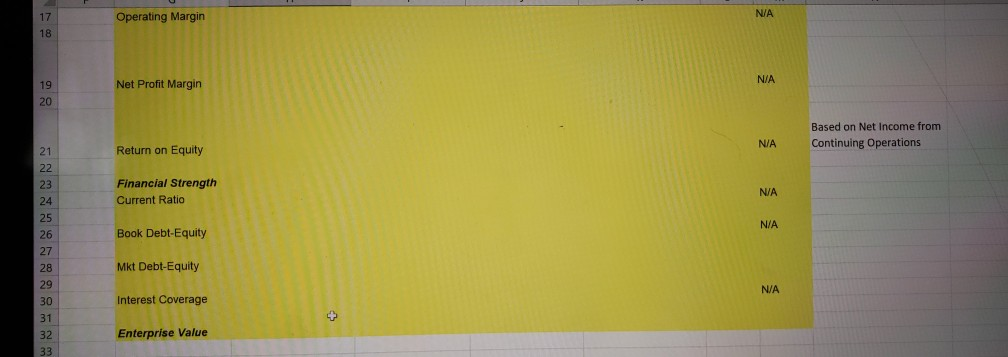
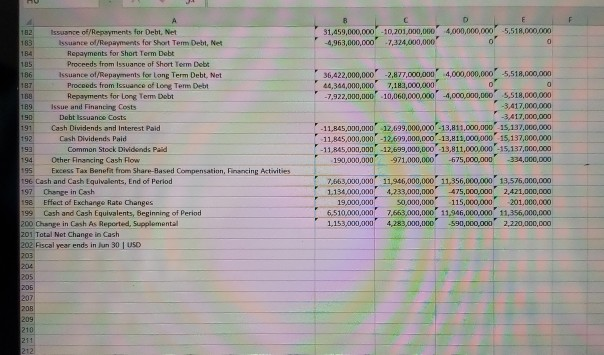
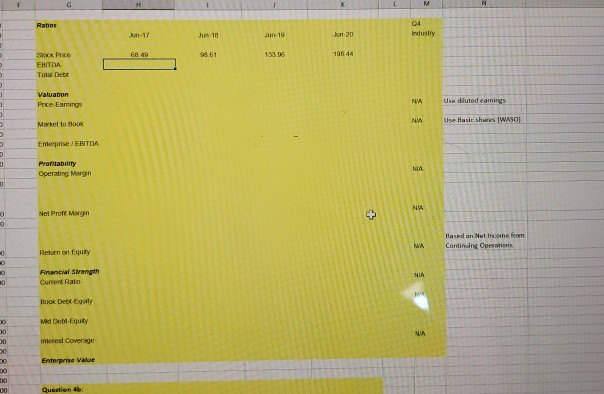
Clipboard Number Font Alignment H6 F + INSERT BELOW MSFT INCOME STATEMENT AS ORIGINALLY STATED 2 Gross Profit 3 Total Revence 4 Business Revenue 5 Cost of Revenue 6 Cost of Goods and Services 7 Operating Income/Expenses B Selling, General and Administrative Expenses 9 General and Administrative Expenses 10 Selling and Marketing Lupenses Research and Development Expenses 12 Total Operating profit/Loss 13 Non-Operating Income/Expenses. Total Total Net Finance Income/Expense 15 Net Interest Income/Expense 10 Interest Expense Net of Capitalized Interest 17 Interest income 18 Net invest income B E 2017 2010 2019 2020 55,689,000,000 72,007,000,000 82.933,000,000 96,937,000,000 89,950,000,000 110,360,000,000 125.843,000,000 143,015,000,000 89.950,000,000 110,360,000,000 125.843,000,000 143,015,000,000 -34,261,000,000 -38,353,000,000 -17,910,000,000 46,078,000,000 -34,261,000,000 -38,359,000,000 -42,910,000,000 46,078,000,000 33,057,000,000 36,949,000,000 -39,974,000,000 43,978,000,000 -20.020,000,000 22.223,000,000 23,098,000,000 -24,709,000,000 4,481,000,000 4,754,000,000 -4,885,000,000 5.111,000,000 -15,539,000,000 -17,469,000,000 18,213,000,000 19,598,000,000 - 13,037,000,000 -14.726,000,000 16,876,000,000 -19,269,000,000 22.632,000,000 35,058,000,000 42.959,000,000 52.959,000,000 517,000,000 1.416,000,000 729,000,000 77,000,000 -2.222,000,000 -2,733,000,000 -2,686,000,000 2,591,000,000 -2,222,000,000 -2,733,000,000 -2,686,000,000 -2,591,000,000 -2,222,000,000 2,733,000,000 -2,686,000,000 2,591,000,00 3,296,000,000 4.200.000.000 3,472,000,000 2,708,000,000 19 20 Dividend and Investment income Gain/Loss on Investments and Other Financial Instruments 1,387,000,000 2,214,000,000 2.583,000,000 2,399,000,000 2,762,000,000 648,000,000 2,680,000,000 32,000,000 -154.000.000 -164,000,000 -510,000,000 251,000,000 306,000,000 -306,000,000 218,000,000 -218,000,000 -187,000,000 59,000,000 -82,000,000 -82,000,000 144,000,000 -57,000,000 0 D -191,000,000 -191,000,000 187.000.000 40,000,000 21 Gain/Loss on Foreign Exchange 22 Unrealized Gain/Loss on Foreign Dicha 23 Gain/Loss on Derivatives 24 Other Incame/Expense, Non-Operating Irregular income/Expenses Restructuring and Reorganization Income/Expense 2T Goodwill Impairment/Write Off 28 Pretak Income 29 Provision for Income Tax 30 Net Income from Continuing Operations 3 Net Income after Extraordinary items and Discontinued Operations 32 Net Income after Non Controlling/Minority Interests 33. Net Income wailable to Common Stockholders 36 Diluted Net Income kvailable to Common Stockholders as Reported Total Revenue 36 Reported Total Operating Profit/Loss 37 Reported Normalized Income 38 Reported Effective Tax Rate 30 Reported Normalized Operating Profit 40 Reported Operating pense 41 Basic EPS 42 Duted EPS 43 Basic WASO 44 Diluted WASO 45 scal year ends in 30 USD 46 Ford Microsoft + Ready 23,149,000,000 36,474,000,000 42,688,000,000 53,036,000,000 -1.945,000,000 19,903,000,000 -4,448,000,000 -8,755,000,000 21.204.000.000 16.571.000.000 39.240,000,000 44,281,000,000 21,204,000,000 16.571.000.000 39.240,000,000 44,281,000,000 21,204.000.000 16.571,000,000 39.240.000.000 $4,281,000,000 21,204.000.000 16.571.000,000' 39,240.000.000 41,281,000,000 21,204,000,000 16,571,000,000 39.240.000 44,281,000,000 89,950,000,000 110.360,000,000 125,543,000.000 143,015,000,000 22,326,000,000 35,058,000,000 42.959,000,000 52,959,000,000 30.267,000,000 $10,000,000 44,281,000,000 D 35.654,000,000 47,59,000,000 52,959.000.000 2.741 2.71 7,746,00,000 7.833,000,000 2.15 5.11 5.82 2.13 5.06 3,700,000,000 7,673,000,000 7,610,000,000 7.794.000.000 7.75,000,000 7,683,000,000 ol E 1 Format Painter - - - Clipboard Font Alignment Numb H6 fr D 241,086,000,000 258,848,000,000 786,556,000,000 101,311,000,000 159,85 1,000,000 169,662,000,000 175,557,000,000 181.915,000,000 132,981,000,000 133,768,000,000 133,819,000,000 136,577,000,000 7,663,000,000 11,946,000,000 11,356,000,000 13,576,000,000 125,318,000,000 121,822,000,000 122,463,000,000 122,951,000,000 2,181,000,000 2,662,000,000 2,063,000,000 1,895,000,000 797,000,000 655,000,000 399,000,000 700,000,000 145,000,000 54,000,000 53,000,000 83,000,000 1,239,000,000 1,953,000,000 1,611,000,000 1,112,000,000 19,792,000,000 26,481,000,000 29,524,000,000 12,011,000,000 19,797,000,000 26,481,000,000 29,524,000,000 92,011,000,000 20,197,000,000 26,858,000,000 29,935.000.000 32.799,000,000 -405,000,000 -377,000,000 -411,000,000 -78,000,000 4,897,000,000 6,751,000,000 10,145,000,000 11,482,000,000 29 INSERT BELOW MSFT BALANCE SHEET AS ORIGINALLY STATED 50 Total Assets 51 Total Current Assets 52 Cash, Cash Equivalents and Short Term Investments 53 Cash and Cash Equivalents Short Term Investments 55 Inventories 56 Raw Materials, Consumables and Supplies 57 Work-in-Process 58 Finished Goods and Merchandise 59 Trade and Other Receivables, Current 60 Trade/Accounts Receivable, Current 67 Gross Trade/Accounts Receivable, Current 62 Allowance/Adjustments for Trade/Accounts Receivable, Current 63 Other Current Assets 64 Deferred Tax Assets, Current 65 Deferred Costs/Assets, Current Total Non-Current Assets 67 Net Property, plant and Equipment Gross Property, Plant and Equipment 69 Properties 70 Land and improvements 71 Buildings and improvements 72 Leasehold and improvements T3 Machinery, Furniture and Equipment 74 Furniture, Fixtures and Office Equipment 75 leased Properly. Plant and ment 76 Accumulated Depreciation and impairment Accumulated Depreciation 78 Net intangible Assets Grass Goodwill and Other Intangible Assets BO Goodwill Intangibles other than Goodwill 82 Software and Technology B3 Customer Relationships Other intangible Assets 85 Accumulated Amortization and impairment Accumulated Amortization of Intangible Assets 87 Accumulated Amortization of Intangibles other than Goodwill Accumulated Amortization of Software and Technology 09 Accumulated Amortization of Customer Relationships 30 Acumulated Amortization of other intangible Assets 91 Total Long Term Investments Long Term Equity Investments Other Nos Current Assets $4 Total abilities Total Current Liabilities Payables and Accrued Expenses, Current Trade and Other Payables, Current se Trade/Accounts Payable, Current Ford Microsoft 81,235,000,000 89,186,000,000 111,004,000,000 119,396,000,000 23,734,000,000 36,146,000,000 43,856.000.000 52.904,000,000 47.913,000,000 65,369,000,000 79,185,000,000 96,101,000,000 22,455,000,000 26,593,000,000 33,144,000,000 41,305.000.000 1,107,000,000 1,754,000,000 1,540,000,000 1,823,000,000 16,284,000,000 20,60,000,000 26,2R8,000,000 33.995,000,000 5,064,000,000 4,735,000,000 5.316,000,000 5,487.000.000 25,458,000,000 32,090,000,000 38,663,000,000 46,042,000,000 25,458,000,000 32,090,000,000 38,663,000,000 46,043,000,000 6,686,000,000 7,379,000,000 8,753,000,000 24,179,000,000 -29.223,000,000 35,330,000,000 43,197,000,000 24.179,000,000 -29.223,000,000 35,330,000,000 -43,197,000,000 45,228,000,000 43,736,000,000 49.776.000.000 50,389,000,000 51,789,000,000 51,619,000,0 59,165,000,000 61,110,000,000 35,122,000,000 35,663,000,000 42,026,000,000 43,35 1,000,000 16,667,000,000 15.936.000,000 17,139,000,000 17,759,000,000 7,765,000,000 7,220,000,000 7,691,000,000 8.160,000,000 4,886,000000 4,685,000,000 4,739,000,000 5,441,000,000 4,016,000,000 4,031,000,000 4,709,000,000 4,158,000,000 -6,561.000.000 7.881,000,000,000,000 10,721,000,000 -6,561,000,000 -7,882,000,000 -9,289,000,000 -10,721,000,000 -6,561.000.000 7,883,000,000 -9,389,000,000 -10,721,000,000 -4,318,000,000 5,018,000,000 5,771,000,000 -6,381,000,000 -1.414,000,000 1,660,000,000 1,833.000.000 2,752,000,000 -829,000,000 1,205.000.000 1.785,000,000 1,589.000.000 6,023.20.000 1.862,000,000 2.649,000,000 2,965.000.000 6,250,000,000 7,442,000,000 14,723,000,000 13,138,000,000 168,692,000,000 176.130,000,000 184.226,000,000 183.000.000.000 64.527.000,000 58.480,000.00 60.410,000,000 72,310,000,000 8,205,000,000 10,738,000,000 15,017,000,000 14,660,000,000 8,205,000,000 10,738,000,000 15,047.000.000 14,660,000,000 2,890,000,000 8,617.000,00 1.382.000.000 1250,000,000 Type here to search 3 HD F 97 Trade and Other Payables. Current 98 Trade/Accounts Payable, Current 99 Taxes Payable, Current 100 Other Payable, Current 101 Financial abilities, Current 102 Current Debt and Capital Lease Obligation 103 Current Portion of Long Term Debt and Capital Lease 104 Current Portion of Long Term Debt 105 Current Der 106 Previsions, Current 107 Provision for Employee Entitlements, Current 108 Deferred Liabilities, Current 109 Deferred Income/Customer Advances/Billings in Excess of Cost, Current 110 Other Current Liabilities 111 Total Non.Current Liabilities 112 Anancial Liabilities, Non-Current 113 Long Term Debt and Capital Lease Obligation 114 Long Term Debt -15 Capital Lease Obligations, Non-Current 116 Tax Liabilities, Non-Current Deferred Tax liabilities, Non-Current 115 Deferred Liabinies, Non-Current 199 Deferred Income/Customer Advances/Billings in Excess of Cost, Non Current 120 Payables and Accrued Expenses, Non-Current 121 Trade and Other Payables, Non-Current 122 Taxes Payable, Non-Ourrent 123 Other Non-Current Liabilities 124 Total Equity Equity Antributable to Parent Stockholders 126 Paid in Capital 127 Capital Stock 128 Common Stock Common Mock, with Par Value Retained Earnings/Accumulated Defick Reser/Accumulated Comprehensive Income Losses 132 Common Shares issued Common Shoes Outstanding 14 Fiscal year ends in jun 30 USD 15 B 8.205,000,000 10,738,000,000 15,047,000,000 14,660,000,000 7,390,000,000' 8,617,000,000' 9,382,000,000 12,530,000,000 718,000,000 2,121,000,000 5,665,000,000 2,130,000,000 97,000,000 10,121,000,000 3,998,000,000' 5,516,000,000' 9.749,000,000 10,121,000,000 3,998,000,000 5,516,000,000 3,749,000,000 1,049,000,000 3,998,000,000 5,516,000,000 3,749,000,000 1,049,000,000 3.998,000,000 5,516,000,000 3.749,000,000 9,072,000,000 0 5.819,000,000 6,103,000,000 6,830,000,000 7.874,000,000 5.819,000,000 6,103,000,000 6.830,000,000 7,874,000,000 34,102,000,000 29,905,000,000 32,676,000,000 36,000,000,000 34,102.000,000' 28,905,000,000 32,676,000,000 36,000,000,000 6,280.000,000 8,744,000,000' 9,351.000.000 10,027,000,000 104,165,000,000 117,642.000.000 114,806,000,000 110,697,000,000 76,073,000,000' 77,810.000.000 73,850,000,000 67.249.000.000 76,075,000,000' 77,810.000.000 72,850,000,000 67,249,000,000 76,073,000,000 72,242,000,000 66,662,000,000 59,578,000,000 5,568,000,000 6,188,000,000 7,671,000,000 531,000,000 541,000,000 233,000,000 204,000,000 531,000,000 541,000,000 233,000,000 204.000.000 10,877,000,000 3,815,000,000 4,530,000,000 3.180.000.000 10.377,000,000 3,815,000,000 4,530,000,000 3,150,000,000 30,265,000,000 29,612,000,000 29,432,000,000 30,265,000,000 29,612,000,000 29,432.000.000 30.265,000,000 29,612,000,000 29,432,000,000 17,184,000,000 5.211,000,000 7,581,000,000 10,632.000.000 72,394,000,000 82.715,000,000 102,330.000.000 118,304,000,000 72,394,000,000 82,715,000,000 102.330,000,000 118.304,000,000 69,315,000,000 71.223,000,000 78,520.000.000 0.552.000.000 69.315.000.000 71.225.000.000 78,520,000.00' NO.552,000,000 2,648,000,000 13,682,000,000 24,150,000,000 $4,566.000.000 431,000,000 2,1870,000 340,000,000 3,186,000,000 7.704,000,000 7,677,000,000 7,643,000,000 7,571,000,000 7.705.00CLOCO 7.677,000,000 7,642.000,000 7.571.000.000 Y STATE Clipboard Font H6 D 137 INSERT BELOW MSFT CASH FLOW STATEMENT AS ORIGINALLY STATED 138 Cash Flow from Operating Activities, Indirect 39,507,000,000 43,884,000,000' 52.185.000.000 60,675,000,000 139 Net Cash Flow from Continuing Operating Activities, Indirect 39,507,000,000 43,884,000,000' 52.185,000,000 60,675,000,000 140 Cash Generated from Operating Activities 39.507,000,000 45,81,000,000' 52.185,000,000 60,675,000,000 141 Income/Loss before Non-Cash Adjustment 21.204,000,000 16,571,000,000 39.200,000,000 44,2R1,000,000 Total Adjustments for Non-Cash Items -51,000,000,000' 25,029,000,000 12,000,000,000 14,206,000,000 143 Depreciation, Amortization and Depletion, Non-Cash Adjustment 1,77.000,000' 10,261,000,000 1167.000.000 12.796.000,000 144 Depreciation and Amortization, Non Cash Adjustment 8,778,000,000' 10.261,000,000 11.682,000,000 12.796.000.000 1:45 Stock-Based Compensation, Non-Cash Adjustment 3,266,000,000 3,900,000,000' 4,652,000,000 5.289.000,000 Taxes, Non-Cash Adjustment 3,296,000,000' 19,000,000,000' 3.534,000,000 -3,620,000,000 147 Net Investment Income/lass, Non-Cash Adjustment -2,073,000,000 2,212,000,000 792,000,000 -219,000,000 14B Gainless on Financial Instruments, Non Cash Adjustment -2,073,000,000 -2,212,000,000 -792.000.000 219,000,000 149 Irregular Income/Loss, Non Cash Adjustment 0 150 Impairment/Write Off/Write Down of Other Assets, Non-Cash Adjustmen 0 151 Impalment of Goodwill, Non Cash Adjustment 0 152 Gain/Loss on Disposals, Non-Cash Adjustment 153 Other Operating Gain/Loss, Non-Cash Adjustment -57,735,000,000 154 Excess Tax Benefit from Stock-Based Compensation, Non-Cash Adjustment 155 Other Non-Cash Items 156 Changes in Operating Capital 60,363,000,000 2,284,000,000 937,000,000 2.148,000,000 157 Change in Inventories 50,000,000 465,000,000 597,000,000 168,000,000 158 Change in Trade and Other Receivables -925,000,000 -3,862,000,000 -2,812,000,000 -2,577,000,000 159 Change in Trade/Accounts Receivable -925,000,000 3,862,000,000 2,812,000,000 -2,577,000,000 160 Change in Other Current Assets 1,066,000,000 -952,000,000 -1,718,000,000 -2.330,000,000 165 Change in Payables and conued Expenses 81,000,000 1,148,000,000 232,000,000 3.018,000,000 162 Change in Trade and Other Payables 81,000,000 1,148,000,000 232,000,000 3.012,000,000 163 Change in Trade/Accounts Payable 81,000000 1,148,000,000 232,000,000 3.018,000,000 164 Change in Deferred Assets/Uabilities 67,711,000,000' 5,922,000,000 4462,000,000 2.212,000,000 165 Change in Other Current Liabilities 386.000.000 798,000,000 1,419,000,000 1,346,000,000 164 Change in Other Operating Capital 990,000,000 305,000,000 -1,243,000,000 311.000.000 167 Cash Flow from investing Activities 46.781,000,000 6,061,000,000 -15,773.000.000 12.224.000.000 168 Cash Flow from Continuing Investing Activities 46,781,000,000 -6,061,000,000 -15,773,000,000 12,223,000,000 Purchase/Sale and Disposal of Property. Plant and Equipment, Net -8,129,000,000 11.632,000.000 13,925.000,000 15,441.000.000 170 Purchase of Property. Plant and Equipment -8,129,000,000 11,632,000,000 13,925,000,000 15,441,000,000 Purchase/Sale of Business, Net -25.944,000,000 NR.000.000 -2.388,000,000 0 2,521,000,000 172 Purchase/Acquisition of Business -25.214,000,000 NR.000,000 2,188,000,000 2,521,000,000 173 Purchase/sale of Investments, Net -12.511,000,000 6,557,000,000 540,000,000 600,000,000 Purchase of imments 176,905,000,000 137,380,000,000 57.697,000,000 77,190,000,000 125 Sale of Investments 161,294.000.000 143,037,000,000 5,237,000,000 $4,170,000,000 176 -197.000,000 Other Investing Cash Flow 9,000,000 0 1,241,000,000 177 Cash flow from Financing Activities 8,408,000 33,590,000,000 36,887,000,000 46,041,000,000 Cash Flow from Continuing Financing Activities 8.400,000 31,800,000,000 36,667.000.000 46,011.000,00 179 Issuance of Payments for Common Stock.Net 11.016, 00, 000 9,719,000,000 1,401.000.000 1.625,000,000 Proceeds from Issuance of Commons Work 772,000,000 1,002.000.000 1.142,000,000 100 Payments for Common Stock 11,786 OKIDO 10,721.000.000 19,541,000,000 12.968,00,00 Issuance of Repayments for Delt, Net 31,450.000.000 10.2010.0" 4,000,000,000 RON isance of payments for Short Term Debt, Net 7.124.000.000 + 36 A120,000 2.877.000.000 41.000 1.000 Proceeds from suance Short Term Dutt Issuance of the payments for og Term Delt, het Ford Microsoft O Type here to search F 31,459,000,000 -10,201,000,000 4,000,000,000 -4.963,000,000 7,324,000,000 -5,518,000.00 0 36,422,000,000 2,877,000,000 4,000,000,000 -5,518,000,000 44,344,000,000 7,180,000,000 0" 0 -7,922,000,000 10,060,000,000 -4,000,000,000 5,518,000,000 -3,417,000,000 -3.417,000,000 -11,845,000,000 12.699,000,000 -13,811,000,000 15,137,000,000 11,845,000,000 -12.699,000,000 - 13,811,000,000 15,137,000,000 - 11.845,000,000 17,609,000,000 13,811,000,000 -15,137,000,000 190,000,000 -971,000,000 -675,000,000 -334,000,000 A 102 Issuance of/Repayments for Debt, Net 183 Issuance of/Repayments for Short Term Debt, Net 134 Repayments for Short Term Debt Proceeds from Issuance of Short Term Debt 186 Issuance of/Repayments for Long Term Debt. Net 1BT Proceeds from Issuance of Long Term Debt 1BB Repayments for Long Term Debt 189 Issue and Financing Costs 190 Debt Issuance Costs 191 Cash Dividends and interest Paid 192 Cash Dividends Paid 193 Common Stock Dividends Paid 194 Other Financing Cash Flow 195 Excess Tax Benefit from Share-Based Compensation Financing Activities 196 Cash and Cash Equivalents, End of Period 197 Change in Cash 198 Effect of Exchange Rate Changes 199 Cash and Cash Equivalents, Beginning of Period 200 Change in Cash As Reported, Supplemental 201 Total Net Change in Cash 202. Fiscal year ends in jun 30 USD 203 2014 205 205 207 200 209 210 211 1212 7,663,000,000 11,946,000,000 11,356,000,000 13,576,000,000 1.134,000,000 4,233,000,000 475,000,000 2,421,000,000 19,000,000 50,000,000 115,000,000 201,000,000 6,510,000,000 7,663,000,000 11,946,000,000 11,356,000,000 1,153,000,000 4,283,000,000 -590,000,000 2,220,000,000 F Rabos 04 Industry Lin-17 Jun 18 Jun-19 Jun 20 68.40 98.61 133.95 19844 Stock Price EBITDA Total Debt 1 Valuapon Price Camings NA Use diluted earings NW Markello Back Use Basic shares (WASOJ > Enterprise EBITDA 3 Profitability Operating Margin NA 0 NIA Net Proft Margin + Based on Nut Incone from Continuing Opermin NA 0 Return on Equity Financial Strength Current Ralo Book Debt Egaly 30 Mk Debt-Equity NA Interest Coverage 30 30 0 Enterprise Value 00 Question 4 capitalization at each date, multiply the number of shares outstanding by the firm's historic stock price. You can find the + number of shares by using "Basic" under "Weighted average shares outstanding at the bottom of the Income Statement 3. For each of the four years of statements, compute the following ratios for each firm: Valuation Ratios Price earnings ratio (for EPS use diluted EPS total) Market-to-book ratio Enterprise value-to-EBITDA (For debt, include long-term and short-term debt: for cash, include marketable securities.) Profitability Ratios Operating margin Net profit margin Return on equity Financial Strength Ratios Current ratio Book debt equity ratio Market debt-equity ratio Interest coverage ratio (EBIT interest expense) 4. Obtain industry averages for each firm from Routers (www.reuters.com/finance/stocks). Enter the stock symbol at the top of the page in the "Symbol lookup" and then click the "Financials" button, and then click "Search." a. Scroll down to "Valuation Ratios,' and compare each firm's ratios to the available industry ratios for the most recent var lengre the "Company column as your calculations will be different.) trends in each individual firm's Y UTULED File Home home Insert Draw Page Layout Formulas Data Review View Help Search Share Xcut LO Da Copy - Arial - 10 - A A SEE a Wrap Text Custom AutoSum Paste BIU Merge & Center $ %) 68-28 Insert Delete Format Ideas Format Painter Conditional Format as Cell Formatting Table Styles Styles Clear Sort & Find & Filter Select Clipboard 5 Font Alignment Number 15 Cells Editing Ideas H6 X f D E F A 1 INSERT BELOW MSFT INCOME STATEMENT AS ORIGINALLY STATED 2 Gross Profit 3 Total Revenue 4 Business Revenue 5 Cost of Revenue 6 Cost of Goods and Services 7 Operating Income/Expenses 8 Selling, General and Administrative Expenses 9 General and Administrative Expenses 10 Selling and Marketing Expenses 11 Research and Development Expenses 12 Total Operating Profit/Loss 13 Non-Operating Income/Expenses, Total 14 Total Net Finance Income/Expense 15 Net Interest Income/Expense 16 Interest Expense Net of Capitalized Interest 17 Interest Income 18 Net Investment Income B C 2017 2018 2019 2020 55,689,000,000 72,007,000,000 82,933,000,000 96,937,000,000 89,950,000,000 110,360,000,000 125,843,000,000 143,015,000,000 89,950,000,000 110,360,000,000 125,843,000,000 143,015,000,000 -34,261,000,000 38,353,000,000 -42,910,000,000 -46,078,000,000 -34,261,000,000 -38,353,000,000 -42,910,000,000 -46,078,000,000 -33,057,000,000 -36,949,000,000 -39,974,000,000 -43,978,000,000 -20,020,000,000 -22,223,000,000 -23,098,000,000 -24,709,000,000 -4,481,000,000 -4,754,000,000 4,885,000,000 -5,111,000,000 -15,539,000,000 -17,469,000,000 -18,213,000,000 - 19,598,000,000 -13,037,000,000 -14,726,000,000 -16,876,000,000 -19,269,000,000 22,632,000,000 35,058,000,000 42,959,000,000 52,959,000,000 517,000,000' 1,416,000,000 729,000,000 77,000,000 -2,222,000,000 -2,733,000,000 -2,686,000,000 -2,591,000,000 -2,222,000,000 -2,733,000,000 -2,686,000,000 -2,591,000,000 -2,222,000,000 -2,733,000,000 -2,686,000,000 -2,591,000,000 3,296,000,000' 4,208,000,000 3,472,000,000 2,708,000,000 19 20 Dividend and Investment Income Gain/Loss on Investments and Other Financial Instruments 1,387,000,000 2,214,000,000 2,762,000,000 2,680,000,000 2,583,000,000 2,399,000,000 648,000,000 32,000,000 21 22 23 Gain/Loss on Foreign Exchange Unrealized Gain/Loss on Foreign Exchange Gain/Loss on Derivatives ... Ford Microsoft 164,000,000 -164,000,000 -510,000,000 -218,000,000 -218,000,000 -187,000,000 -82,000,000 -82,000,000 144,000,000 -191,000,000 -191,000,000 187,000,000 (+ Ready halu Type here to search O 9 Custom H God cut Arial Fill 10 - A A AA EE 29 Wrap Text A Merge & Center Insert Delete Format ZY Sort & Find & Filter Select $ % 48-58 Clear BIU LCopy Paste * Format Painter Clipboard Conditional Format as Cell Formatting Table Styles Styles Number Cells Editing Font Alignment 46 f E C -59,000,000 -40,000,000 B -251,000,000 -306,000,000 -306,000,000 D -57,000,000 0 0 01 0 A 24 Other Income/Expense, Non-Operating 25 Irregular Income/Expenses 26 Restructuring and Reorganization Income/Expense 27 Goodwill Impairment/Write Off 28 Pretax Income 29 Provision for Income Tax 30 Net Income from Continuing Operations 31 Net Income after Extraordinary Items and Discontinued Operations 32 Net Income after Non-Controlling/Minority Interests 33 Net Income Available to Common Stockholders 34 Diluted Net Income Available to Common Stockholders 35 Reported Total Revenue 36 Reported Total Operating Profit/Loss 37 Reported Normalized Income 38 Reported Effective Tax Rate 39 Reported Normalized Operating Profit 40 Reported Operating Expense 41 Basic EPS 42 Diluted EPS 43 Basic WASO 44 Diluted WASO 45 Fiscal year ends in Jun 30 USD 46 47 48 23,149,000,000' 36,474,000,000 43,688,000,000 53,036,000,000 -1,945,000,000 -19,903,000,000 -4,448,000,000 -8,755,000,000 21,204,000,000 16,571,000,000 39,240,000,000 44,281,000,000 21,204,000,000' 16,571,000,000 39,240,000,000 44,281,000,000 21,204,000,000 16,571,000,000 39,240,000,000 44,281,000,000 21,204,000,000' 16,571,000,000 39,240,000,000 44,281,000,000 21,204,000,000 16,571,000,000 39,240,000,000 44,281,000,000 89,950,000,000 110,360,000,000 125,843,000,000 143,015,000,000 22,326,000,000 35,058,000,000 42,959,000,000 52,959,000,000 30,267,000,000 36,830,000,000 44,281,000,000 0 07 01 35,058,000,000 42,959,000,000 52,959,000,000 0 2.74 2.15 5.11 5.82 2.71 2.13 5.06' 5.76 7,746,000,000 7,700,000,000 7,673,000,000 7,610,000,000 7,832,000,000 7,794,000,000 7,753,000,000 7,683,000,000 X Cut Arial AutoSum- Un Copy ste Custom $ % 848 48 10 - AA== Wrap Text ER A.A.EE Morge & Conter Alignment Format Painter BIU Insert Delete Format Ideas Conditional Formatas Cell Formatting Table Styles Styles Sort & Find & Filter Select Sen Clipboard Font Number Cels diting dows Sensity f B D E F 241,086,000,000' 258,848,000,000 286,556,000,000 301,311,000,000 159,851,000,000 169,662,000,000 175,552,000,000 181,915,000,000 132,981,000,000 133,768,000,000 133,819,000,000 136,527,000,000 7,663,000,000 11,946,000,000' 11,356,000,000' 13,576,000,000 125,318,000,000 121,822,000,000 122,463,000,000 122,951,000,000 2,181,000,000 2,662,000,000 2,063,000,000 1,895,000,000 797,000,000 655,000,000 399,000,000 700,000,000 145,000,000 54,000,000 53,000,000 83,000,000 1,239,000,000 1,953,000,000 1,611,000,000 1,112,000,000 19,792,000,000 26,481,000,000 29,524,000,000 32,011,000,000 19,792,000,000 26,481,000,000 29,524,000,000 32,011,000,000 20,197,000,000 26,858,000,000 29,935,000,000 32,799,000,000 -405,000,000 -377,000,000 -411,000,000 -788,000,000 4,897,000,000 6,751,000,000 10,146,000,000 11,482,000,000 3 A INSERT BELOW MSET BALANCE SHEET AS ORIGINALLY STATED Total Assets Total Current Assets Cash, Cash Equivalents and Short Term Investments Cash and Cash Equivalents 1 Short Term Investments Inventories Raw Materials, Consumables and Supplies Work-in-Process Finished Goods and Merchandise Trade and Other Receivables, Current Trade/Accounts Receivable, Current 1 Gross Trade/Accounts Receivable, Current 2 Allowance/Adjustments for Trade/Accounts Receivable, Current 3 Other Current Assets 7 Deferred Tax Assets, Current Deferred Costs/Assets, Current 5 Total Non-Current Assets Net Property, Plant and Equipment 3 Gross Property, plant and Equipment 3 Properties Land and Improvements 1 Buildings and Improvements Leasehold and Improvements Anchinamuurniture and Casinmant Microsoft 9 5 7 81,235,000,000 89,186,000,000 111,004,000,000 119,396,000,000 23,734,000,000 36,146,000,000 43,856,000,000 52,904,000,000 47,913,000,000 65,369,000,000 79,186,000,000 96,101,000,000 22,455,000,000' 26,593,000,000 33,144,000,000 41,305,000,000 1,107,000,000 1,254,000,000 1,540,000,000 1,823,000,000 16,284,000,000 20,604,000,000 26,288,000,000 33,995,000,000 5,064,000,000 4,735,000,000 5,316,000,000 5,487,000,000 CALO 27.non 0000 30 CC Ana AC 2.000.000 Ford o 12:29 PM 9/27/2020 Type here to search C Arial -10 Copy Custom E Autosum - aste AA A 27 O BIU- a Wrap Text Es Merge Center Alignment Format Painter Clipboard $ - % ** Insert Delete Format Ideas Conditional Formats Cell Formatting able Styles Styles Font Sort Find & Filter Select Soring Number Cells Ideas X f F . 3 Machinery, Furniture and Equipment 4 Furniture, Fixtures and Office Equipment 5 Leased Property, plant and Equipment 5 Accumulated Depreciation and Impairment 7 Accumulated Depreciation Net Intangible Assets Gross Goodwill and Other Intangible Assets Goodwill 1 Intangibles other than Goodwill 2 Software and Technology 3 Customer Relationships 7 Other Intangible Assets Accumulated Amortization and Impairment 5 Accumulated Amortization of Intangible Assets - Accumulated Amortization of Intangibles other than Goodwill B Accumulated Amortization of Software and Technology Accumulated Amortization of Customer Relationships Accumulated Amortization of Other Intangible Assets Total Long Term Investments Long Term Equity Investments Other Non-Current Asstts Total Liabilities Total Current Liabilities Payables and Accrued Expenses, Current Tadaandther Dahlan Current Ford Microsoft B C D E 25,458,000,000 32,090,000,000 38,663,000,000 46,043,000,000 25,458,000,000 32,090,000,000 38,663,000,000 46,043,000,000 6,686,000,000 7,379,000,000 8,753,000,000 -24,179,000,000 29,223,000,000 35,330,000,000 -43,197,000,000 -24,179,000,000 -29,223,000,000 -35,330,000,000 -43,197,000,000 45,228,000,000 43,736,000,000 49,776,000,000 50,389,000,000 51,789,000,000' 51,619,000,000 59,165,000,000 61,110,000,000 35,122,000,000 35,683,000,000 42,026,000,000 43,351,000,000 16,667,000,000 15,936,000,000 17,139,000,000 17,759,000,000 7,765,000,000 7,220,000,000 7,691,000,000 8,160,000,000 4,886,000,000 4,685,000,000 4,739,000,000 5,441,000,000 4,016,000,000 4,031,000,000 4,709,000,000 4,158,000,000 -6,561,000,000 -7,883,000,000 -9,389,000,000 -10,721,000,000 -6,561,000,000 -7,883,000,000 -9,389,000,000 -10,721,000,000 -6,561,000,000 -7,883,000,000 -9,389,000,000 -10,721,000,000 -4,318,000,000 -5,018,000,000 -5,771,000,000 -6,381,000,000 -1,414,000,000 -1,660,000,000 -1,833,000,000 -2,752,000,000 -829,000,000 -1,205,000,000 -1,785,000,000 -1,588,000,000 6,023,000,000 1,862,000,000 2,649,000,000 2,965,000,000 6,250,000,000 7,442,000,000' 14,723,000,000 13,138,000,000 168,692,000,000 176,130,000,000 184,226,000,000 183,007,000,000 64,527,000,000 58,488,000,000 69,420,000,000 72,310,000,000 8,205,000,000 10,738,000,000 15,047,000,000 14,660,000,000 14 CCA O Onn 10. 47000 AO 010 A 10720 no no 1230 PM 921/2020 g ca Type here to search Paste In Copy Format Painter FI BIU. A SEE Morge Center $ % 9 184 Conditional Format as Cell Formatting Table Styles Insert Delete Format Ideas ZY Sort & Find & Filter Select Sating Clipboard Font Alignment Number Styles CH Sensity H6 f F 95 96 97 98 99 100 101 102 103 104 105 106 107 108 109 110 111 112 113 114 115 116 117 Total Current Liabilities Payables and Accrued Expenses, Current Trade and Other Payables, Current Trade/Accounts Payable, Current Taxes Payable, Current Other Payable, Current Financial Liabilities, Current Current Debt and Capital Lease Obligation Current Portion of Long Term Debt and Capital Lease Current Portion of Long Term Debt Current Debt Provisions, Current Provision for Employee Entitlements, Current Deferred Liabilities, Current Deferred Income/Customer Advances/Billings in Excess of Cost, Current Other Current Liabilities Total Non-Current Liabilities Financial Liabilities, Non-Current Long Term Debt and Capital Lease Obligation Long Term Debt Capital Lease ObligQtions, Non-Current Tax Liabilities, Non-Current Deferred Tax Liabilities, Non-Current Deferred Liabilities, Non-Current nafar innamnicutamar Aduncacloillinge in Cence of Cart Men Cueront B D E 64,527,000,000 58,488,000,000 69,420,000,000 72,310,000,000 8,205,000,000 10,738,000,000 15,047,000,000' 14,660,000,000 8,205,000,000 10,738,000,000 15,047,000,000 14,660,000,000 7,390,000,000 8,617,000,000 9,382,000,000 12,530,000,000 718,000,000 2,121,000,000' 5,665,000,000 2,130,000,000 97,000,000 10,121,000,000 3,998,000,000 5,516,000,000 3,749,000,000 10,121,000,000 3,998,000,000 5,516,000,000 3,749,000,000 1,049,000,000 3,998,000,000 5,516,000,000 3,749,000,000 1,049,000,000 3,998,000,000 5,516,000,000 3,749,000,000 9,072,000,000 0 5,819,000,000 6,103,000,000 6,830,000,000 7,874,000,000 5,819,000,000 6,103,000,000 6,830,000,000 7,874,000,000 34,102,000,000 28,905,000,000 32,676,000,000 36,000,000,000 34,102,000,000 28,905,000,000 32,676,000,000 36,000,000,000 6,280,000,000 8,744,000,000 9,351,000,000 10,027,000,000 104,165,000,000 117,642,000,000 114,806,000,000 110,697,000,000 76,073,000,000 77,810,000,000 72,850,000,000 67,249,000,000 76,073,000,000 77,810,000,000 72,850,000,000 67,249,000,000 76,073,000,000 72,242,000,000 66,662,000,000 59,578,000,000 5,568,000,000 6,188,000,000 7,671,000,000 531,000,000 541,000,000 233,000,000 204,000,000 531,000,000 541,000,000 233,000,000 204,000,000 10,377,000,000 3,815,000,000 4,530,000,000 3,180,000,000 10 277 000 010 000 118 An 4 En 9 100 000 000 - Ford Microsoft 1-44% Ready w 12:30 PM 9/27/2020 TH Type here to search H6 F 7 117 A 114 Long Term Debt 115 Capital Lease Obligations, Non-Current 116 Tax Liabilities, Non-Current Deferred Tax Liabilities, Non-Current 118 Deferred Liabilities, Non-Current 119 Deferred Income/Customer Advances/Billings in Excess of Cost, Non-Current 120 Payables and Accrued Expenses, Non-Current 121 Trade and Other Payables, Non-Current 122 Taxes Payable, Non-Current 123 Other Non-Current Liabilities 124 Total Equity 125 Equity Attributable to Parent Stockholders 126 Paid in Capital 127 Capital Stock 128 Common Stock 129 Common Stock, with Par Value 130 Retained Earnings/Accumulated Deficit 131 Reserves/Accumulated Comprehensive Income/Losses 132 Common Shares Issued 133 Common Shares Outstanding 134 Fiscal year ends in Jun 30 SD 12 B 76,073,000,000 72,242,000,000 66,662,000,000 59,578,000,000 5,568,000,000 6,188,000,000 7,671,000,000 531,000,000 541,000,000 233,000,000 204,000,000 531,000,000 541,000,000 233,000,000 204,000,000 10,377,000,000 3,815,000,000 4,530,000,000 3,180,000,000 10,377,000,000 3,815,000,000 4,530,000,000 3,180,000,000 30,265,000,000 29,612,000,000 29,432,000,000 30,265,000,000 29,612,000,000 29,432,000,000 30,265,000,000 29,612,000,000 29,432,000,000 17,184,000,000 5,211,000,000 7,581,000,000 10,632,000,000 72,394,000,000 82,718,000,000 102,330,000,000 118,304,000,000 72,394,000,000' 82,718,000,000 102,330,000,000 118,304,000,000 69,315,000,000 71,223,000,000 78,520,000,000 80,552,000,000 69,315,000,000' 71,223,000,000 78,520,000,000 80,552,000,000 2,648,000,000 13,682,000,000 24,150,000,000 34,566,000,000 431,000,000 -2,187,000,000 -340,000,000' 3,186,000,000 7,708,000,000 7,677,000,000 7,643,000,000 7,571,000,000 7,708,000,000' 7,677,000,000 7,643,000,000' 7,571,000,000 G J N H Jun-17 K Jun-20 M Industry Jun-18 Jun-19 68.49 98.61 133.96 198.44 Stock Price EBITDA Total Debt Valuation Price Earnings N/A Use diluted earnings Market to Book N/A Use Basic shares (WASO) Enterprise / EBITDA Profitability Operating Margin N/A Net Profit Margin N/A Return on Equity Based on Net Income from Continuing Operations N/A Financial Strength Current Ratio N/A Book Debt-Equity N/A Arial - 10 AA Custom 2. AutoSum Wrap Text Morge & Center ME Insert Delete Format 27 Cut La Copy Format Painter Clipboard Pasto Ideas BIU ES - $%8-48 Sensitivity A- Conditional Format as Cell Formatting Table Styles Styles & Claar- Sort & Find & Filter Select F Font IS Alignment Number Cells Editing Ideas Sensitivity H6 f B D E F A 137 INSERT BELOW MSFT CASH FLOW STATEMENT AS ORIGINALLY STATED 138 Cash Flow from Operating Activities, Indirect 139 Net Cash Flow from Continuing Operating Activities, Indirect 140 Cash Generated from Operating Activities 141 Income/Loss before Non-Cash Adjustment 142 Total Adjustments for Non-Cash Items 143 Depreciation, Amortization and Depletion, Non-Cash Adjustment 144 Depreciation and Amortization, Non-Cash Adjustment 145 Stock-Based Compensation, Non-Cash Adjustment 146 Taxes, Non-Cash Adjustment 147 Net Investment income/Loss, Non-Cash Adjustment 148 Gain/Loss on Financial Instruments, Non-Cash Adjustment 149 Irregular Income/Loss, Non-Cash Adjustment 150 Impairment/Write Off/Write Down of Other Assets, Non-Cash Adjustment 151 Impairment of Goodwill, Non-Cash Adjustment 152 Gain/Loss on Disposals, Non-Cash Adjustment 153 Other Operating Gain/Loss, Non-Cash Adjustment 154 Excess Tax Benefit from Stock-Based Compensation, Non-Cash Adjustment 155 Other Non-Cash Items 156 Changes in Operating Capital 157 Change in Inventores 158 Change in Trade and Other Receivables 159 Change in Trade/Accounts Receivable 160 Change in Other Current Assets Channin Dausbles and Ameriad CwnANLAR .- Ford Microsoft 39,507,000,000 43,884,000,000 52,185,000,000 60,675,000,000 39,507,000,000 43,884,000,000 52,185,000,000 60,675,000,000 39,507,000,000 43,884,000,000 52,185,000,000 60,675,000,000 21,204,000,000 16,571,000,000 39,240,000,000 44,281,000,000 -51,060,000,000' 25,029,000,000 12,008,000,000' 14,246,000,000 8,778,000,000 10,261,000,000 11,682,000,000 12,796,000,000 8,778,000,000 10,261,000,000 11,682,000,000 12,796,000,000 3,266,000,000 3,940,000,000' 4,652,000,000' 5,289,000,000 -3,296,000,000 13,040,000,000 3,534,000,000 -3,620,000,000 -2,073,000,000 -2,212,000,000 -792,000,000 -219,000,000 -2,073,000,000 -2,212,000,000 -792,000,000 -219,000,000 0 0 0 0 -57,735,000,000 69,363,000,000 2,284,000,000 937,000,000 2,148,000,000 50,000,000 -465,000,000 597,000,000 168,000,000 -925,000,000 -3,862,000,000 -2,812,000,000 -2,577,000,000 -925,000,000 -3,862,000,000 -2,812,000,000 -2,577,000,000 1,066,000,000 -952,000,000 -1,718,000,000 -2,330,000,000 01 anno 1 110 000 000 201000000 161 Ready TH Type here to search O N 1231 PM 9/27/2020 Share Comments Lo scur Arial Custom AutoSum- cut Copy Paste Format Painter Clipboard 28 4 - 10 AA == 2 Wrap Test A.A. Merge & Center Alignem $ . % 83 Conditions Formatas Cell Formatting Table Styles Insert Delete Format Ideas Clear Sort Find Filter Select diting Font F Nimber B Styles Cells Sensitivity H6 F A 160 Change in Other Current Assets 161 Change in Payables and Accrued Expenses 162 Change in Trade and Other Payables 163 Change in Trade/Accounts Payable 164 Change in Deferred Assets/Liabilities 165 Change in Other Current Liabilities 166 Change in Other Operating Capital 167 Cash Flow from Investing Activities 168 Cash Flow from Continuing Investing Activities 169 Purchase/Sale and Disposal of Property, Plant and Equipment, Net 170 Purchase of Property, Plant and Equipment 171 Purchase/Sale of Business, Net 172 Purchase/Acquisition of Business 173 Purchase/Sale of Investments, Net 174 Purchase of Investments 175 Sale of Investments 176 Other Investing Cash Flow 177 Cash Flow from Financing Activities 178 Cash Flow from Continuing Financing Activities 179 Issuance of/Payments for Common Stock, Net 180 Proceeds from Issuailte of Common Stock 181 Payments for Common Stock 182 Issuance of/Repayments for Debt, Net 183 Issuance of/Repayments for Short Term Debt, Net Donante for chart Term Daht Ford Microsoft B C D E 1,066,000,000 -952,000,000 -1,718,000,000 -2,330,000,000 81,000,000 1,148,000,000 232,000,000 3,018,000,000 81,000,000 1,148,000,000 232,000,000 3,018,000,000 81,000,000 1,148,000,000 232,000,000 3,018,000,000 67,711,000,000 5,922,000,000' 4,462,000,000 4,462,000,000' 2,212,000,000 386,000,000 798,000,000 1,419,000,000 1,346,000,000 994,000,000 -305,000,000 -1,243,000,000 311,000,000 -46,781,000,000 -6,061,000,000 -15,773,000,000 -12,223,000,000 - 46,781,000,000 -6,061,000,000 -15,773,000,000 -12,223,000,000 -8,129,000,000 -11,632,000,000 -13,925,000,000 -15,441,000,000 -8,129,000,000 -11,632,000,000 -13,925,000,000 15,441,000,000 -25,944,000,000 -888,000,000 -2,388,000,000 -2,521,000,000 -25,944,000,000 -888,000,000 -2,388,000,000 -2,521,000,000 -12,511,000,000 6,557,000,000 540,000,000 6,980,000,000 -176,905,000,000 -137,380,000,000 57,697,000,000 -77,190,000,000 164,394,000,000 143,937,000,000 58,237,000,000 84,170,000,000 -197,000,000 -98,000,000 0 -1,241,000,000 8,408,000,000 -33,590,000,000 -36,887,000,000 -46,031,000,000 8,408,000,000 -33,590,000,000 -36,887,000,000 46,031,000,000 -11,016,000,000 -9,719,000,000 -18,401,000,000 -21,625,000,000 772,000,000 1,002,000,000 1,142,000,000 1,343,000,000 -11,788,000,000 -10,721,000,000 -19,543,000,000 -22,968,000,000 31,459,000,000 -10,201,000,000 -4,000,000,000 5,518,000,000 -4,963,000,000 -7,324,000,000 0 0 + 104 4 -- 1231 PM 9/27/2000 Ready Type here to search O n u v tv Merge 20 Formatting Serg Format Painter Clipboard F Table Styles Styles F Cuis Sensitivity diting Number Alignment Font H6 B D E 36,422,000,000 2,877,000,000 4,000,000,000 -5,518,000,000 44,344,000,000 7,183,000,000 0 0 0 -7,922,000,000 -10,060,000,000 -4,000,000,000 -5,518,000,000 -3,417,000,000 -3,417,000,000 -11,845,000,000 -12,699,000,000 13,811,000,000 15,137,000,000 -11,845,000,000 12,699,000,000 -13,811,000,000 -15,137,000,000 -11,845,000,000 12,699,000,000 -13,811,000,000 15,137,000,000 -190,000,000 -971,000,000 -675,000,000 -334,000,000 7 A 186 Issuance of/Repayments for Long Term Debt, Net 187 Proceeds from Issuance of Long Term Debt 188 Repayments for Long Term Debt 189 Issue and Financing Costs 190 Debt Issuance Costs 191 Cash Dividends and Interest Paid 192 Cash Dividends Paid 193 Common Stock Dividends Paid 194 Other Financing Cash Flow 195 Excess Tax Benefit from Share-Based Compensation, Financing Activities 196 Cash and Cash Equivalents, End of Period 197 Change in Cash 198 Effect of Exchange Rate Changes 199 Cash and Cash Equivalents, Beginning of Period 200 Change in Cash As Reported, Supplemental 201 Total Net Change in Cash 202 Fiscal year ends in Jun 30 USD 203 204 205 206 7,663,000,000' ' 11,946,000,000 11,356,000,000 13,576,000,000 1,134,000,000 4,233,000,000 -475,000,000 2,421,000,000 19,000,000 50,000,000 -115,000,000 -201,000,000 6,510,000,000 7,663,000,000' 11,946,000,000 11,356,000,000 1,153,000,000 4,283,000,000 -590,000,000' 2,220,000,000 17 18 NA Operating Margin N/A Net Profit Margin 19 20 Based on Net Income from Continuing Operations 21 Return on Equity 22 23 24 Financial Strength Current Ratio NA 25 N/A Book Debt-Equity 26 27 28 Mkt Debt-Equity 29 N/A Interest Coverage 30 31 Enterprise Value 33 Clipboard Number Font Alignment H6 F + INSERT BELOW MSFT INCOME STATEMENT AS ORIGINALLY STATED 2 Gross Profit 3 Total Revence 4 Business Revenue 5 Cost of Revenue 6 Cost of Goods and Services 7 Operating Income/Expenses B Selling, General and Administrative Expenses 9 General and Administrative Expenses 10 Selling and Marketing Lupenses Research and Development Expenses 12 Total Operating profit/Loss 13 Non-Operating Income/Expenses. Total Total Net Finance Income/Expense 15 Net Interest Income/Expense 10 Interest Expense Net of Capitalized Interest 17 Interest income 18 Net invest income B E 2017 2010 2019 2020 55,689,000,000 72,007,000,000 82.933,000,000 96,937,000,000 89,950,000,000 110,360,000,000 125.843,000,000 143,015,000,000 89.950,000,000 110,360,000,000 125.843,000,000 143,015,000,000 -34,261,000,000 -38,353,000,000 -17,910,000,000 46,078,000,000 -34,261,000,000 -38,359,000,000 -42,910,000,000 46,078,000,000 33,057,000,000 36,949,000,000 -39,974,000,000 43,978,000,000 -20.020,000,000 22.223,000,000 23,098,000,000 -24,709,000,000 4,481,000,000 4,754,000,000 -4,885,000,000 5.111,000,000 -15,539,000,000 -17,469,000,000 18,213,000,000 19,598,000,000 - 13,037,000,000 -14.726,000,000 16,876,000,000 -19,269,000,000 22.632,000,000 35,058,000,000 42.959,000,000 52.959,000,000 517,000,000 1.416,000,000 729,000,000 77,000,000 -2.222,000,000 -2,733,000,000 -2,686,000,000 2,591,000,000 -2,222,000,000 -2,733,000,000 -2,686,000,000 -2,591,000,000 -2,222,000,000 2,733,000,000 -2,686,000,000 2,591,000,00 3,296,000,000 4.200.000.000 3,472,000,000 2,708,000,000 19 20 Dividend and Investment income Gain/Loss on Investments and Other Financial Instruments 1,387,000,000 2,214,000,000 2.583,000,000 2,399,000,000 2,762,000,000 648,000,000 2,680,000,000 32,000,000 -154.000.000 -164,000,000 -510,000,000 251,000,000 306,000,000 -306,000,000 218,000,000 -218,000,000 -187,000,000 59,000,000 -82,000,000 -82,000,000 144,000,000 -57,000,000 0 D -191,000,000 -191,000,000 187.000.000 40,000,000 21 Gain/Loss on Foreign Exchange 22 Unrealized Gain/Loss on Foreign Dicha 23 Gain/Loss on Derivatives 24 Other Incame/Expense, Non-Operating Irregular income/Expenses Restructuring and Reorganization Income/Expense 2T Goodwill Impairment/Write Off 28 Pretak Income 29 Provision for Income Tax 30 Net Income from Continuing Operations 3 Net Income after Extraordinary items and Discontinued Operations 32 Net Income after Non Controlling/Minority Interests 33. Net Income wailable to Common Stockholders 36 Diluted Net Income kvailable to Common Stockholders as Reported Total Revenue 36 Reported Total Operating Profit/Loss 37 Reported Normalized Income 38 Reported Effective Tax Rate 30 Reported Normalized Operating Profit 40 Reported Operating pense 41 Basic EPS 42 Duted EPS 43 Basic WASO 44 Diluted WASO 45 scal year ends in 30 USD 46 Ford Microsoft + Ready 23,149,000,000 36,474,000,000 42,688,000,000 53,036,000,000 -1.945,000,000 19,903,000,000 -4,448,000,000 -8,755,000,000 21.204.000.000 16.571.000.000 39.240,000,000 44,281,000,000 21,204,000,000 16.571.000.000 39.240,000,000 44,281,000,000 21,204.000.000 16.571,000,000 39.240.000.000 $4,281,000,000 21,204.000.000 16.571.000,000' 39,240.000.000 41,281,000,000 21,204,000,000 16,571,000,000 39.240.000 44,281,000,000 89,950,000,000 110.360,000,000 125,543,000.000 143,015,000,000 22,326,000,000 35,058,000,000 42.959,000,000 52,959,000,000 30.267,000,000 $10,000,000 44,281,000,000 D 35.654,000,000 47,59,000,000 52,959.000.000 2.741 2.71 7,746,00,000 7.833,000,000 2.15 5.11 5.82 2.13 5.06 3,700,000,000 7,673,000,000 7,610,000,000 7.794.000.000 7.75,000,000 7,683,000,000 ol E 1 Format Painter - - - Clipboard Font Alignment Numb H6 fr D 241,086,000,000 258,848,000,000 786,556,000,000 101,311,000,000 159,85 1,000,000 169,662,000,000 175,557,000,000 181.915,000,000 132,981,000,000 133,768,000,000 133,819,000,000 136,577,000,000 7,663,000,000 11,946,000,000 11,356,000,000 13,576,000,000 125,318,000,000 121,822,000,000 122,463,000,000 122,951,000,000 2,181,000,000 2,662,000,000 2,063,000,000 1,895,000,000 797,000,000 655,000,000 399,000,000 700,000,000 145,000,000 54,000,000 53,000,000 83,000,000 1,239,000,000 1,953,000,000 1,611,000,000 1,112,000,000 19,792,000,000 26,481,000,000 29,524,000,000 12,011,000,000 19,797,000,000 26,481,000,000 29,524,000,000 92,011,000,000 20,197,000,000 26,858,000,000 29,935.000.000 32.799,000,000 -405,000,000 -377,000,000 -411,000,000 -78,000,000 4,897,000,000 6,751,000,000 10,145,000,000 11,482,000,000 29 INSERT BELOW MSFT BALANCE SHEET AS ORIGINALLY STATED 50 Total Assets 51 Total Current Assets 52 Cash, Cash Equivalents and Short Term Investments 53 Cash and Cash Equivalents Short Term Investments 55 Inventories 56 Raw Materials, Consumables and Supplies 57 Work-in-Process 58 Finished Goods and Merchandise 59 Trade and Other Receivables, Current 60 Trade/Accounts Receivable, Current 67 Gross Trade/Accounts Receivable, Current 62 Allowance/Adjustments for Trade/Accounts Receivable, Current 63 Other Current Assets 64 Deferred Tax Assets, Current 65 Deferred Costs/Assets, Current Total Non-Current Assets 67 Net Property, plant and Equipment Gross Property, Plant and Equipment 69 Properties 70 Land and improvements 71 Buildings and improvements 72 Leasehold and improvements T3 Machinery, Furniture and Equipment 74 Furniture, Fixtures and Office Equipment 75 leased Properly. Plant and ment 76 Accumulated Depreciation and impairment Accumulated Depreciation 78 Net intangible Assets Grass Goodwill and Other Intangible Assets BO Goodwill Intangibles other than Goodwill 82 Software and Technology B3 Customer Relationships Other intangible Assets 85 Accumulated Amortization and impairment Accumulated Amortization of Intangible Assets 87 Accumulated Amortization of Intangibles other than Goodwill Accumulated Amortization of Software and Technology 09 Accumulated Amortization of Customer Relationships 30 Acumulated Amortization of other intangible Assets 91 Total Long Term Investments Long Term Equity Investments Other Nos Current Assets $4 Total abilities Total Current Liabilities Payables and Accrued Expenses, Current Trade and Other Payables, Current se Trade/Accounts Payable, Current Ford Microsoft 81,235,000,000 89,186,000,000 111,004,000,000 119,396,000,000 23,734,000,000 36,146,000,000 43,856.000.000 52.904,000,000 47.913,000,000 65,369,000,000 79,185,000,000 96,101,000,000 22,455,000,000 26,593,000,000 33,144,000,000 41,305.000.000 1,107,000,000 1,754,000,000 1,540,000,000 1,823,000,000 16,284,000,000 20,60,000,000 26,2R8,000,000 33.995,000,000 5,064,000,000 4,735,000,000 5.316,000,000 5,487.000.000 25,458,000,000 32,090,000,000 38,663,000,000 46,042,000,000 25,458,000,000 32,090,000,000 38,663,000,000 46,043,000,000 6,686,000,000 7,379,000,000 8,753,000,000 24,179,000,000 -29.223,000,000 35,330,000,000 43,197,000,000 24.179,000,000 -29.223,000,000 35,330,000,000 -43,197,000,000 45,228,000,000 43,736,000,000 49.776.000.000 50,389,000,000 51,789,000,000 51,619,000,0 59,165,000,000 61,110,000,000 35,122,000,000 35,663,000,000 42,026,000,000 43,35 1,000,000 16,667,000,000 15.936.000,000 17,139,000,000 17,759,000,000 7,765,000,000 7,220,000,000 7,691,000,000 8.160,000,000 4,886,000000 4,685,000,000 4,739,000,000 5,441,000,000 4,016,000,000 4,031,000,000 4,709,000,000 4,158,000,000 -6,561.000.000 7.881,000,000,000,000 10,721,000,000 -6,561,000,000 -7,882,000,000 -9,289,000,000 -10,721,000,000 -6,561.000.000 7,883,000,000 -9,389,000,000 -10,721,000,000 -4,318,000,000 5,018,000,000 5,771,000,000 -6,381,000,000 -1.414,000,000 1,660,000,000 1,833.000.000 2,752,000,000 -829,000,000 1,205.000.000 1.785,000,000 1,589.000.000 6,023.20.000 1.862,000,000 2.649,000,000 2,965.000.000 6,250,000,000 7,442,000,000 14,723,000,000 13,138,000,000 168,692,000,000 176.130,000,000 184.226,000,000 183.000.000.000 64.527.000,000 58.480,000.00 60.410,000,000 72,310,000,000 8,205,000,000 10,738,000,000 15,017,000,000 14,660,000,000 8,205,000,000 10,738,000,000 15,047.000.000 14,660,000,000 2,890,000,000 8,617.000,00 1.382.000.000 1250,000,000 Type here to search 3 HD F 97 Trade and Other Payables. Current 98 Trade/Accounts Payable, Current 99 Taxes Payable, Current 100 Other Payable, Current 101 Financial abilities, Current 102 Current Debt and Capital Lease Obligation 103 Current Portion of Long Term Debt and Capital Lease 104 Current Portion of Long Term Debt 105 Current Der 106 Previsions, Current 107 Provision for Employee Entitlements, Current 108 Deferred Liabilities, Current 109 Deferred Income/Customer Advances/Billings in Excess of Cost, Current 110 Other Current Liabilities 111 Total Non.Current Liabilities 112 Anancial Liabilities, Non-Current 113 Long Term Debt and Capital Lease Obligation 114 Long Term Debt -15 Capital Lease Obligations, Non-Current 116 Tax Liabilities, Non-Current Deferred Tax liabilities, Non-Current 115 Deferred Liabinies, Non-Current 199 Deferred Income/Customer Advances/Billings in Excess of Cost, Non Current 120 Payables and Accrued Expenses, Non-Current 121 Trade and Other Payables, Non-Current 122 Taxes Payable, Non-Ourrent 123 Other Non-Current Liabilities 124 Total Equity Equity Antributable to Parent Stockholders 126 Paid in Capital 127 Capital Stock 128 Common Stock Common Mock, with Par Value Retained Earnings/Accumulated Defick Reser/Accumulated Comprehensive Income Losses 132 Common Shares issued Common Shoes Outstanding 14 Fiscal year ends in jun 30 USD 15 B 8.205,000,000 10,738,000,000 15,047,000,000 14,660,000,000 7,390,000,000' 8,617,000,000' 9,382,000,000 12,530,000,000 718,000,000 2,121,000,000 5,665,000,000 2,130,000,000 97,000,000 10,121,000,000 3,998,000,000' 5,516,000,000' 9.749,000,000 10,121,000,000 3,998,000,000 5,516,000,000 3,749,000,000 1,049,000,000 3,998,000,000 5,516,000,000 3,749,000,000 1,049,000,000 3.998,000,000 5,516,000,000 3.749,000,000 9,072,000,000 0 5.819,000,000 6,103,000,000 6,830,000,000 7.874,000,000 5.819,000,000 6,103,000,000 6.830,000,000 7,874,000,000 34,102,000,000 29,905,000,000 32,676,000,000 36,000,000,000 34,102.000,000' 28,905,000,000 32,676,000,000 36,000,000,000 6,280.000,000 8,744,000,000' 9,351.000.000 10,027,000,000 104,165,000,000 117,642.000.000 114,806,000,000 110,697,000,000 76,073,000,000' 77,810.000.000 73,850,000,000 67.249.000.000 76,075,000,000' 77,810.000.000 72,850,000,000 67,249,000,000 76,073,000,000 72,242,000,000 66,662,000,000 59,578,000,000 5,568,000,000 6,188,000,000 7,671,000,000 531,000,000 541,000,000 233,000,000 204,000,000 531,000,000 541,000,000 233,000,000 204.000.000 10,877,000,000 3,815,000,000 4,530,000,000 3.180.000.000 10.377,000,000 3,815,000,000 4,530,000,000 3,150,000,000 30,265,000,000 29,612,000,000 29,432,000,000 30,265,000,000 29,612,000,000 29,432.000.000 30.265,000,000 29,612,000,000 29,432,000,000 17,184,000,000 5.211,000,000 7,581,000,000 10,632.000.000 72,394,000,000 82.715,000,000 102,330.000.000 118,304,000,000 72,394,000,000 82,715,000,000 102.330,000,000 118.304,000,000 69,315,000,000 71.223,000,000 78,520.000.000 0.552.000.000 69.315.000.000 71.225.000.000 78,520,000.00' NO.552,000,000 2,648,000,000 13,682,000,000 24,150,000,000 $4,566.000.000 431,000,000 2,1870,000 340,000,000 3,186,000,000 7.704,000,000 7,677,000,000 7,643,000,000 7,571,000,000 7.705.00CLOCO 7.677,000,000 7,642.000,000 7.571.000.000 Y STATE Clipboard Font H6 D 137 INSERT BELOW MSFT CASH FLOW STATEMENT AS ORIGINALLY STATED 138 Cash Flow from Operating Activities, Indirect 39,507,000,000 43,884,000,000' 52.185.000.000 60,675,000,000 139 Net Cash Flow from Continuing Operating Activities, Indirect 39,507,000,000 43,884,000,000' 52.185,000,000 60,675,000,000 140 Cash Generated from Operating Activities 39.507,000,000 45,81,000,000' 52.185,000,000 60,675,000,000 141 Income/Loss before Non-Cash Adjustment 21.204,000,000 16,571,000,000 39.200,000,000 44,2R1,000,000 Total Adjustments for Non-Cash Items -51,000,000,000' 25,029,000,000 12,000,000,000 14,206,000,000 143 Depreciation, Amortization and Depletion, Non-Cash Adjustment 1,77.000,000' 10,261,000,000 1167.000.000 12.796.000,000 144 Depreciation and Amortization, Non Cash Adjustment 8,778,000,000' 10.261,000,000 11.682,000,000 12.796.000.000 1:45 Stock-Based Compensation, Non-Cash Adjustment 3,266,000,000 3,900,000,000' 4,652,000,000 5.289.000,000 Taxes, Non-Cash Adjustment 3,296,000,000' 19,000,000,000' 3.534,000,000 -3,620,000,000 147 Net Investment Income/lass, Non-Cash Adjustment -2,073,000,000 2,212,000,000 792,000,000 -219,000,000 14B Gainless on Financial Instruments, Non Cash Adjustment -2,073,000,000 -2,212,000,000 -792.000.000 219,000,000 149 Irregular Income/Loss, Non Cash Adjustment 0 150 Impairment/Write Off/Write Down of Other Assets, Non-Cash Adjustmen 0 151 Impalment of Goodwill, Non Cash Adjustment 0 152 Gain/Loss on Disposals, Non-Cash Adjustment 153 Other Operating Gain/Loss, Non-Cash Adjustment -57,735,000,000 154 Excess Tax Benefit from Stock-Based Compensation, Non-Cash Adjustment 155 Other Non-Cash Items 156 Changes in Operating Capital 60,363,000,000 2,284,000,000 937,000,000 2.148,000,000 157 Change in Inventories 50,000,000 465,000,000 597,000,000 168,000,000 158 Change in Trade and Other Receivables -925,000,000 -3,862,000,000 -2,812,000,000 -2,577,000,000 159 Change in Trade/Accounts Receivable -925,000,000 3,862,000,000 2,812,000,000 -2,577,000,000 160 Change in Other Current Assets 1,066,000,000 -952,000,000 -1,718,000,000 -2.330,000,000 165 Change in Payables and conued Expenses 81,000,000 1,148,000,000 232,000,000 3.018,000,000 162 Change in Trade and Other Payables 81,000,000 1,148,000,000 232,000,000 3.012,000,000 163 Change in Trade/Accounts Payable 81,000000 1,148,000,000 232,000,000 3.018,000,000 164 Change in Deferred Assets/Uabilities 67,711,000,000' 5,922,000,000 4462,000,000 2.212,000,000 165 Change in Other Current Liabilities 386.000.000 798,000,000 1,419,000,000 1,346,000,000 164 Change in Other Operating Capital 990,000,000 305,000,000 -1,243,000,000 311.000.000 167 Cash Flow from investing Activities 46.781,000,000 6,061,000,000 -15,773.000.000 12.224.000.000 168 Cash Flow from Continuing Investing Activities 46,781,000,000 -6,061,000,000 -15,773,000,000 12,223,000,000 Purchase/Sale and Disposal of Property. Plant and Equipment, Net -8,129,000,000 11.632,000.000 13,925.000,000 15,441.000.000 170 Purchase of Property. Plant and Equipment -8,129,000,000 11,632,000,000 13,925,000,000 15,441,000,000 Purchase/Sale of Business, Net -25.944,000,000 NR.000.000 -2.388,000,000 0 2,521,000,000 172 Purchase/Acquisition of Business -25.214,000,000 NR.000,000 2,188,000,000 2,521,000,000 173 Purchase/sale of Investments, Net -12.511,000,000 6,557,000,000 540,000,000 600,000,000 Purchase of imments 176,905,000,000 137,380,000,000 57.697,000,000 77,190,000,000 125 Sale of Investments 161,294.000.000 143,037,000,000 5,237,000,000 $4,170,000,000 176 -197.000,000 Other Investing Cash Flow 9,000,000 0 1,241,000,000 177 Cash flow from Financing Activities 8,408,000 33,590,000,000 36,887,000,000 46,041,000,000 Cash Flow from Continuing Financing Activities 8.400,000 31,800,000,000 36,667.000.000 46,011.000,00 179 Issuance of Payments for Common Stock.Net 11.016, 00, 000 9,719,000,000 1,401.000.000 1.625,000,000 Proceeds from Issuance of Commons Work 772,000,000 1,002.000.000 1.142,000,000 100 Payments for Common Stock 11,786 OKIDO 10,721.000.000 19,541,000,000 12.968,00,00 Issuance of Repayments for Delt, Net 31,450.000.000 10.2010.0" 4,000,000,000 RON isance of payments for Short Term Debt, Net 7.124.000.000 + 36 A120,000 2.877.000.000 41.000 1.000 Proceeds from suance Short Term Dutt Issuance of the payments for og Term Delt, het Ford Microsoft O Type here to search F 31,459,000,000 -10,201,000,000 4,000,000,000 -4.963,000,000 7,324,000,000 -5,518,000.00 0 36,422,000,000 2,877,000,000 4,000,000,000 -5,518,000,000 44,344,000,000 7,180,000,000 0" 0 -7,922,000,000 10,060,000,000 -4,000,000,000 5,518,000,000 -3,417,000,000 -3.417,000,000 -11,845,000,000 12.699,000,000 -13,811,000,000 15,137,000,000 11,845,000,000 -12.699,000,000 - 13,811,000,000 15,137,000,000 - 11.845,000,000 17,609,000,000 13,811,000,000 -15,137,000,000 190,000,000 -971,000,000 -675,000,000 -334,000,000 A 102 Issuance of/Repayments for Debt, Net 183 Issuance of/Repayments for Short Term Debt, Net 134 Repayments for Short Term Debt Proceeds from Issuance of Short Term Debt 186 Issuance of/Repayments for Long Term Debt. Net 1BT Proceeds from Issuance of Long Term Debt 1BB Repayments for Long Term Debt 189 Issue and Financing Costs 190 Debt Issuance Costs 191 Cash Dividends and interest Paid 192 Cash Dividends Paid 193 Common Stock Dividends Paid 194 Other Financing Cash Flow 195 Excess Tax Benefit from Share-Based Compensation Financing Activities 196 Cash and Cash Equivalents, End of Period 197 Change in Cash 198 Effect of Exchange Rate Changes 199 Cash and Cash Equivalents, Beginning of Period 200 Change in Cash As Reported, Supplemental 201 Total Net Change in Cash 202. Fiscal year ends in jun 30 USD 203 2014 205 205 207 200 209 210 211 1212 7,663,000,000 11,946,000,000 11,356,000,000 13,576,000,000 1.134,000,000 4,233,000,000 475,000,000 2,421,000,000 19,000,000 50,000,000 115,000,000 201,000,000 6,510,000,000 7,663,000,000 11,946,000,000 11,356,000,000 1,153,000,000 4,283,000,000 -590,000,000 2,220,000,000 F Rabos 04 Industry Lin-17 Jun 18 Jun-19 Jun 20 68.40 98.61 133.95 19844 Stock Price EBITDA Total Debt 1 Valuapon Price Camings NA Use diluted earings NW Markello Back Use Basic shares (WASOJ > Enterprise EBITDA 3 Profitability Operating Margin NA 0 NIA Net Proft Margin + Based on Nut Incone from Continuing Opermin NA 0 Return on Equity Financial Strength Current Ralo Book Debt Egaly 30 Mk Debt-Equity NA Interest Coverage 30 30 0 Enterprise Value 00 Question 4 capitalization at each date, multiply the number of shares outstanding by the firm's historic stock price. You can find the + number of shares by using "Basic" under "Weighted average shares outstanding at the bottom of the Income Statement 3. For each of the four years of statements, compute the following ratios for each firm: Valuation Ratios Price earnings ratio (for EPS use diluted EPS total) Market-to-book ratio Enterprise value-to-EBITDA (For debt, include long-term and short-term debt: for cash, include marketable securities.) Profitability Ratios Operating margin Net profit margin Return on equity Financial Strength Ratios Current ratio Book debt equity ratio Market debt-equity ratio Interest coverage ratio (EBIT interest expense) 4. Obtain industry averages for each firm from Routers (www.reuters.com/finance/stocks). Enter the stock symbol at the top of the page in the "Symbol lookup" and then click the "Financials" button, and then click "Search." a. Scroll down to "Valuation Ratios,' and compare each firm's ratios to the available industry ratios for the most recent var lengre the "Company column as your calculations will be different.) trends in each individual firm's Y UTULED File Home home Insert Draw Page Layout Formulas Data Review View Help Search Share Xcut LO Da Copy - Arial - 10 - A A SEE a Wrap Text Custom AutoSum Paste BIU Merge & Center $ %) 68-28 Insert Delete Format Ideas Format Painter Conditional Format as Cell Formatting Table Styles Styles Clear Sort & Find & Filter Select Clipboard 5 Font Alignment Number 15 Cells Editing Ideas H6 X f D E F A 1 INSERT BELOW MSFT INCOME STATEMENT AS ORIGINALLY STATED 2 Gross Profit 3 Total Revenue 4 Business Revenue 5 Cost of Revenue 6 Cost of Goods and Services 7 Operating Income/Expenses 8 Selling, General and Administrative Expenses 9 General and Administrative Expenses 10 Selling and Marketing Expenses 11 Research and Development Expenses 12 Total Operating Profit/Loss 13 Non-Operating Income/Expenses, Total 14 Total Net Finance Income/Expense 15 Net Interest Income/Expense 16 Interest Expense Net of Capitalized Interest 17 Interest Income 18 Net Investment Income
Step by Step Solution
There are 3 Steps involved in it
Step: 1

Get Instant Access to Expert-Tailored Solutions
See step-by-step solutions with expert insights and AI powered tools for academic success
Step: 2

Step: 3
Ace Your Homework with AI
Get the answers you need in no time with our AI-driven, step-by-step assistance
Get Started
Optimization Methods In Finance
Authors: Gérard Cornuéjols, Javier Peña, Reha Tütüncü
2nd Edition
1107056748, 9781107056749