Question
I need help finding the ratios I have not found yet. I have an idea what to do, but then I run into a part
I need help finding the ratios I have not found yet. I have an idea what to do, but then I run into a part I have no clue where to start.
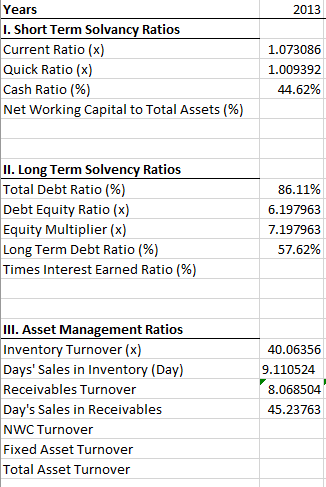
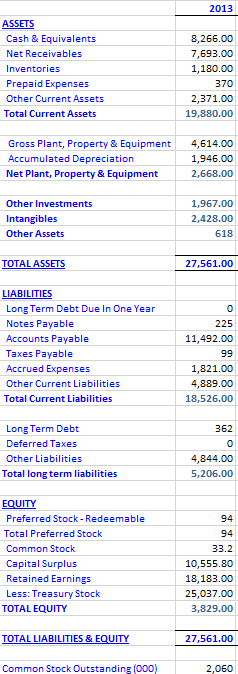
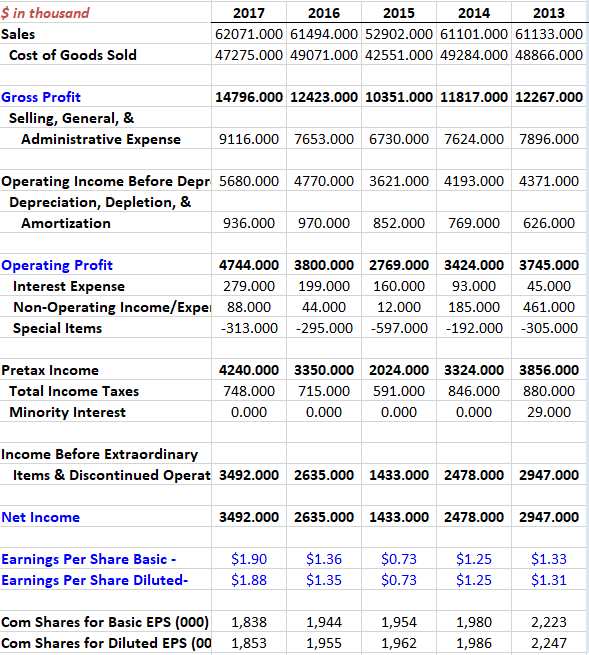
Listed below is the following in order: The ratios I need to find, the balance sheet, then the income statement. Honestly, if you could write down the equations instead, it would be much easier for me.
In case this is confusing, I need Net Working Capital To Total Assets, Times Interest Earned Ratio, NWC Turnover, Fixed Asset Turnover, Total Asset Turnover, and the final 4 underneath the first picture.


The balance sheet:

Then the income statement:

I feel like I just need the equations for these and I can do the rest. Also, I only need the year 2013 completed.
Thank you in advance!!!
2013 Years I. Short Term Solvancy Ratios Current Ratio (x) Quick Ratio (x) Cash Ratio (%) Net Working Capital to Total Assets (%) 1.073086 1.009392 44.62% II. Long Term Solvency Ratios Total Debt Ratio (%) Debt Equity Ratio (x) Equity Multiplier (x) Long Term Debt Ratio (%) Times Interest Earned Ratio (%) 86.11% 6.197963 7.197963 57.62% III. Asset Management Ratios Inventory Turnover (x) Days' Sales in Inventory (Day) Receivables Turnover Day's Sales in Receivables NWC Turnover Fixed Asset Turnover Total Asset Turnover 40.06356 9.110524 8.068504 45.23763 Dividend Per Share Dividend Payout Ratio Price Earning Ratio (x) Market-to-Book Ratio (x) 2013 ASSETS Cash & Equivalents Net Receivables Inventories Prepaid Expenses Other Current Assets Total Current Assets 8,266.00 7,693.00 1,180.00 370 2,371.00 19,880.00 Gross Plant, Property & Equipment Accumulated Depreciation Net Plant, Property & Equipment 4,614.00 1,946.00 2,668.00 Other Investments Intangibles Other Assets 1,967.00 2,428.00 618 TOTAL ASSETS 27,561.00 LIABILITIES Long Term Debt Due In One Year Notes Payable Accounts Payable Taxes Payable Accrued Expenses Other Current Liabilities Total Current Liabilities 225 11,492.00 99 1,821.00 4,889.00 18,526.00 362 0 Long Term Debt Deferred Taxes Other Liabilities Total long term liabilities 4,844.00 5,206.00 EQUITY Preferred Stock - Redeemable Total Preferred Stock Common Stock Capital Surplus Retained Earnings Less: Treasury Stock TOTAL EQUITY 94 94 33.2 10,555.80 18,183.00 25,037.00 3,829.00 TOTAL LIABILITIES & EQUITY 27,561.00 Common Stock Outstanding (000) 2,060 $ in thousand Sales Cost of Goods Sold 2017 2016 2015 2014 2013 62071.000 61494.000 52902.000 61101.000 61133.000 47275.000 49071.000 42551.000 49284.000 48866.000 14796.000 12423.000 10351.000 11817.000 12267.000 Gross Profit Selling, General, & Administrative Expense 9116.000 7653.000 6730.000 7624.000 7896.000 Operating Income Before Depr 5680.000 4770.000 3621.000 4193.000 4371.000 Depreciation, Depletion, & Amortization 936.000 970.000 852.000 769.000 626.000 Operating Profit 4744.000 3800.000 2769.000 3424.000 3745.000 Interest Expense 279.000 199.000 160.000 93.000 45.000 Non-Operating Income/Expei 88.000 44.000 12.000 185.000 461.000 Special Items -313.000 -295.000 -597.000 -192.000 -305.000 Pretax Income Total Income Taxes Minority Interest 4240.000 3350.000 2024.000 3324.000 3856.000 748.000 715.000 591.000 846.000 880.000 0.000 0.000 0.000 0.000 29.000 Income Before Extraordinary Items & Discontinued Operat 3492.000 2635.000 1433.000 2478.000 2947.000 Net Income 3492.000 2635.000 1433.000 2478.000 2947.000 Earnings Per Share Basic - Earnings Per Share Diluted- $1.90 $1.88 $1.36 $1.35 $0.73 $0.73 $1.25 $1.25 $1.33 $1.31 Com Shares for Basic EPS (000) 1,838 Com Shares for Diluted EPS (00 1,853 1,944 1,955 1,954 1,962 1,980 1,986 2,223 2,247 2013 Years I. Short Term Solvancy Ratios Current Ratio (x) Quick Ratio (x) Cash Ratio (%) Net Working Capital to Total Assets (%) 1.073086 1.009392 44.62% II. Long Term Solvency Ratios Total Debt Ratio (%) Debt Equity Ratio (x) Equity Multiplier (x) Long Term Debt Ratio (%) Times Interest Earned Ratio (%) 86.11% 6.197963 7.197963 57.62% III. Asset Management Ratios Inventory Turnover (x) Days' Sales in Inventory (Day) Receivables Turnover Day's Sales in Receivables NWC Turnover Fixed Asset Turnover Total Asset Turnover 40.06356 9.110524 8.068504 45.23763 Dividend Per Share Dividend Payout Ratio Price Earning Ratio (x) Market-to-Book Ratio (x) 2013 ASSETS Cash & Equivalents Net Receivables Inventories Prepaid Expenses Other Current Assets Total Current Assets 8,266.00 7,693.00 1,180.00 370 2,371.00 19,880.00 Gross Plant, Property & Equipment Accumulated Depreciation Net Plant, Property & Equipment 4,614.00 1,946.00 2,668.00 Other Investments Intangibles Other Assets 1,967.00 2,428.00 618 TOTAL ASSETS 27,561.00 LIABILITIES Long Term Debt Due In One Year Notes Payable Accounts Payable Taxes Payable Accrued Expenses Other Current Liabilities Total Current Liabilities 225 11,492.00 99 1,821.00 4,889.00 18,526.00 362 0 Long Term Debt Deferred Taxes Other Liabilities Total long term liabilities 4,844.00 5,206.00 EQUITY Preferred Stock - Redeemable Total Preferred Stock Common Stock Capital Surplus Retained Earnings Less: Treasury Stock TOTAL EQUITY 94 94 33.2 10,555.80 18,183.00 25,037.00 3,829.00 TOTAL LIABILITIES & EQUITY 27,561.00 Common Stock Outstanding (000) 2,060 $ in thousand Sales Cost of Goods Sold 2017 2016 2015 2014 2013 62071.000 61494.000 52902.000 61101.000 61133.000 47275.000 49071.000 42551.000 49284.000 48866.000 14796.000 12423.000 10351.000 11817.000 12267.000 Gross Profit Selling, General, & Administrative Expense 9116.000 7653.000 6730.000 7624.000 7896.000 Operating Income Before Depr 5680.000 4770.000 3621.000 4193.000 4371.000 Depreciation, Depletion, & Amortization 936.000 970.000 852.000 769.000 626.000 Operating Profit 4744.000 3800.000 2769.000 3424.000 3745.000 Interest Expense 279.000 199.000 160.000 93.000 45.000 Non-Operating Income/Expei 88.000 44.000 12.000 185.000 461.000 Special Items -313.000 -295.000 -597.000 -192.000 -305.000 Pretax Income Total Income Taxes Minority Interest 4240.000 3350.000 2024.000 3324.000 3856.000 748.000 715.000 591.000 846.000 880.000 0.000 0.000 0.000 0.000 29.000 Income Before Extraordinary Items & Discontinued Operat 3492.000 2635.000 1433.000 2478.000 2947.000 Net Income 3492.000 2635.000 1433.000 2478.000 2947.000 Earnings Per Share Basic - Earnings Per Share Diluted- $1.90 $1.88 $1.36 $1.35 $0.73 $0.73 $1.25 $1.25 $1.33 $1.31 Com Shares for Basic EPS (000) 1,838 Com Shares for Diluted EPS (00 1,853 1,944 1,955 1,954 1,962 1,980 1,986 2,223 2,247Step by Step Solution
There are 3 Steps involved in it
Step: 1

Get Instant Access to Expert-Tailored Solutions
See step-by-step solutions with expert insights and AI powered tools for academic success
Step: 2

Step: 3

Ace Your Homework with AI
Get the answers you need in no time with our AI-driven, step-by-step assistance
Get Started


