Answered step by step
Verified Expert Solution
Link Copied!

Question

1 Approved Answer

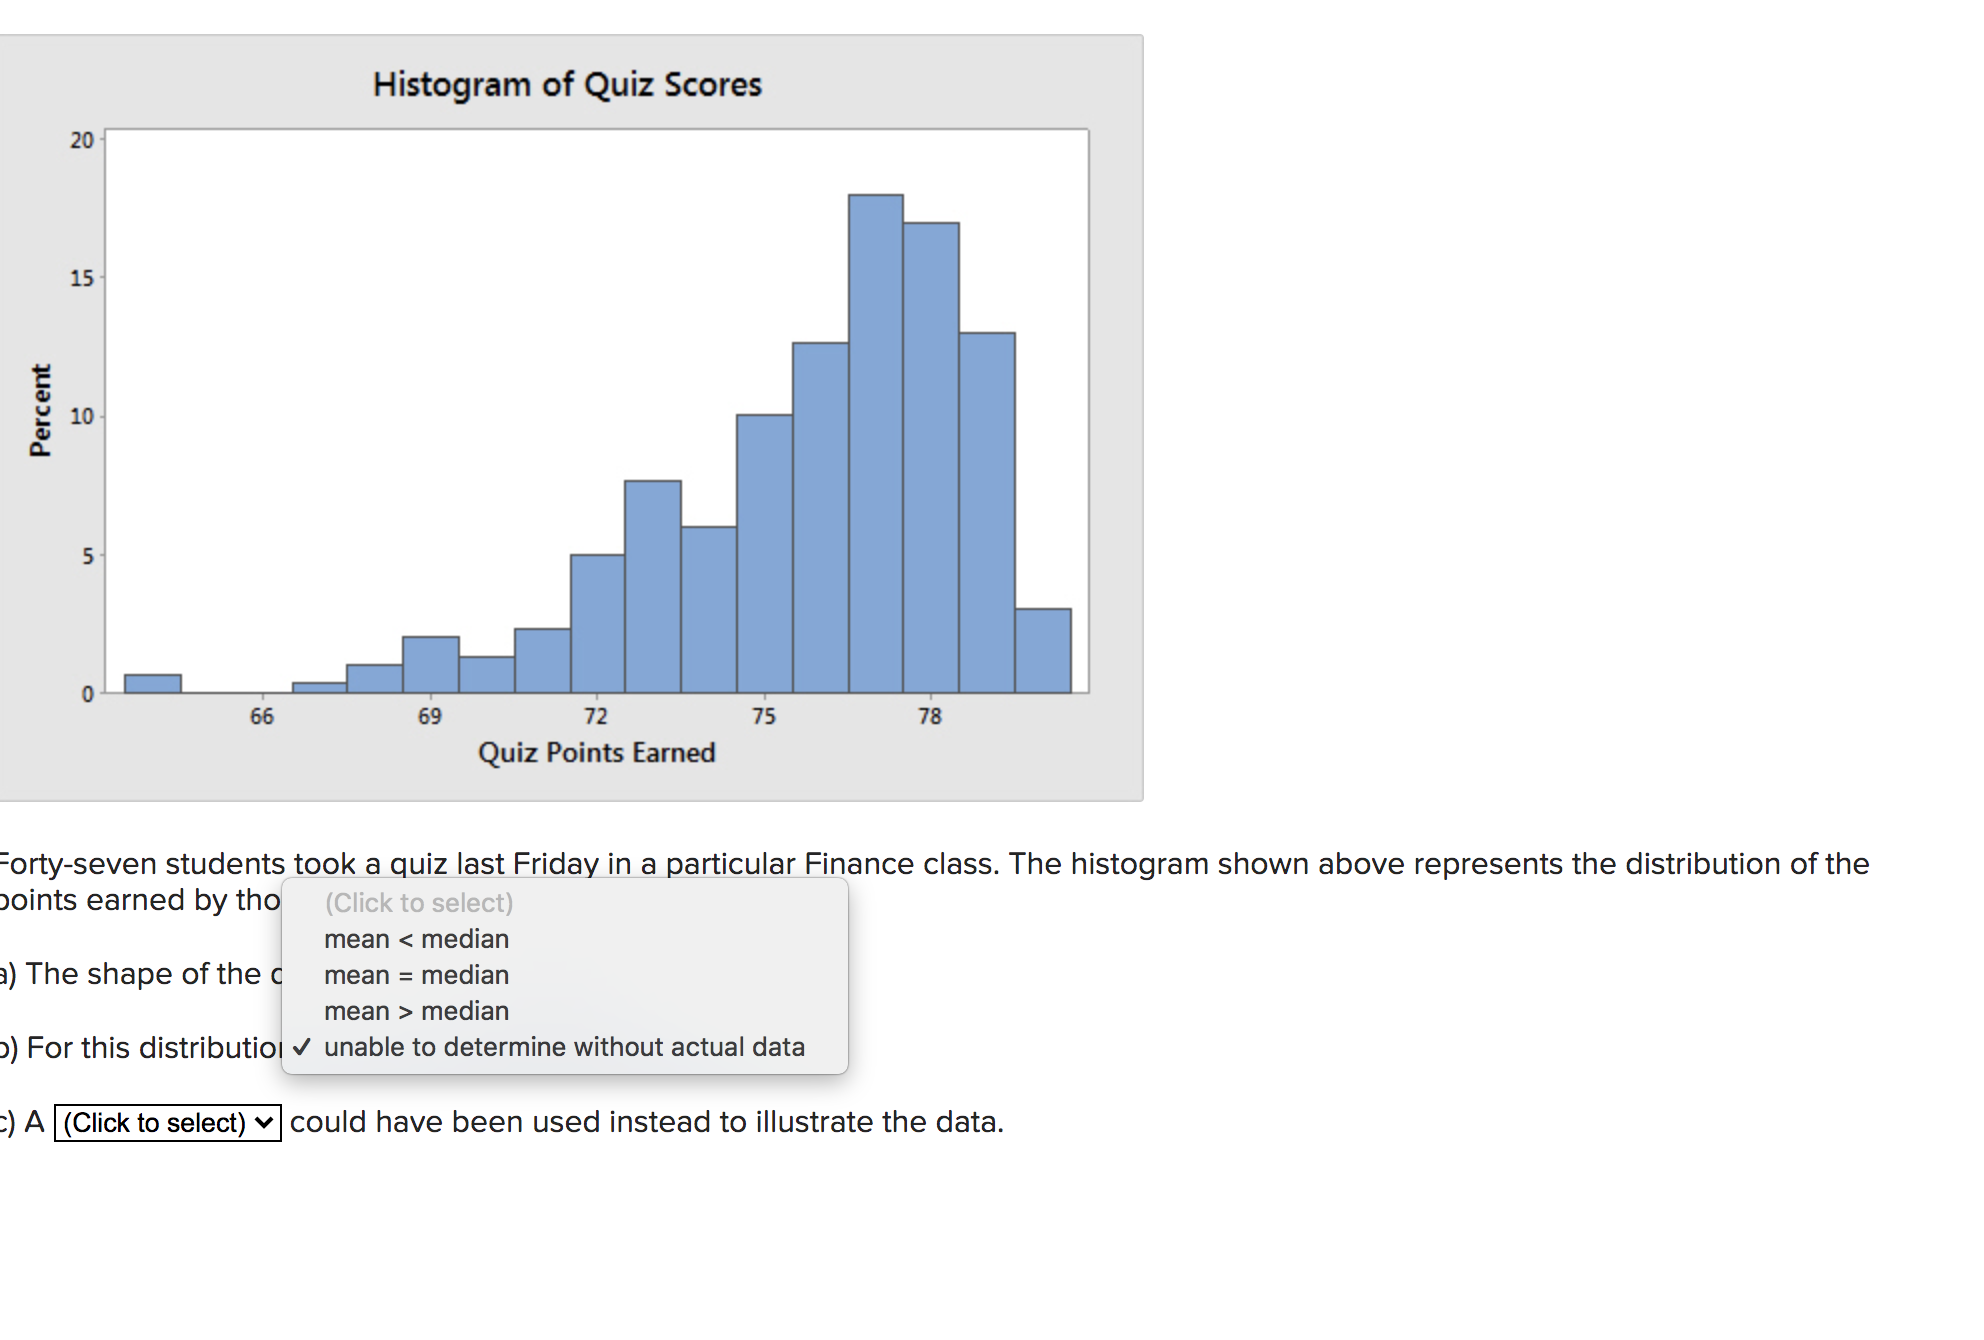
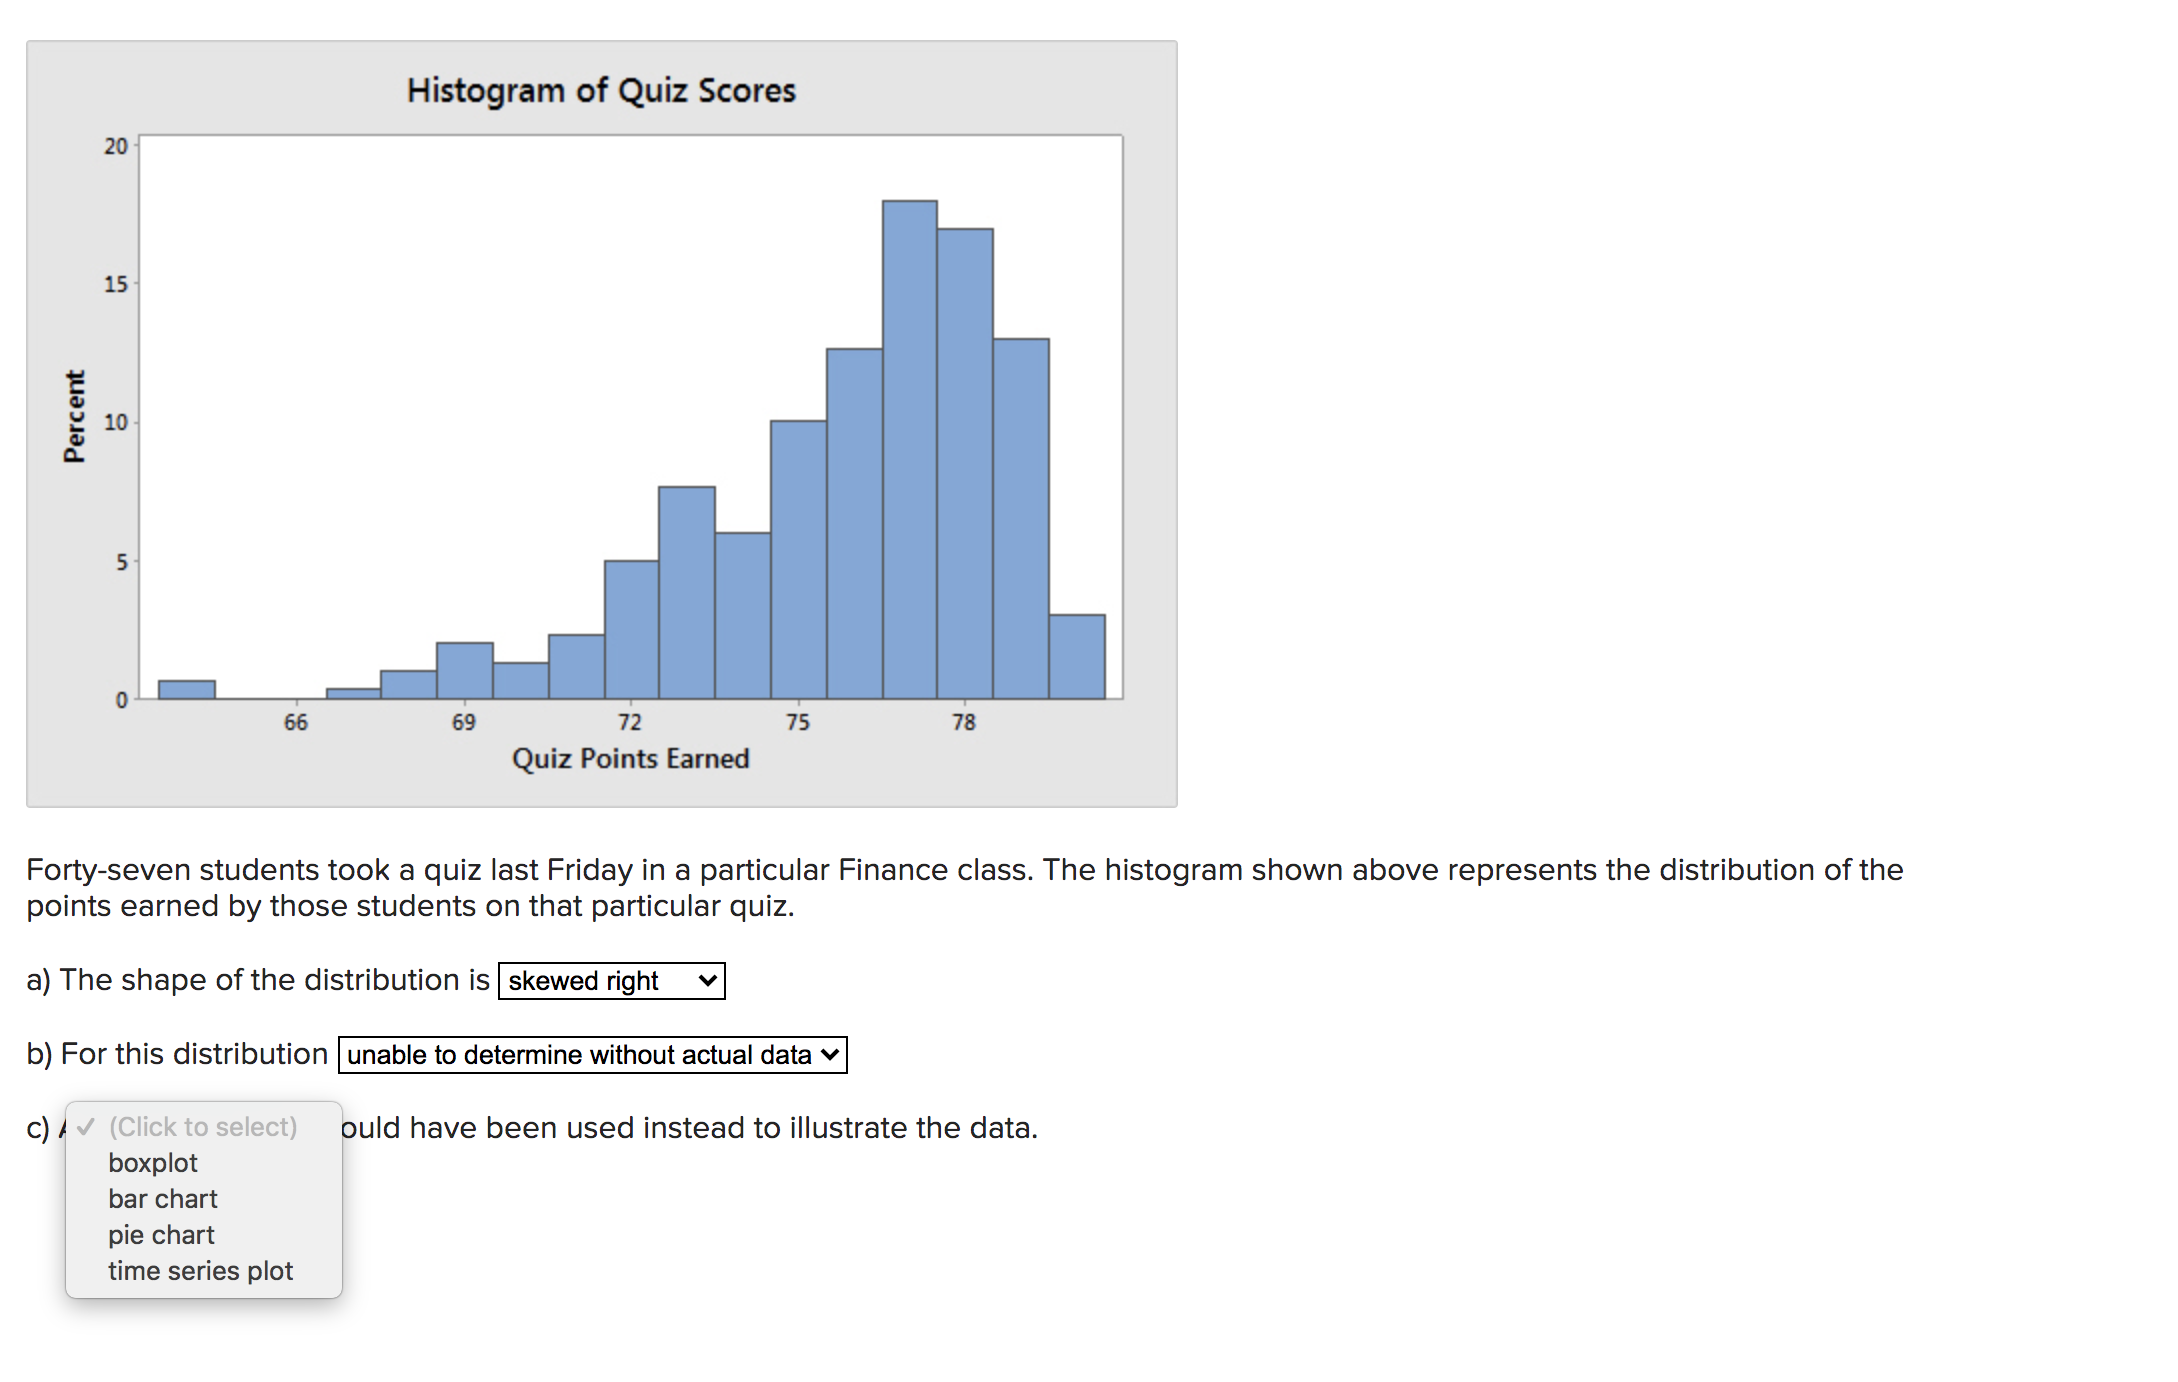
I NEED HELP!!! Histogram of Quiz Scores 20 15 Percent 10 5 66 69 72 75 78 Quiz Points Earned orty-seven students took a quiz

I NEED HELP!!!

image text in transcribedimage text in transcribed
Histogram of Quiz Scores 20 15 Percent 10 5 66 69 72 75 78 Quiz Points Earned orty-seven students took a quiz last Friday in a particular Finance class. The histogram shown above represents the distribution of the points earned by tho (Click to select) mean median ) For this distribution v unable to determine without actual data ) A (Click to select) v could have been used instead to illustrate the data.Histogram of Quiz Scores 66 69 72 75 Quiz PolntsEamed Fortyseven students took a quiz last Friday in a particular Finance class. The histogram shown above represents the distribution of the points earned by those students on that particular quiz. a) The shape of the distribution is skewed right v b) For this distribution unable to determine without actual data v c) J (Click to select) uld have been used instead to illustrate the data. boxplot bar chart pie chart time series plot

Step by Step Solution

There are 3 Steps involved in it

Step: 1

blur-text-image

Get Instant Access to Expert-Tailored Solutions

See step-by-step solutions with expert insights and AI powered tools for academic success

Step: 2

blur-text-image

Step: 3

blur-text-image

Ace Your Homework with AI

Get the answers you need in no time with our AI-driven, step-by-step assistance

Get Started

Students also viewed these Mathematics questions