Answered step by step
Verified Expert Solution
Link Copied!

Question

1 Approved Answer

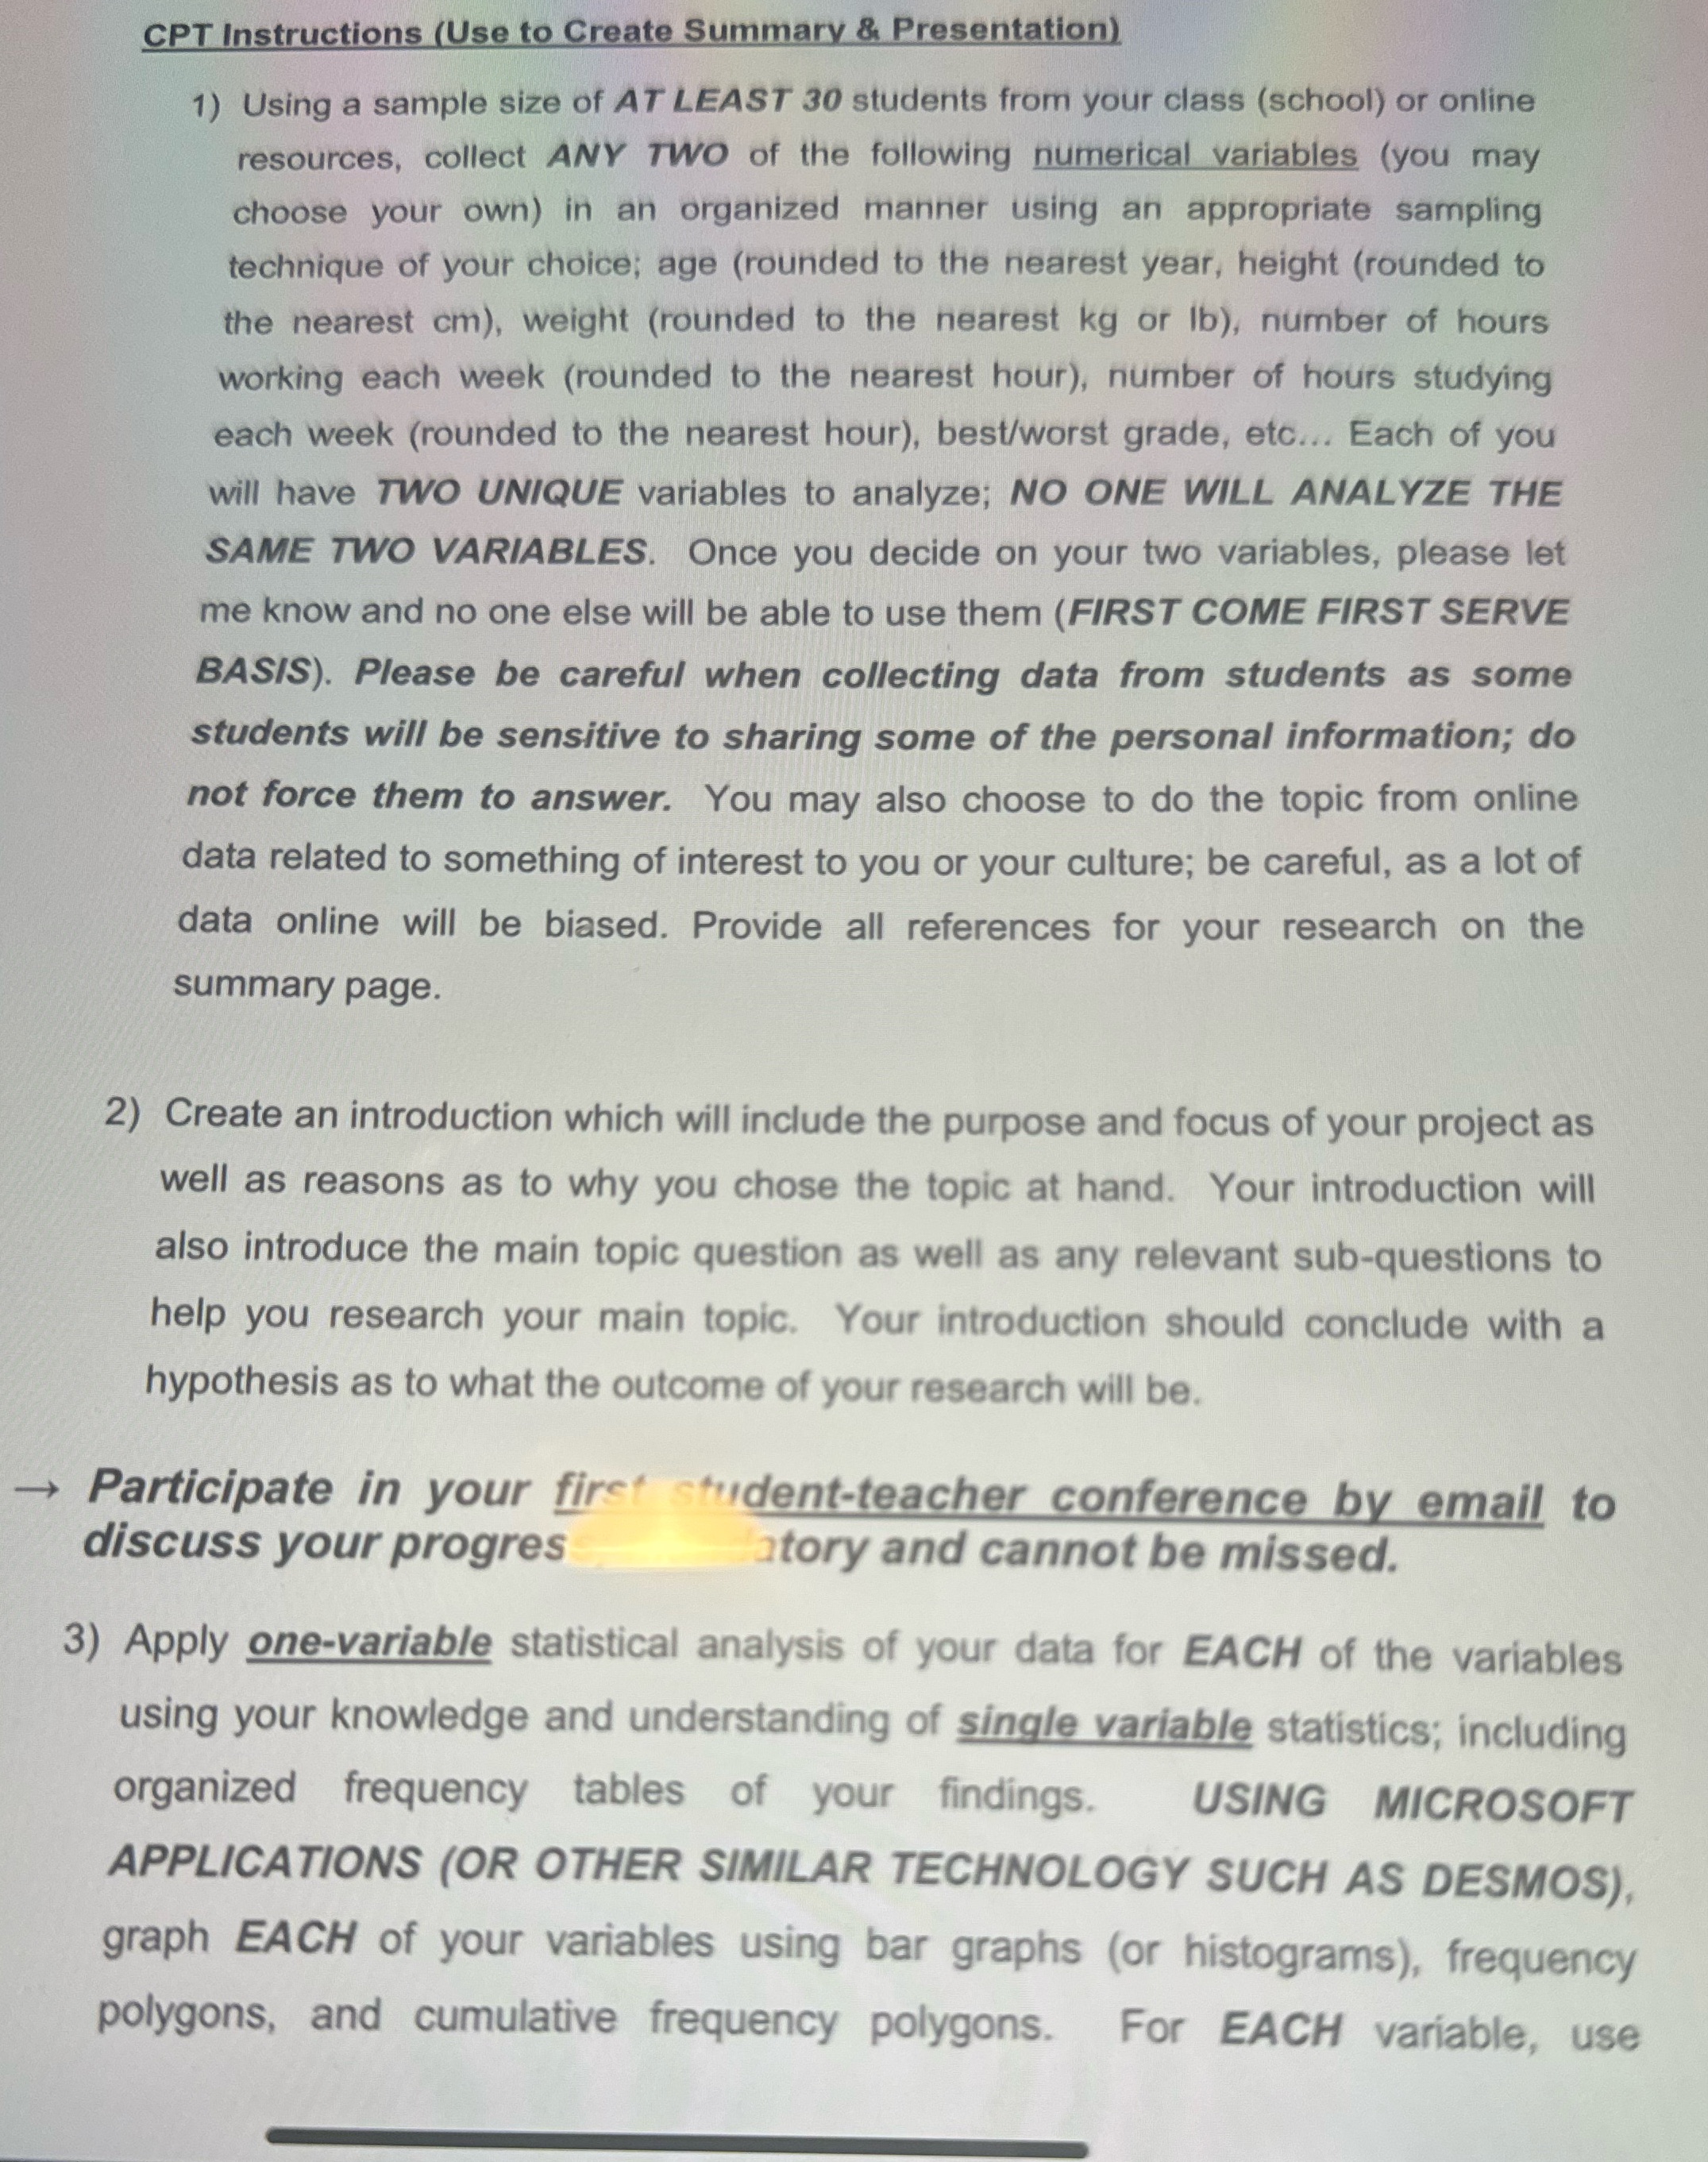
I need help in plotting the graphs too, thank you CPT Instructions (Use to Create Summary & Presentation) 1) Using a sample size of AT

I need help in plotting the graphs too, thank you

image text in transcribed
CPT Instructions (Use to Create Summary & Presentation) 1) Using a sample size of AT LEAST 30 students from your class (school) or online resources, collect ANY TWO of the following numerical variables (you may choose your own) in an organized manner using an appropriate sampling technique of your choice; age (rounded to the nearest year, height (rounded to the nearest cm), weight (rounded to the nearest kg or lb), number of hours working each week (rounded to the nearest hour), number of hours studying each week (rounded to the nearest hour), best/worst grade, etc... Each of you will have TWO UNIQUE variables to analyze; NO ONE WILL ANALYZE THE SAME TWO VARIABLES. Once you decide on your two variables, please let me know and no one else will be able to use them (FIRST COME FIRST SERVE BASIS). Please be careful when collecting data from students as some students will be sensitive to sharing some of the personal information; do not force them to answer. You may also choose to do the topic from online data related to something of interest to you or your culture; be careful, as a lot of data online will be biased. Provide all references for your research on the summary page. 2) Create an introduction which will include the purpose and focus of your project as well as reasons as to why you chose the topic at hand. Your introduction will also introduce the main topic question as well as any relevant sub-questions to help you research your main topic. Your introduction should conclude with a hypothesis as to what the outcome of your research will be. Participate in your first student-teacher conference by email to discuss your progres atory and cannot be missed. 3) Apply one-variable statistical analysis of your data for EACH of the variables using your knowledge and understanding of single variable statistics; including organized frequency tables of your findings. USING MICROSOFT APPLICATIONS (OR OTHER SIMILAR TECHNOLOGY SUCH AS DESMOS), graph EACH of your variables using bar graphs (or histograms), frequency polygons, and cumulative frequency polygons. For EACH variable, use

Step by Step Solution

There are 3 Steps involved in it

Step: 1

blur-text-image

Get Instant Access to Expert-Tailored Solutions

See step-by-step solutions with expert insights and AI powered tools for academic success

Step: 2

blur-text-image

Step: 3

blur-text-image

Ace Your Homework with AI

Get the answers you need in no time with our AI-driven, step-by-step assistance

Get Started

Recommended Textbook for

Intro Stats

Authors: Richard D. De Veaux, Paul F. Velleman, David E. Bock

3rd edition

321533283, 321533289, 9780321463708, 9780321503848, 9780321503800, 9780321499431, 9780321499417, 978-0321500458

More Books

Students also viewed these Mathematics questions

Question

Define marketing.

Answered: 1 week ago

Question

What are the traditional marketing concepts? Explain.

Answered: 1 week ago

Question

Define Conventional Marketing.

Answered: 1 week ago

Question

Define Synchro Marketing.

Answered: 1 week ago