Answered step by step
Verified Expert Solution
Link Copied!

Question

1 Approved Answer

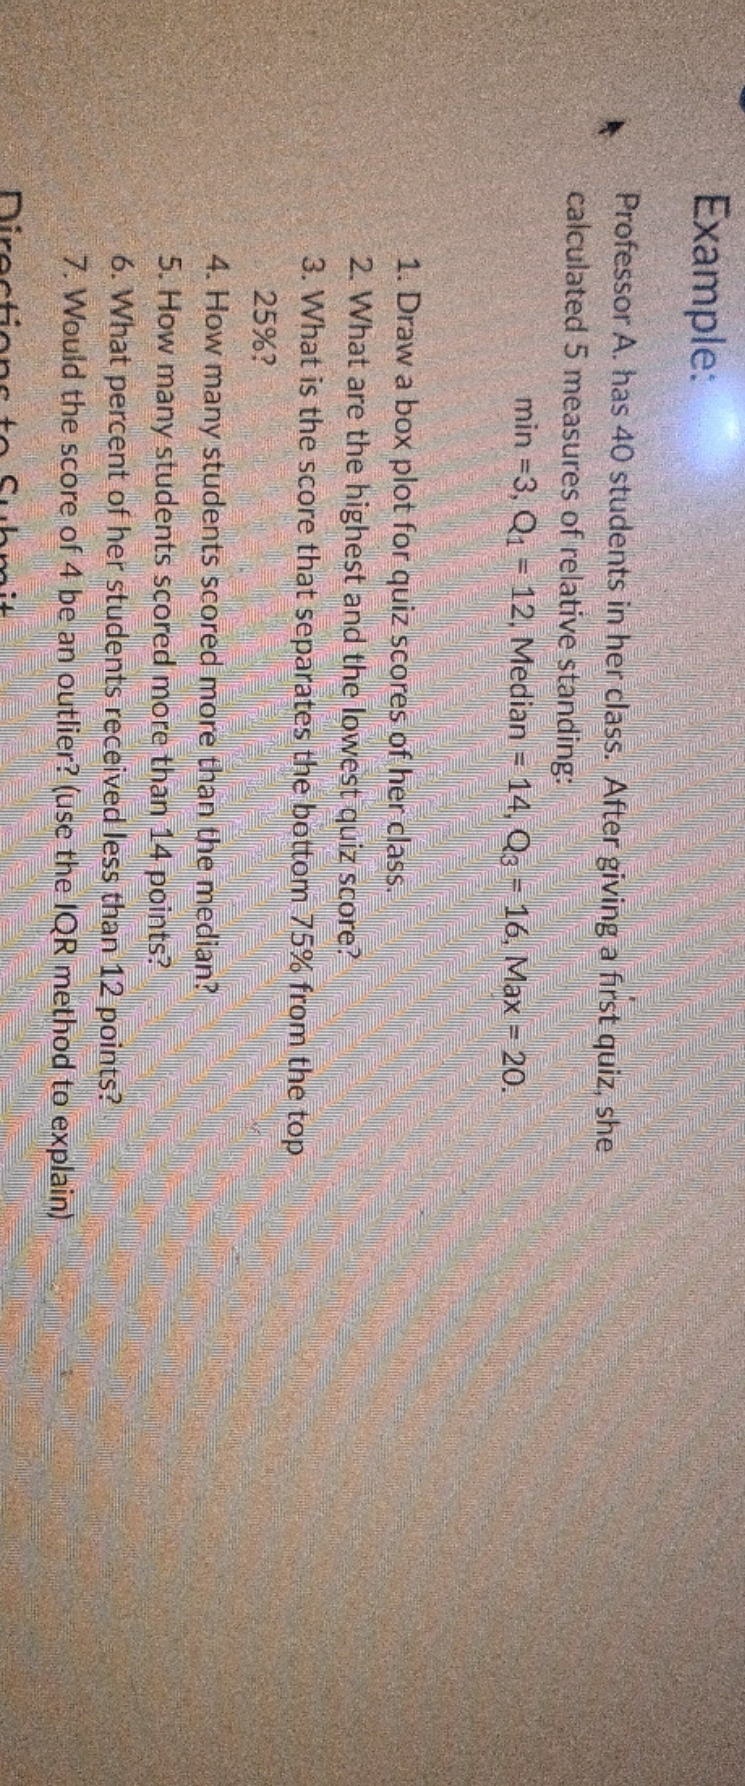
I need help on #3, #4, #5 and #6. Example: Professor A. has 40 students in her class. After giving a first quiz, she calculated

image text in transcribed

I need help on #3, #4, #5 and #6.

image text in transcribed
Example: Professor A. has 40 students in her class. After giving a first quiz, she calculated 5 measures of relative standing: min =3, Q1 = 12, Median = 14, Qg - 16, Max - 20. 1. Draw a box plot for quiz scores of her class. 2. What are the highest and the lowest quiz score? 3. What is the score that separates the bottom 75% from the top 25%? 4. How many students scored more than the median? 5. How many students scored more than 14 points? 6. What percent of her students received less than 12 points? 7. Would the score of 4 be an outlier? (use the IOR method to explain)

Step by Step Solution

There are 3 Steps involved in it

Step: 1

blur-text-image

Get Instant Access to Expert-Tailored Solutions

See step-by-step solutions with expert insights and AI powered tools for academic success

Step: 2

blur-text-image

Step: 3

blur-text-image

Ace Your Homework with AI

Get the answers you need in no time with our AI-driven, step-by-step assistance

Get Started

Recommended Textbook for

College Geometry A Discovery Approach

Authors: David Kay

2nd Edition

0321830954, 9780321830951

More Books

Students also viewed these Mathematics questions

Question

Draw a sketch of the graph of the given inequality. y x 3 8

Answered: 1 week ago