

Answered step by step
Verified Expert Solution
Question
1 Approved Answer
I need help pleaseee Descriptions: In the exercise, you will analyze portfolios consisting of stock funds and bond funds. Steps: Portfolio Formation 1. Select four
I need help pleaseee 
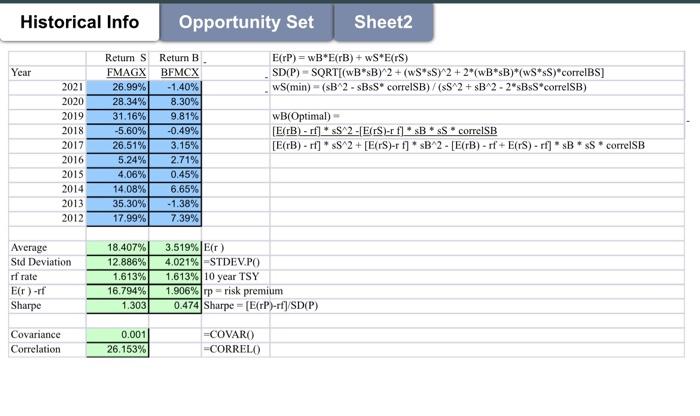
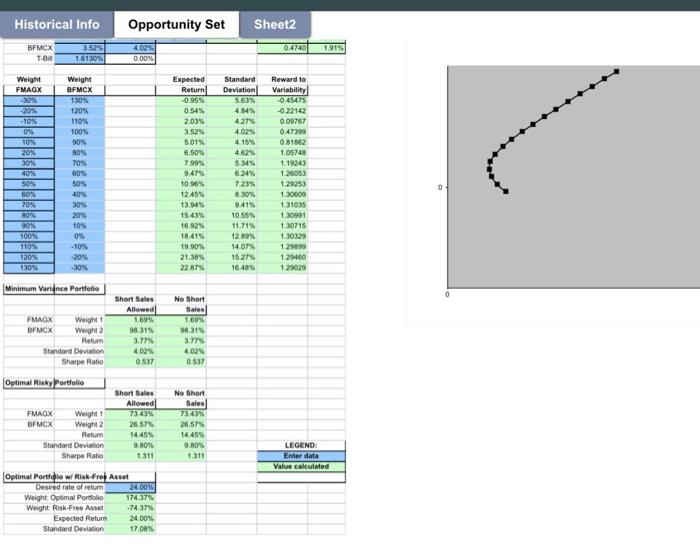
Descriptions: In the exercise, you will analyze portfolios consisting of stock funds and bond funds. Steps: Portfolio Formation 1. Select four mutual funds: Two stock funds and two bond funds. a. One of the stock funds should include the company that you selected in Written Assignment #1 (if you can't find such a fund, select a fund that includes a competitor of your company). 2. You will create six portfolios each containing two mutual funds (AB, BC, BD, AC, AD, CD). 3. For each fund collect annual return data for the 10-year period from 2012 to 2021. 4. For each Portfolio compute average return, standard deviations of retums, covariance, and correlation. 5. Calculate the investment opportunity set for each Portfolio including Sharpe ratios. Each student should analyze two Portfolios. a. What is the minimum-variance portfolio for each? b. What is the optimal risky portfolio for each? c. What is the best Sharpe ratio for each portfolio? (Use 1.613% as the rate for 10-yr treasury bonds as the risk- free rate). Deliverables: 1. A 1.5 page report discussing your results including a summary table and a short paragraph on each portfolio. Your discussion should include: a. How do the different fund categories (stock vs bond) and styles (value, growth, sector, high grade, high yield) impact your results? How do the fund correlations impact your results? Explain how the results support or contradict your initial expectations when selecting the funds? What is the impact of the ability to short a fund? b. What is the single best fund combination among the 6 portfolios? Why? What does your Complete portfolio look like if you need a target return of 15% 2. An Excel file for each Student that contains your Historical Info Opportunity Set Sheet2 Year 2021 2020 2019 2018 2017 2016 2015 2014 2013 2012 Returns FMAGX 26.99% 28.34% 31.16% -5.60% 26.51% 5.24% 4.06% 14.08% 35.30% 17.99% Return B BFMCX -1.40% 8.30% 9.81% -0.49% 3.15% 2.71% 0,45% 6.65% -1.38% 7.39% E(TP)=WB*E(TB) + WS*E(S) SDP) - SQRT[(WBsB)^2 + (wS*sS}^2 + 2*(wB*B)*(wS*sS)*correlBS] WS(min) = (sB^2 - SBsS* correlSB)/($S^2 + B^2-24BsS*correlSB) wB(Optimal) [E(TB) - rf] *s$ 2-[E(S)- f*B*sScorrelSB [E(B) - rf] * S 2 + [E(S)-r f]* B^2 - [E(TB) - rf + E(TS) - rf]* B * ss * correlSB Average Std Deviation rf rate E(r) -rf Sharpe 18.407% 12.886% 1.613% 16.794% 1.303 3.519%E) 4.021% -STDEV.PO 1.613% 10 year TSY 1.906% prisk premium 0.474 Sharpe - [E(rP)-rf/SD(P) Covariance Correlation 0.001 26.153% =COVARO -CORRELO) Historical Info Opportunity Set Sheet2 BFMCX T. 1.913 402 0.00% 0.4740 1.51309 Weight FMAGX Weight BFMCX 130% 120% 110% 100% 90% 80% 70% 00% -20% -10% 04 10% 20% 30% 40% 50% SON 70% BO 90% 100% 110% 120 130 Expected Return 0 95% 0.54% 2.03% 3.52% 5,01% 6.50% 7.99% 9.47% 10.96% 12.45% 13.94% 1543% 16.92 18.41% 19.90% 21.38% 22.87% Standard Deviation 563% 4 84% 4.27% 4.02% 4.15% 4.62% 5.34% 6 24% 7 23% 8.30% 9.41% 10.55% 11.71% 12.9 14.07% 15.27% 16.48% Reward to Variability 0.45475 -0.22142 0 09767 0.47399 0.81362 1 05740 1. 19243 1.25053 129253 130609 1 31035 130991 130715 130329 1.2009 1 29460 1.20029 50% 40% 30% 20% 10% ON -10% -20% 30% Minimum Variance Portfolio 0 No Short Sales FMAGX Weight BFMCX Weight 2 Return Standard Deviation Sharpe Ratio Optimal Rinky portfolie Short Sales Allowed 160 90315 3.77% 402% 0.537 96.315 3.77 4.02% 0.537 Short Sales Allowed FMAGX Weight 1 BFMCX Weight 2 Return Standard Deviation Sharpe Ratio 26.57% 14.45% 9.80% 1311 No Short Sales 73,43% 26.57% 14.45% 9.00% 1.311 LEGEND Enter data Value calculated Optimal Portiglio wRisk Frey Asset Desired rate of return 2000 Weight: Optimal Portfolio 174.37% Weight: Risk Free Asset -74 37% Expected Return 24.00% Standard Deviation 17 08% Descriptions: In the exercise, you will analyze portfolios consisting of stock funds and bond funds. Steps: Portfolio Formation 1. Select four mutual funds: Two stock funds and two bond funds. a. One of the stock funds should include the company that you selected in Written Assignment #1 (if you can't find such a fund, select a fund that includes a competitor of your company). 2. You will create six portfolios each containing two mutual funds (AB, BC, BD, AC, AD, CD). 3. For each fund collect annual return data for the 10-year period from 2012 to 2021. 4. For each Portfolio compute average return, standard deviations of retums, covariance, and correlation. 5. Calculate the investment opportunity set for each Portfolio including Sharpe ratios. Each student should analyze two Portfolios. a. What is the minimum-variance portfolio for each? b. What is the optimal risky portfolio for each? c. What is the best Sharpe ratio for each portfolio? (Use 1.613% as the rate for 10-yr treasury bonds as the risk- free rate). Deliverables: 1. A 1.5 page report discussing your results including a summary table and a short paragraph on each portfolio. Your discussion should include: a. How do the different fund categories (stock vs bond) and styles (value, growth, sector, high grade, high yield) impact your results? How do the fund correlations impact your results? Explain how the results support or contradict your initial expectations when selecting the funds? What is the impact of the ability to short a fund? b. What is the single best fund combination among the 6 portfolios? Why? What does your Complete portfolio look like if you need a target return of 15% 2. An Excel file for each Student that contains your Historical Info Opportunity Set Sheet2 Year 2021 2020 2019 2018 2017 2016 2015 2014 2013 2012 Returns FMAGX 26.99% 28.34% 31.16% -5.60% 26.51% 5.24% 4.06% 14.08% 35.30% 17.99% Return B BFMCX -1.40% 8.30% 9.81% -0.49% 3.15% 2.71% 0,45% 6.65% -1.38% 7.39% E(TP)=WB*E(TB) + WS*E(S) SDP) - SQRT[(WBsB)^2 + (wS*sS}^2 + 2*(wB*B)*(wS*sS)*correlBS] WS(min) = (sB^2 - SBsS* correlSB)/($S^2 + B^2-24BsS*correlSB) wB(Optimal) [E(TB) - rf] *s$ 2-[E(S)- f*B*sScorrelSB [E(B) - rf] * S 2 + [E(S)-r f]* B^2 - [E(TB) - rf + E(TS) - rf]* B * ss * correlSB Average Std Deviation rf rate E(r) -rf Sharpe 18.407% 12.886% 1.613% 16.794% 1.303 3.519%E) 4.021% -STDEV.PO 1.613% 10 year TSY 1.906% prisk premium 0.474 Sharpe - [E(rP)-rf/SD(P) Covariance Correlation 0.001 26.153% =COVARO -CORRELO) Historical Info Opportunity Set Sheet2 BFMCX T. 1.913 402 0.00% 0.4740 1.51309 Weight FMAGX Weight BFMCX 130% 120% 110% 100% 90% 80% 70% 00% -20% -10% 04 10% 20% 30% 40% 50% SON 70% BO 90% 100% 110% 120 130 Expected Return 0 95% 0.54% 2.03% 3.52% 5,01% 6.50% 7.99% 9.47% 10.96% 12.45% 13.94% 1543% 16.92 18.41% 19.90% 21.38% 22.87% Standard Deviation 563% 4 84% 4.27% 4.02% 4.15% 4.62% 5.34% 6 24% 7 23% 8.30% 9.41% 10.55% 11.71% 12.9 14.07% 15.27% 16.48% Reward to Variability 0.45475 -0.22142 0 09767 0.47399 0.81362 1 05740 1. 19243 1.25053 129253 130609 1 31035 130991 130715 130329 1.2009 1 29460 1.20029 50% 40% 30% 20% 10% ON -10% -20% 30% Minimum Variance Portfolio 0 No Short Sales FMAGX Weight BFMCX Weight 2 Return Standard Deviation Sharpe Ratio Optimal Rinky portfolie Short Sales Allowed 160 90315 3.77% 402% 0.537 96.315 3.77 4.02% 0.537 Short Sales Allowed FMAGX Weight 1 BFMCX Weight 2 Return Standard Deviation Sharpe Ratio 26.57% 14.45% 9.80% 1311 No Short Sales 73,43% 26.57% 14.45% 9.00% 1.311 LEGEND Enter data Value calculated Optimal Portiglio wRisk Frey Asset Desired rate of return 2000 Weight: Optimal Portfolio 174.37% Weight: Risk Free Asset -74 37% Expected Return 24.00% Standard Deviation 17 08% Step by Step Solution
There are 3 Steps involved in it
Step: 1

Get Instant Access to Expert-Tailored Solutions
See step-by-step solutions with expert insights and AI powered tools for academic success
Step: 2

Step: 3
Ace Your Homework with AI
Get the answers you need in no time with our AI-driven, step-by-step assistance
Get Started
Trading Systems Theory And Immediate Practice
Authors: Renato Di Lorenzo
1st Edition
8847027055,8847027063