I need help solving this question. 3. The market for electronic textbooks Consider the market for new economics textbooks. The following graph shows the demand
I need help solving this question.
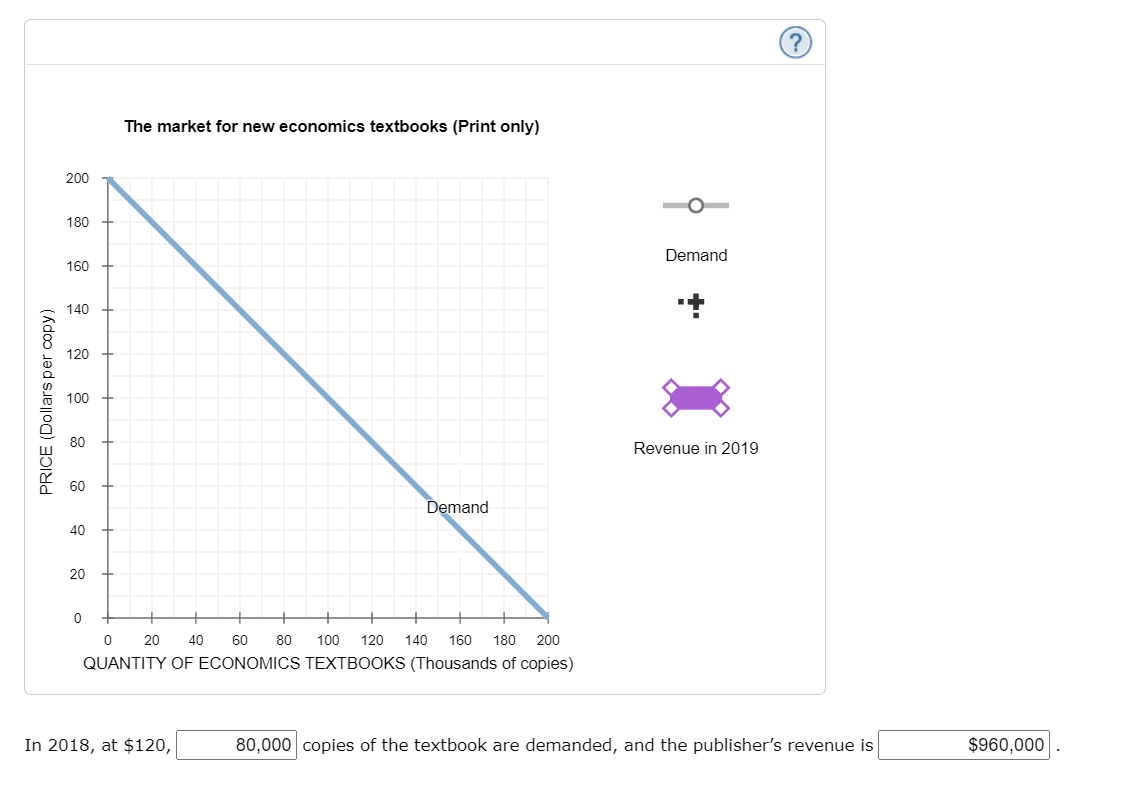
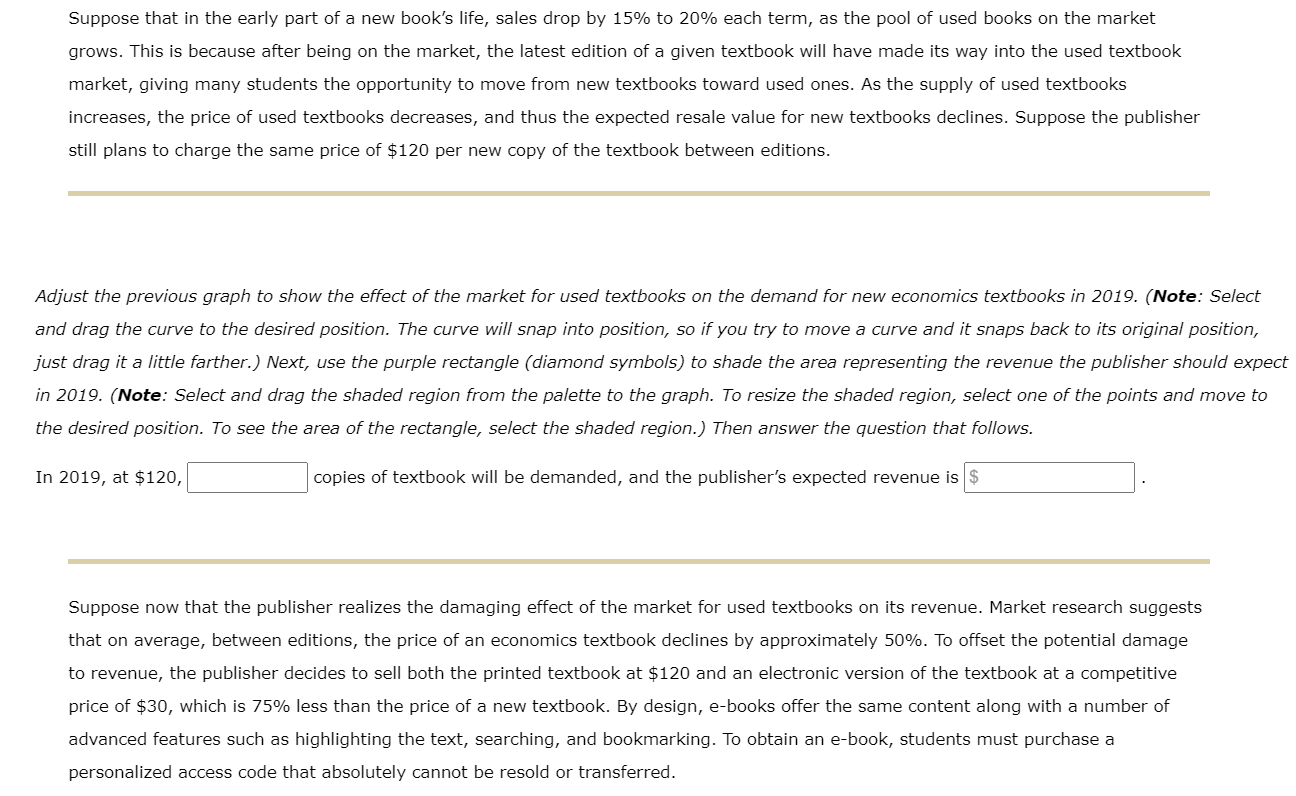
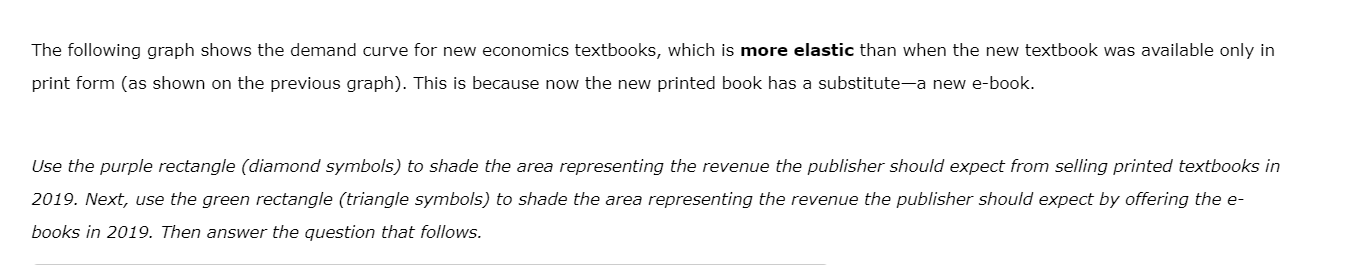
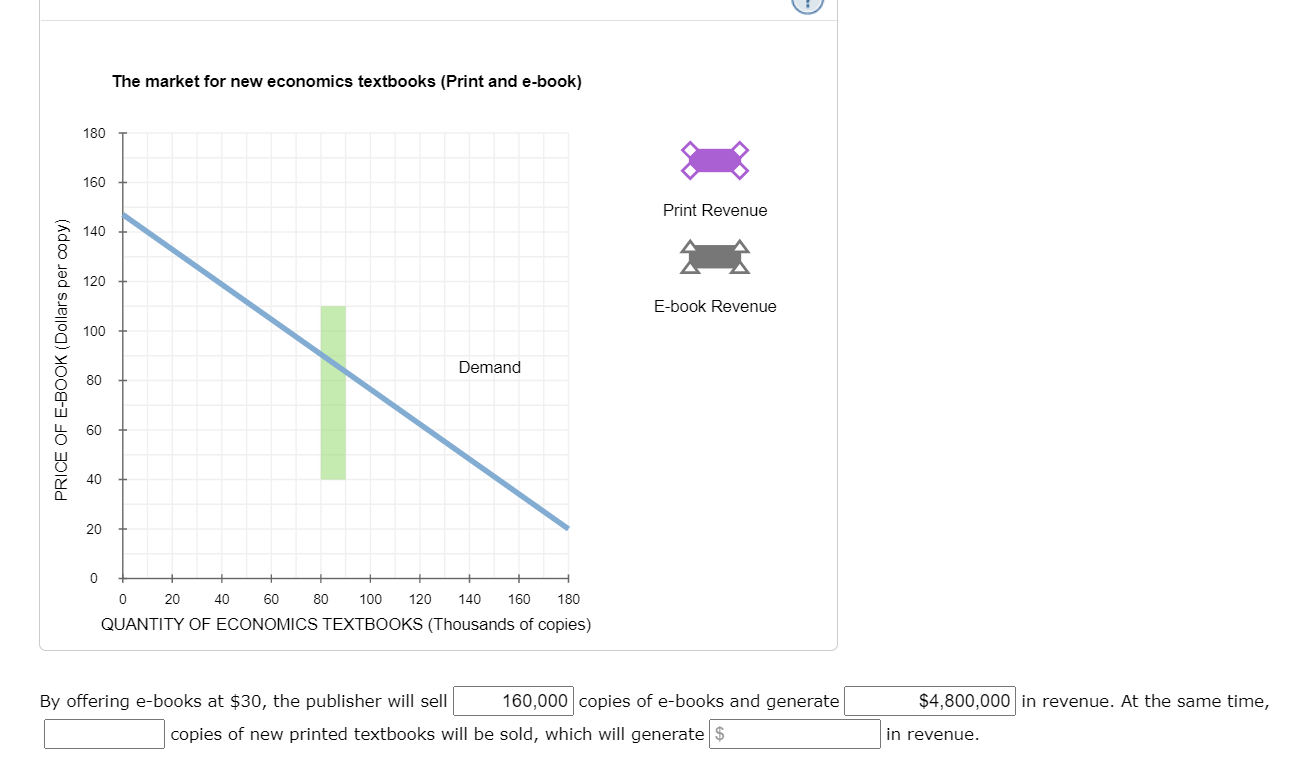
3. The market for electronic textbooks Consider the market for new economics textbooks. The following graph shows the demand curve for new textbooks. Suppose that the publisher issues a new edition every four years and that a printed copy of the new 2018 textbook sells for a retail price of $120. On the following graph, use the black point (cross symbol) to indicate the point on the demand curve at $120. (Note: Dashed drop lines will automatically extend to both axes.) Then answer the question that follows.The market for new economics textbooks (Print only] 200 + 180 160 Demand H 140 "!' DH '8' ._ 120 [D D. In E 100 n E Q 8 80 Revenue in 2019 E 60 mand 40 20 o 020405030100120140150130200 QUANTITY OF ECONOMICS TEXTBOOKS (Thousands of copies) In 2018, at $120, 80,000 copies of the textbook are demanded, and the publisher's revenue is $960,000 . Suppose that in the early part of a new book's life, sales drop by 15% to 20% each term, as the pool of used books on the market grows. This is because after being on the market, the latest edition of a given textbook will have made its way into the used textbook market, giving many students the opportunity to move from new textbooks toward used ones. As the supply of used textbooks increases, the price of used textbooks decreases, and thus the expected resale value for new textbooks declines. Suppose the publisher still plans to charge the same price of $120 per new copy of the textbook between editions. Adjust the previous graph to show the effect of the market for used textbooks on the demand for new economics textbooks in 2019. (Note: Seiect and drag the curve to the desired position. The curve wiii snap into position, so if you try to move a curve and it snaps back to its originai position, just drag it a iittie farther.) Next, use the purpie rectangie (diamond symbois) to shade the area representing the revenue the pubiisher shouid expect in 201 9. (Note: Seiect and drag the shaded region from the paiette to the graph. To resize the shaded region, seiect one of the points and move to the desired position. To see the area of the rectangie, seiect the shaded region.) Then answer the question that foiiows. In 2019, at $120, E copies of textbook will be demanded, and the publisher's expected revenue is . Suppose now that the publisher realizes the damaging effect of the market for used textbooks on its revenue. Market research suggests that on average, between editions, the price of an economics textbook declines by approximately 50%. To offset the potential damage to revenue, the publisher decides to sell both the printed textbook at $120 and an electronic version of the textbook at a competitive price of $30, which is 75% less than the price ofa new textbook. By design, ebooks offer the same content along with a number of advanced features such as highlighting the text, searching, and bookmarking. To obtain an ebook, students must purchase a personalized access code that absolutely cannot be resold or transferred. The following graph shows the demand curve for new economics textbooks, which is more elastic than when the new textka was available only in print form (as shown on the previous graph). This is because now the new printed book has a substitutea new ebook. Use the purple rectangle (diamond symbols) to shade the area representing the revenue the publisher should expect from selling printed textbooks in 2019. Next, use the green rectangle ( triangle symbols) to shade the area representing the revenue the publisher should expect by offering the e- boolcs in 2019. Then answer the question that follows. 111a market for new economics textbooks (Print and e-book} 180 H Pnnt Revenue H Ebook Revenue 160 140 120 100 Demand PRICE OF E-BOOK [Dollars peroopy) 20 I l l I l l I I l O 20 40 60 BO 100 120 140 160 180 QUANTITY OF ECONOMICS TEXTBOOKS Uhousands of copies) By offering ebooks at $30, the publisher will sell 160,000 copies of ebooks and generate $4,800,000 in revenue. At the same time, S copies of new printed textbooks will be sold, which will generate in revenue
Step by Step Solution
There are 3 Steps involved in it
Step: 1
Get Instant Access to Expert-Tailored Solutions
See step-by-step solutions with expert insights and AI powered tools for academic success
Step: 2
Step: 3
Ace Your Homework with AI
Get the answers you need in no time with our AI-driven, step-by-step assistance