Question
I need help to analyze and provide an analytical report of the Excel dataset given. Please suggest where to place the fields to make a
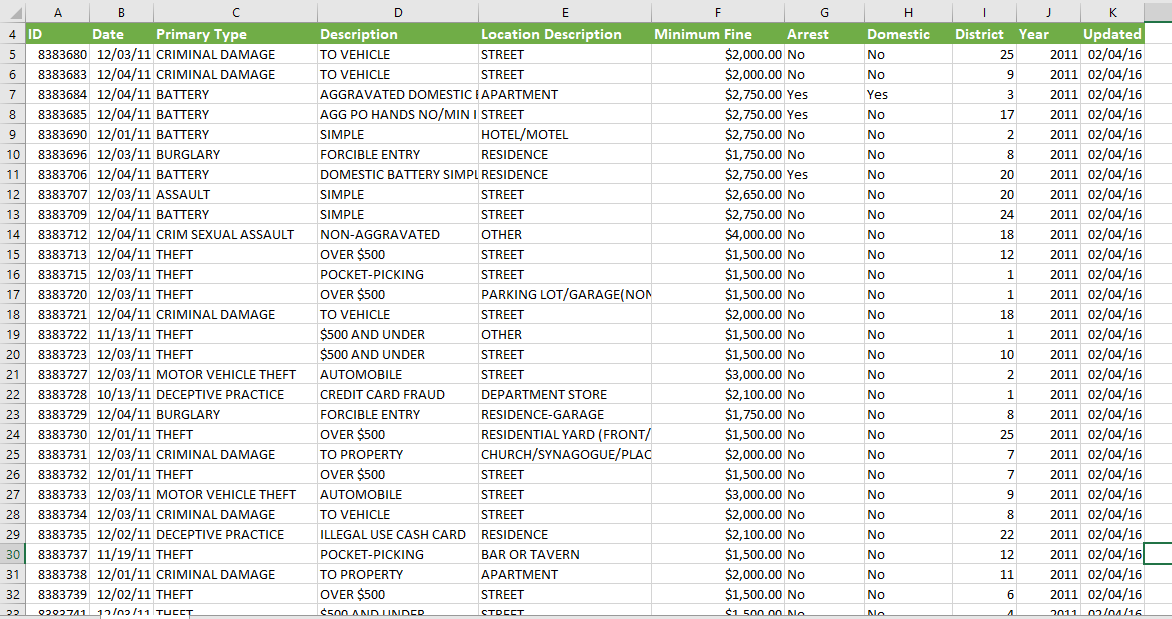
I need help to analyze and provide an analytical report of the Excel dataset given. Please suggest where to place the fields to make a comprehensive pivot table, what charts can be used to describe relationship between datasets, where I can use Sorting, Filtering, Subtotals, IF, CountIF, AverageIF functions. The requirement of the assignment is below. I am also providing a screenshot of the Excel sheet to get the idea of the dataset to be used. Thanks in advance
1.You should provide THREE (3) insights based on your data sets. You will be looking for relationships between attributes in the data set that can help you understand the Crime data. 2. You are expected to demonstrate your ability to use the following functions appropriately: Sorting, Filtering, Subtotals, IF, CountIF, AverageIF, Pivot Tables and others. 3. Your analysis may not support using all the listed functions. However, your team will be marked on the sophistication of the analysis and the appropriateness of the tools being used. 4. You and your team are expected to create some professional chart(s) for each insight to communicate the results of your analysis. The charts should help to interpret our results and conclusions. 5. For each insight, the report of your data analysis will include: a. A statement about what you are trying to discover. b. Tables summarizing the results from your analysis. c. Charts/diagrams/plots you are using to visualise the data with appropriate headings and formatting.

Step by Step Solution
There are 3 Steps involved in it
Step: 1

Get Instant Access to Expert-Tailored Solutions
See step-by-step solutions with expert insights and AI powered tools for academic success
Step: 2

Step: 3

Ace Your Homework with AI
Get the answers you need in no time with our AI-driven, step-by-step assistance
Get Started


