I need help with all these questions please:
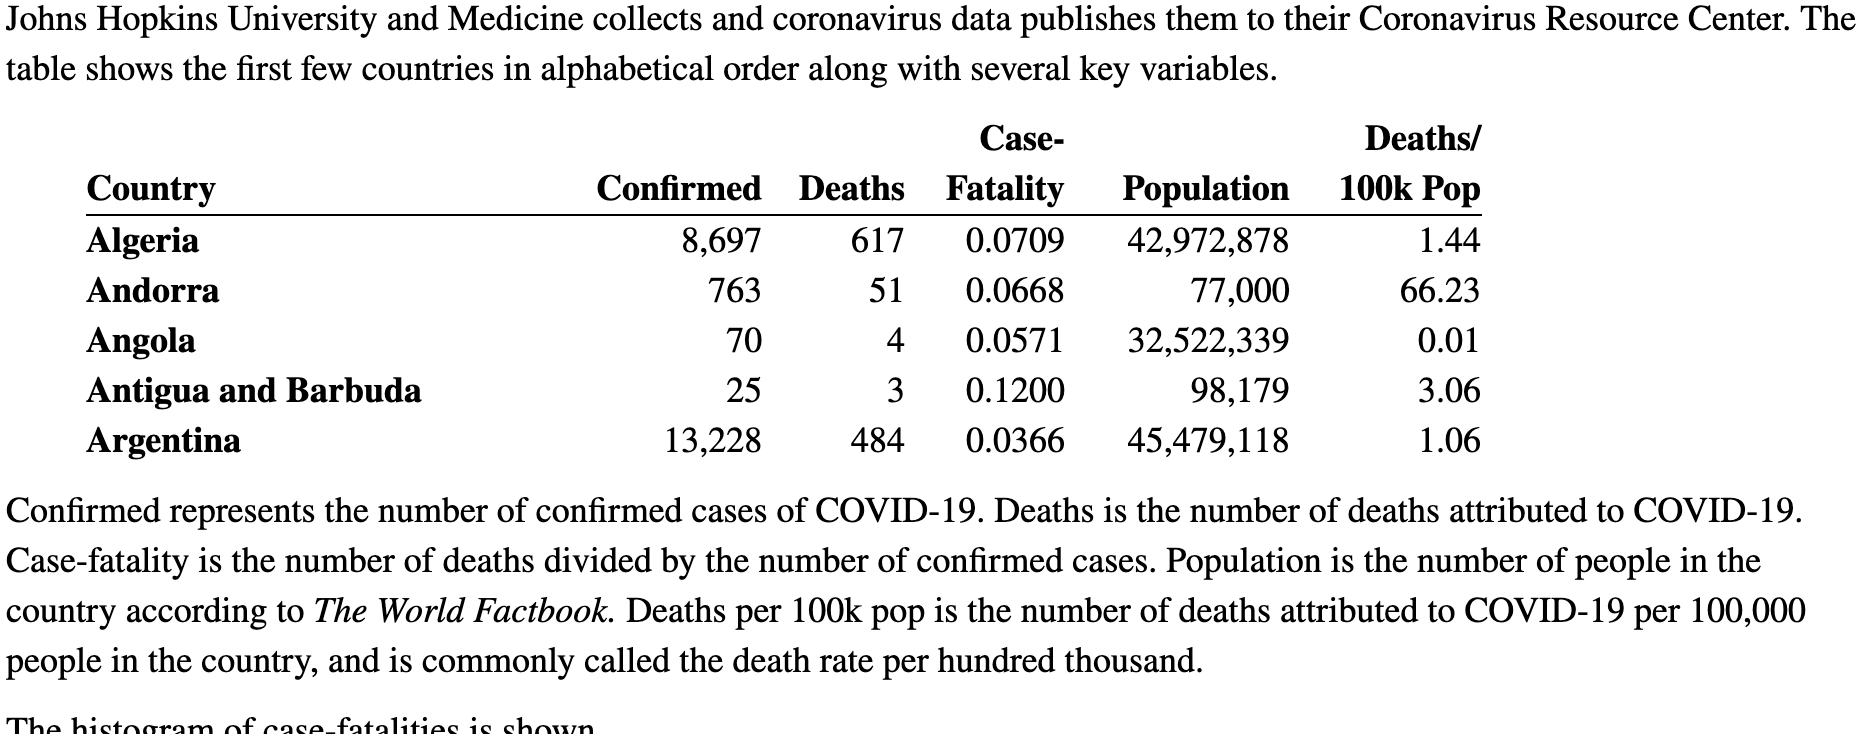
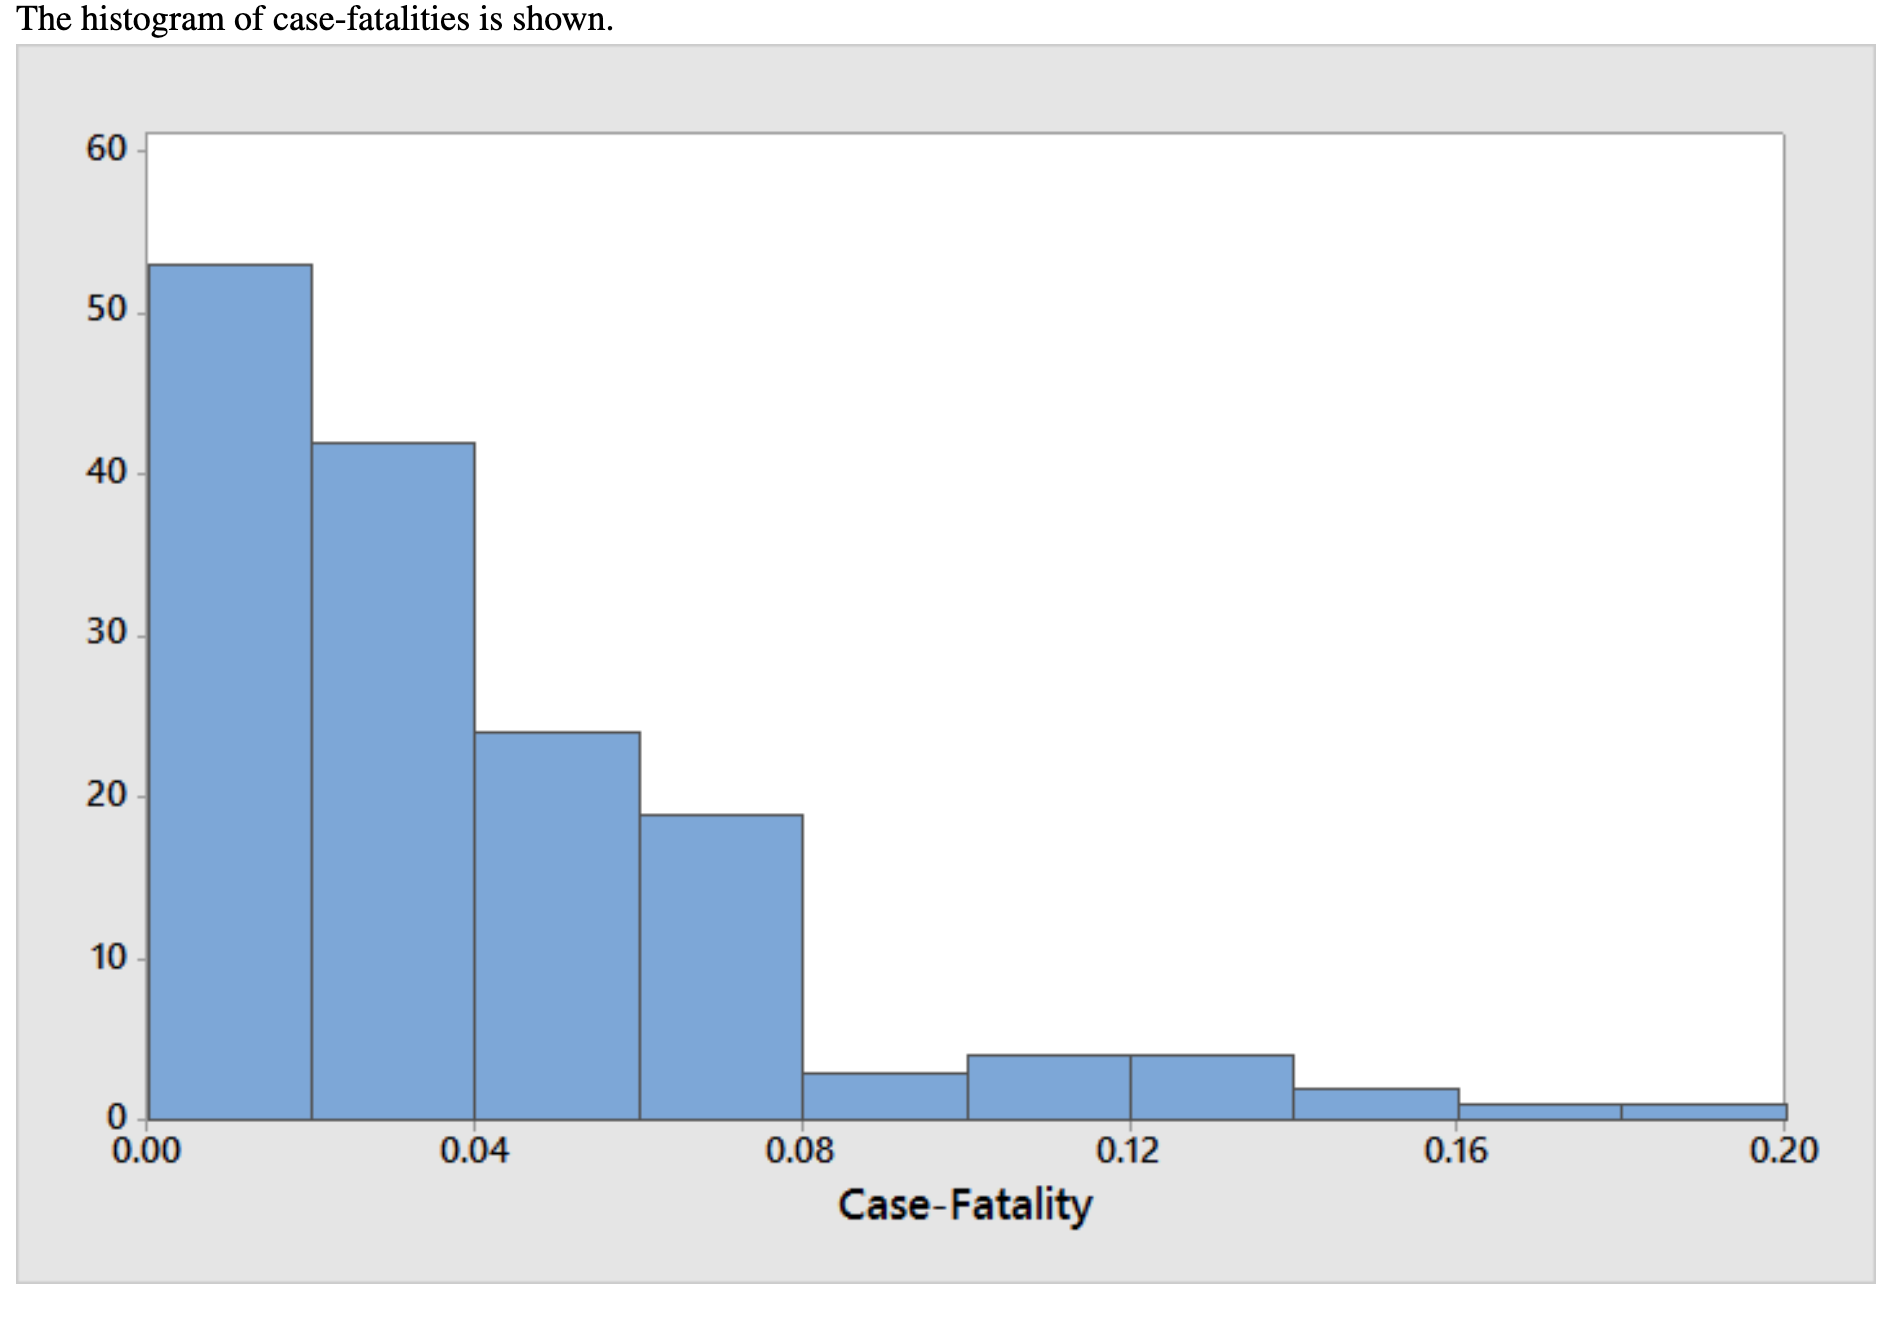
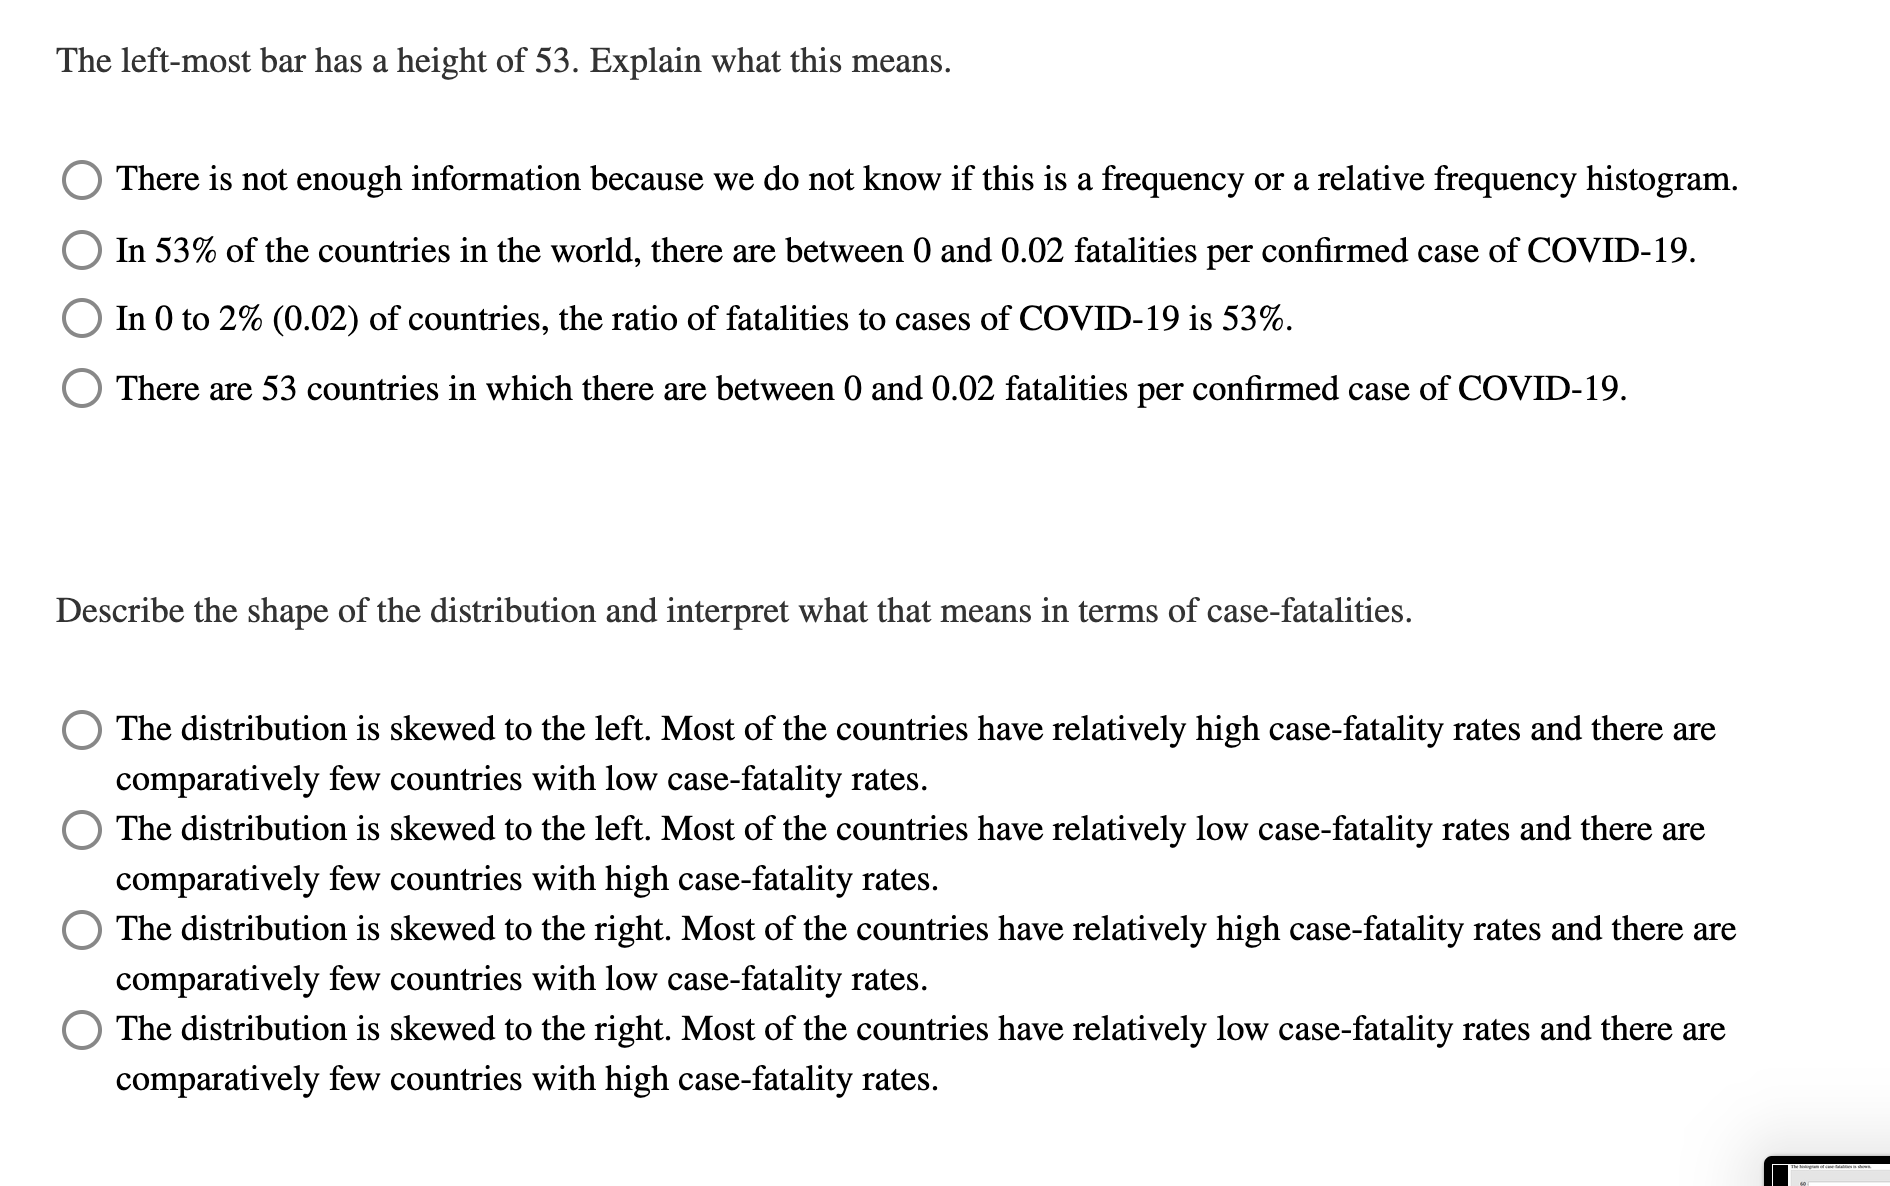
Johns Hopkins University and Medicine collects and coronavirus data publishes them to their Coronavirus Resource Center. The table shows the first few countries in alphabetical order along with several key variables. Case- Deaths/ Country Confirmed Deaths Fatality Population 100k Pop Algeria 8,697 617 0.0709 42,972,878 1.44 Andorra 763 51 0.0668 77,000 66.23 Angola 70 4 0.0571 32,522,339 0.01 Antigua and Barbuda 25 3 0.1200 98,179 3.06 Argentina 13,228 484 0.0366 45,479,118 1.06 Confirmed represents the number of confirmed cases of COVID-19. Deaths is the number of deaths attributed to COVID-19. Case-fatality is the number of deaths divided by the number of confirmed cases. Population is the number of people in the country according to The World Factbook. Deaths per 100k pop is the number of deaths attributed to COVID-19 per 100,000 people in the country, and is commonly called the death rate per hundred thousand. The litio\fThe left-most bar has a height of 53. Explain what this means. 0 There is not enough information because we do not know if this is a frequency or a relative frequency histogram. O In 53% of the countries in the world, there are between 0 and 0.02 fatalities per conrmed case of COVIDl9. O In 0 to 2% (0.02) of countries, the ratio of fatalities to cases of COV1D-19 is 53%. Q There are 5 3 countries in which there are between 0 and 0.02 fatalities per conrmed case of COVID19. Describe the Shape of the distribution and interpret what that means in terms of casefatalities. O The distribution is skewed to the left. Most of the countries have relatively high casefatality rates and there are comparatively few countries with low case-fatality rates. 0 The distribution is skewed to the left. Most of the countries have relatively low case-fatality rates and there are comparatively few countries with high case-fatality rates. 0 The distribution is skewed to the right. Most of the countries have relatively high case-fatality rates and there are comparatively few countries with low casefatality rates. 0 The distribution is skewed to the right. Most of the countries have relatively low case-fatality rates and there are comparatively few countries with high case-fatality rates. Which choice best describes a simple random sample? 0 a selection of members of a population chosen because of their convenient accessibility and proximity O a selection of members from a population in such a way that every possible sample of the same size has an equal chance of being chosen 0 when a population is rst sorted into groups that share a similar characteristic and individuals are randomly chosen from each of the groups 0 when a population is rst sorted into comparable groups, groups are randomly chosen, and all of the individuals from those groups are chosen 0 a selection of members chosen from a population beginning at a random point and then chosen at set intervals from that point Which of the options uses a nominal level of measurement? 0 The distance between two cities is measures in miles. 0 A pencil made by a certain company is red, blue, orange, or yellow. Q Your opinion of this question is that it is easy, moderate, or hard. 0 The years since the Common Era began range from 1 to 2016. Which of the following options uses an ordinal level of measurement? O The height of a giraffe is measured in feet. 0 You can be early, on time, or late to class. Q A hobbit prefers breakfast, lunch, or dinner. 0 The date in June is between 1 and 30. Determine which situation describes an interval level of measurement. 0 A student's grade is measured by grade point average. 0 The temperature in a building is measured in degrees Fahrenheit. 0 The possible shirt sizes are small, medium, or large. 0 A student is identied by their student ID number. 0 There are three types of fruits in a basket: oranges, apples, and bananas. Determine which situation describes a ratio level of measurement. O A student is identified by their student ID number. O Exam questions are ranked as easy, moderate, or difficult. O The current time is counted on a 12-hour clock. O A student's grade is measured by grade point average. O In a video game, players can build with four kinds of blocks: stone, brick, granite, and obsidian.Select the best denition of population and sample. 0 A sample is a group selected in such a way that each member has a known chance of being in the group. A population is the larger group the sample represents. 0 A population is a number that describes an entire group. A sample is a number that describes a sub-collection of that group. O A sample is the complete group under study. A population is a sub-collection of members selected from the sample. 0 A population is the complete group under study. A sample is the sub-collection of members of the population from which data are actually collected. 0 A sample is the group from whom information is being collected. A population is the larger group the sample represents. Choose the best denitions of parameter and statistic. O A statistic is a variable that describes a sample and a parameter is a variable that describes a population. 0 A statistic is a number that describes a population and a parameter is a number that describes a sample. 0 A statistic is a number that describes a sample and a parameter is a number that describes a population. 0 A parameter is a number that describes a population. A statistic is a number that is used to estimate a parameter. 0 A parameter is an unknown characteristic of a group and a statistic is a known characteristic of a group