Answered step by step
Verified Expert Solution
Question
1 Approved Answer
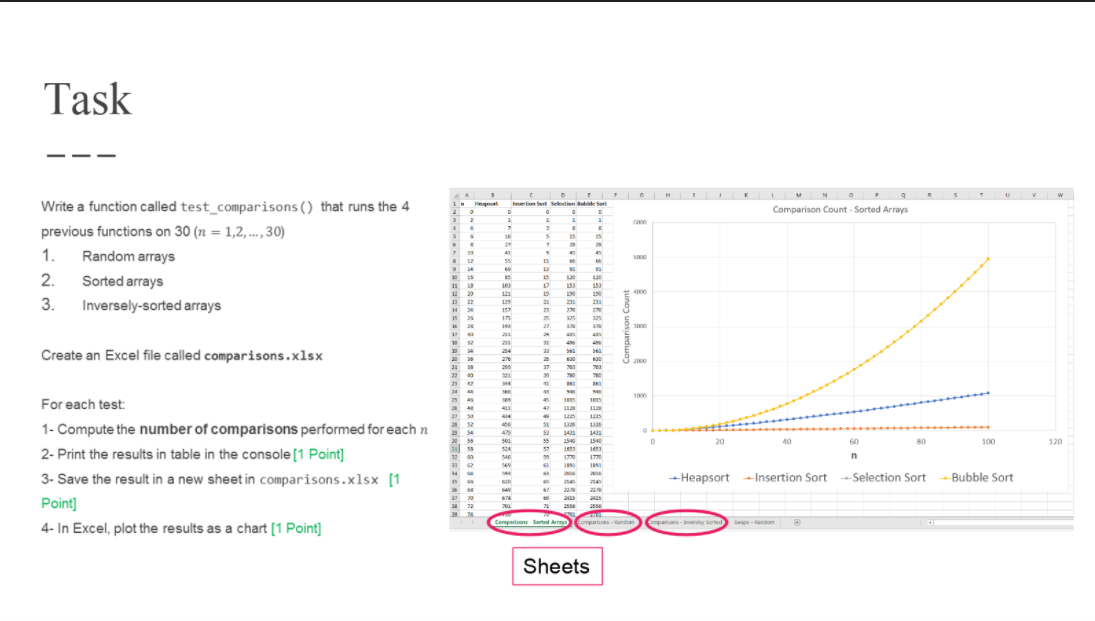
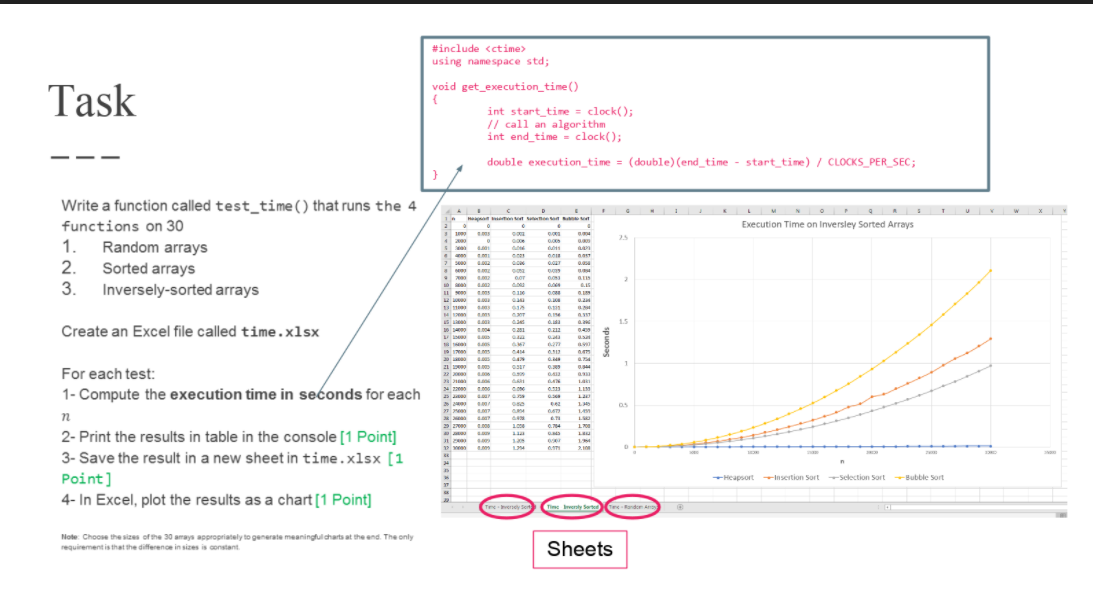
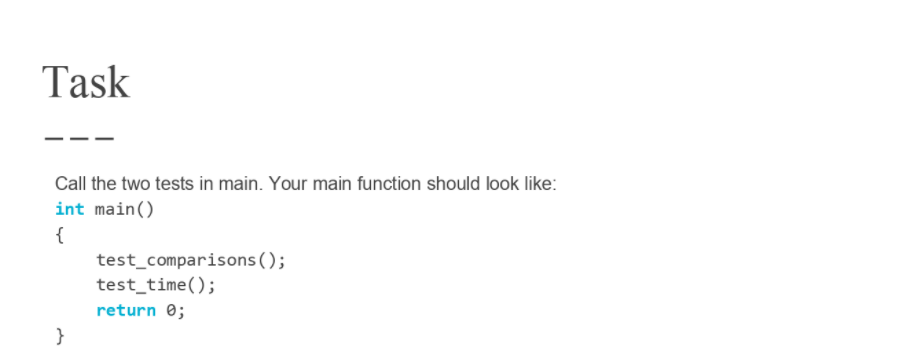
I need help with coding portion of the task (not the excel sheet portion). All coding must be done on C++. The functions in question


I need help with coding portion of the task (not the excel sheet portion). All coding must be done on C++. The functions in question utilize basic Heapsort, Insertion Sort, Bubble Sort, and Selection Sort algorithms in an attempt to compare their number of comparisons and time of completion. (so assume utilization of basic sorting functions for each algorithm type)
Task Het Comparison Count - Sorted Arrays Imeri Sort Selection Ball Sunt . . 15 Write a function called test_comparisons() that runs the 4 previous functions on 30 (n = 1,2,..., 30) 1. 1 Random arrays 2. Sorted arrays 3. Inversely-sorted arrays 7 3 LP 59 10 12 2 22 - 15 12 17 158 159 19 35 23 77 >> 19 17 ITS 14 Create an Excel file called comparisons.xlsx 3433 50 D 20 60 100 120 1653 SI n For each test: 1- Compute the number of comparisons performed for each n 2- Print the results in table in the console (1 Point] 3- Save the result in a new sheet in comparisons.xlsx (1 Point] 4- In Excel, plot the results as a chart (1 Point] 1891 Heapsort + Insertion Sort Selection Sort - Bubble Sort Comparisons Sorted prices and Sheets Task #includeStep by Step Solution
There are 3 Steps involved in it
Step: 1

Get Instant Access to Expert-Tailored Solutions
See step-by-step solutions with expert insights and AI powered tools for academic success
Step: 2

Step: 3

Ace Your Homework with AI
Get the answers you need in no time with our AI-driven, step-by-step assistance
Get Started


