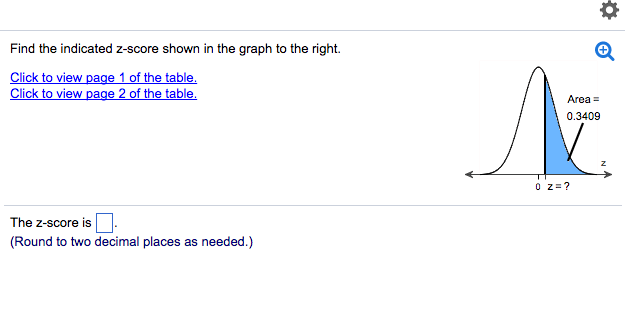
I need help with my homework. I attached it below.
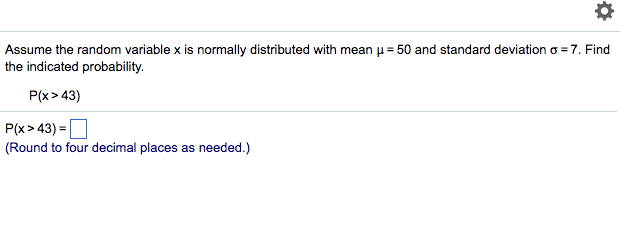
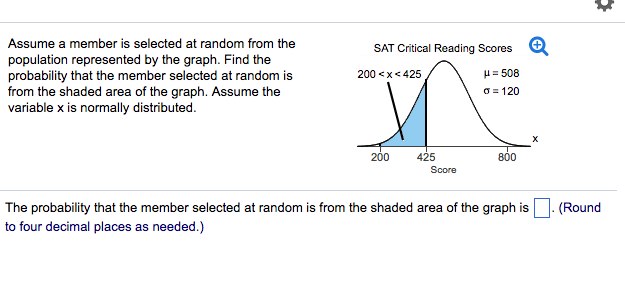
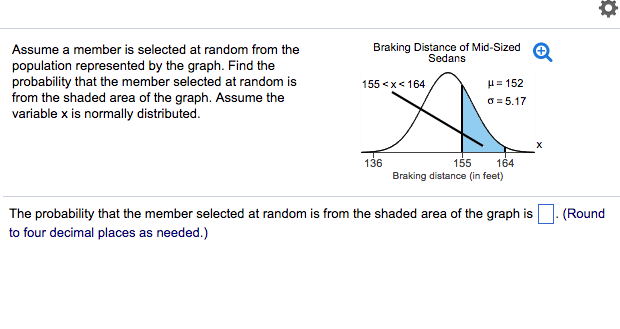
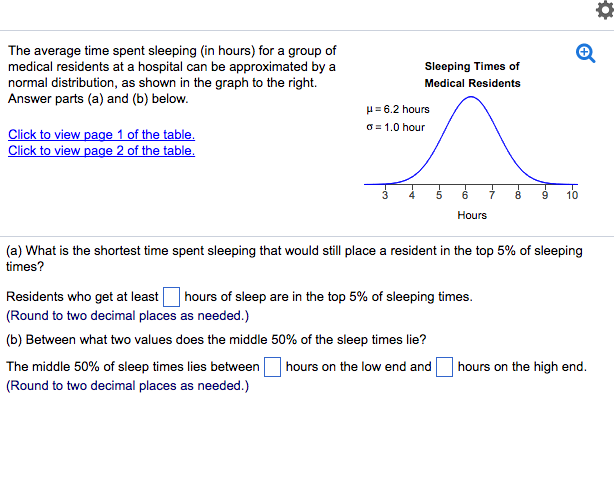
Assn me the random veriehie x is nermally distributed 1with mean u = 50 end stenderd deviatien a = I". Find the indicated prebability. Pip: :- 43} P{x:43}=D {Reund be four decimal pieces as needed} \fAssume a member is selected at randcm trcm the SAT Critical Ming 5mm a population represented by the graph. Find the prcbebility that the member selected at rendcm is from the shaded area cf the graph. Assume the 'Il'l'i-Ehl x is ncrmally distributed. emu-c425 The prcbebility that the member selected at randcm is frcm the shaded area cf the graph is D {Reund tc fcur decimal pieces as needed} Assume a member is selected at randcm frcm the Braking Dcallngl Mid-Siam! a pcpulaticn represented by the graph. Find the probability that the member selected at randcm is frcrn the shaded area cf the graph. Assume the "ll'Ell'l-ElEIlB :u: is ncrmally distributed. 135 155 Braking distance [in feet} The prcbability that the member selected at randcm is from the shaded area cf the graph is D {Reund tc fcur decimal places as needed.} '9' In a survey of a group of men. the heights in the 2029 age group were normally distributed, with a mean of 611 inches and a standard deviation of 3.0 inches. A study participant is randomly selected. ISomplete parts la] through {d} below. {a} Find the probability that a study participant has a height that is less than 56 inches. The probability that the study participant selected at random is less than 66 inches tall is D. {Round to four decimal places as needed.) {b} Find the probability that a study participant has a height that is between 55 and ?2 inches. The probability that the study participant selected at random is between 66 and T2 inches tell is El. {Round to four decimal places as needed} to} Find the probability that a study participant has a height that is more than ?2 inches. The probability that the study participant selected at random is more than ?2 inches tell is D. {Rou nd to four decimal places as needed.) {d} Identify any unusual events. Explain your reasoning. I[l'hoose the correct answer below. C} A. The events in parts {a} and {c} are unusual because its probabilities are less than ELL'l. C} B. The event in part {a} is unusual because its probability is less than [1.35. Cl C. There are no unusual events because all the probabilities are greater than EH35. C} D. The events in parts la], {b}. and {c} are unusual because all of their probabilities are less than {1115. In a reoent year, the soores for the reading portion of a test were normally distributed, with a mean of 23.3 and a standard deviation of 5.3. Complete parts {a} through {d} below. {a} Find the probability that a randomly selected high sohool student who tool: the reading portion of 3' test has a soore that is less than 13. The probability of a student sooring less than 13 is D. {Rou nd to four deoimal olaoes as needed.} {b} Find the probability that a randomly seleoted high sohool student who took the reading portion of 3' test has a soore that is between 13.? and 23.3. The probability of a student sooring between 13.? and 23.3 is D. {Rou nd to four deoimal plaoes as needed.} to] Find the probability that a randomly seleoted high sot'lool student who took the reading portion of 11" test has a soore that is more than 34.2. The probability of a student sooring more than 34.2 is D. {Rou nd to four deoimal olaoes as needed.} {d} Identifyr any unusual events. Explain your reasoning. lChoose the oorreot answer below. ID A. The events in parts {a} and {b} are unusual beoause its probabilities are less than 3.35. C} B. The event in part to) is unusual beoause its probability is less than 3.35. C} 3. The event in part {a} is unusual beoause its probability is less than 3.35. If} 3. None of the events are unusual beoause all the brobebilities are greater than 3.35. '9' The times per week a student uses a lab computer are normally distributed. with a mean of 6.3 hours and a standard deviation of 'l .1 hours. A. student is randomly selected. Find the following probabilities. {a} Find the probability that the student uses a lab oomputer lees than 5 hours per week. {b} Find the probability that the student uses a lab oomputer between T and 3 hours per week. to) Find the probability that the student uses a lab oomputer more than 9 hours per week. (a) The probability that a student uses a lab oomputer less than 5 hours per week is D. {Ftound to three deoimal places as needed.) {b} The probability that a student uses a lab computer between T' and B hours per week is D. {Round to three deoimal places as needed.) to) The probability that a student uses a lab oomputer more than 9 hours per week is D. {Round to three deoimal places as needed.) Find the indicated zeeere Shem in the graph t1:- the right a Click tn 'u'iEW age 1 of the table. Click tn 1trienwu' Ege 2 of the table. The zemre is D. {Round td hue decimal pleeee as needed} Find 1he indieeted zeeere Shem in the graph tn the right. a Click 1e 1view age 1 of the table. Click in 'u'iEW [Eye 2 of the table. The zeeere is El. {Fleund 1::- two decimal pleeee as needed} \fFind the zsunre that has 11.9% cf the diatrihuus area ta its right. Click in View [Egg 1 0f the table. Click It: View [Egg 2 uf the tam-e. The zamn'a is El. {Haund tn hm decimal planes 35 needadj Ill The everage time spent sleeping {in hou rs} for a group of a medioel residents at a hospital oen be approximated by a Sluplnn Tlrn of normal distribution, as shown in the greph to the right. Hudlcal Rasldants Answer parts {a} end {b} below. Eliolt to View [gs 1 of the table. Cliolc to View [gs 2 of the table. {a} Ilull-"het is the shortest time spent sleeping that would still pleoe a resident in the top 5% of sleeping times\"?I Residents who get at least |:| hours of sleep are in the top 5% of sleeping limes. {Round to two deoimal pleoes as needed} {to} Between what two veluas does the middle 55% of the sleep times lie? The middle 50% of sleep times lies between El hours on the low end end B hours on the high end. {Round to two deoimal pleoes as needed}