i need help with my homework. i need short explanation and correct answer. NEED ASAP.
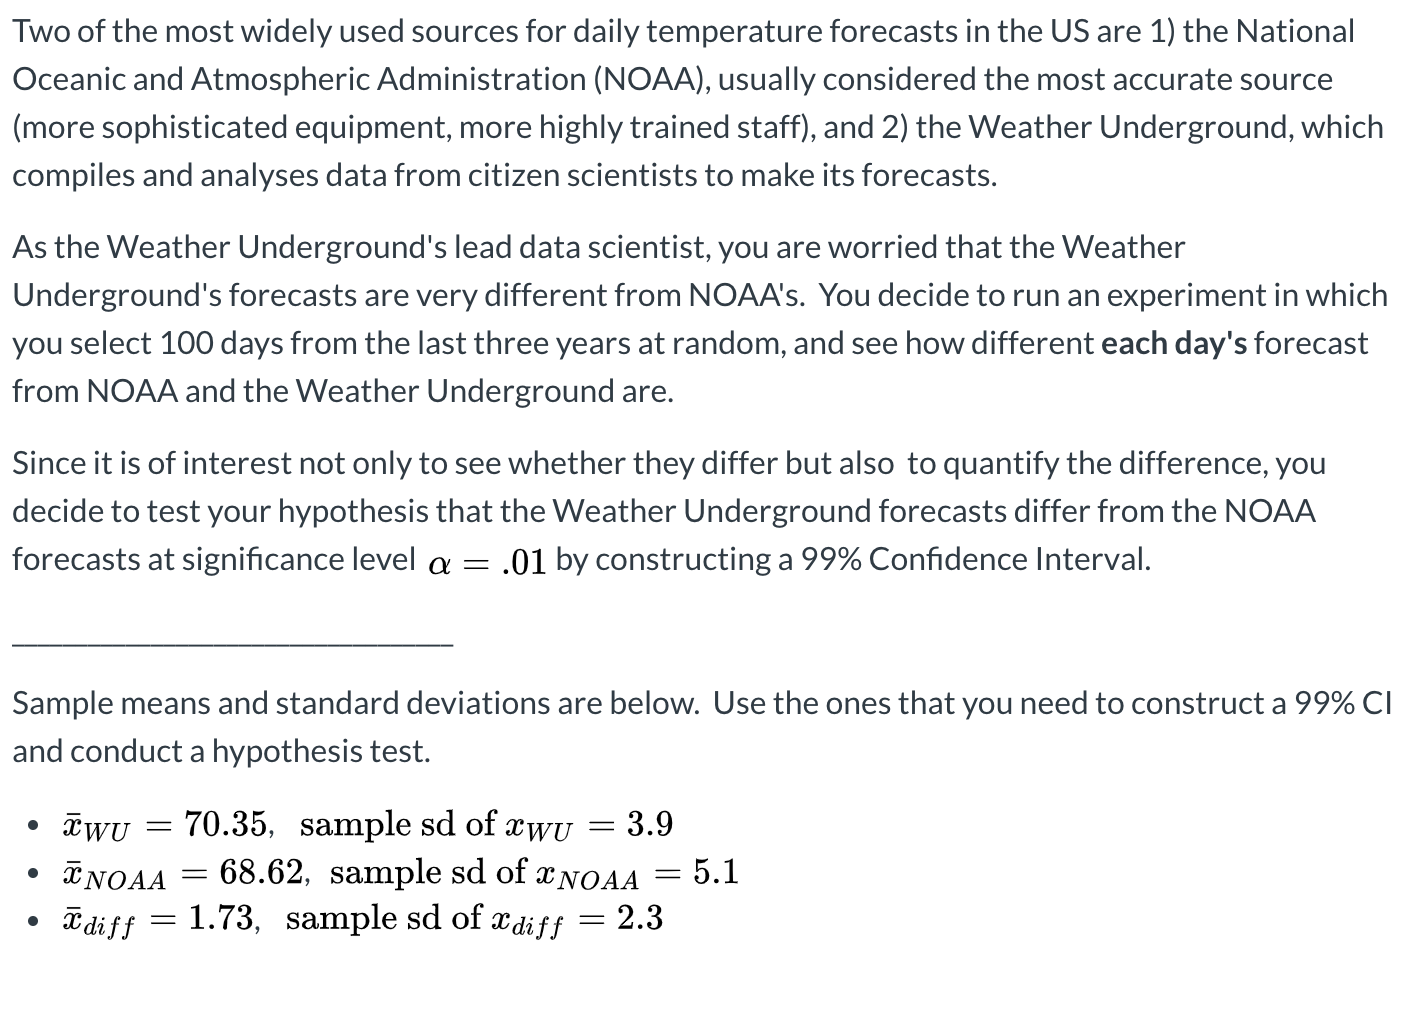
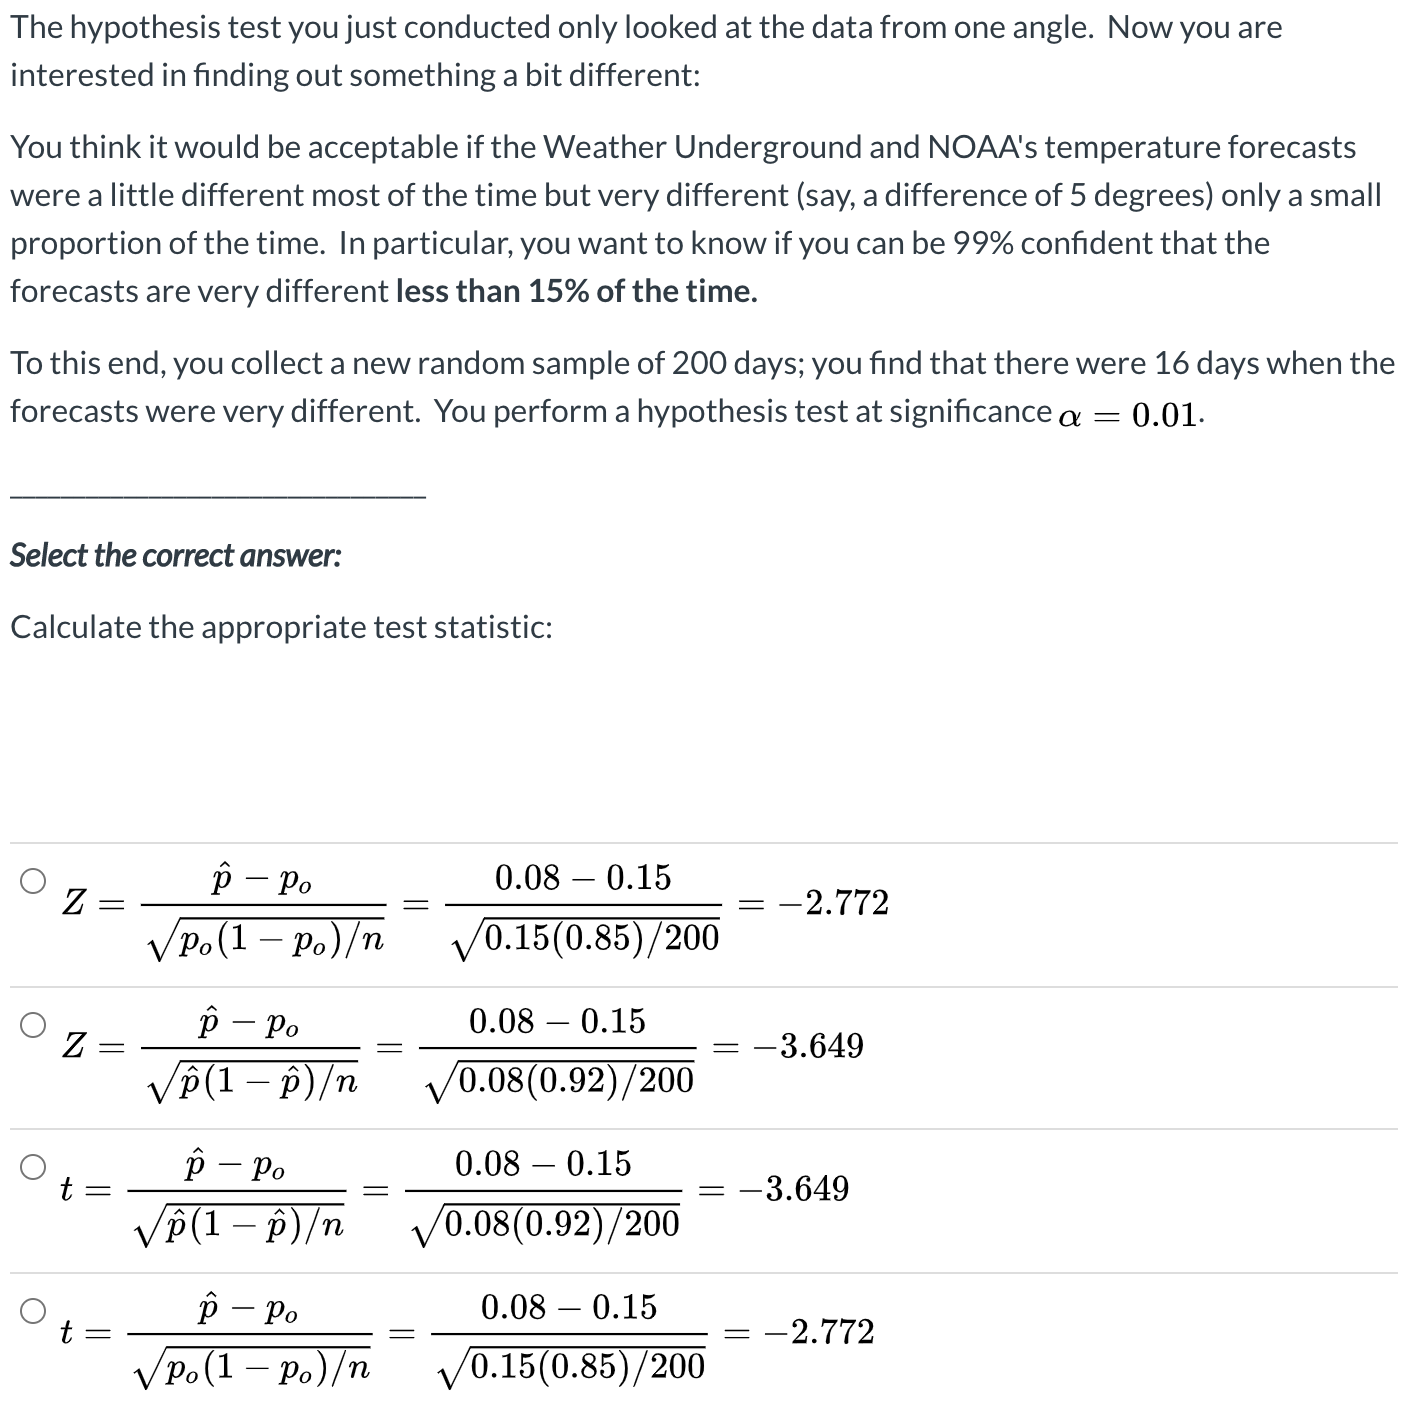
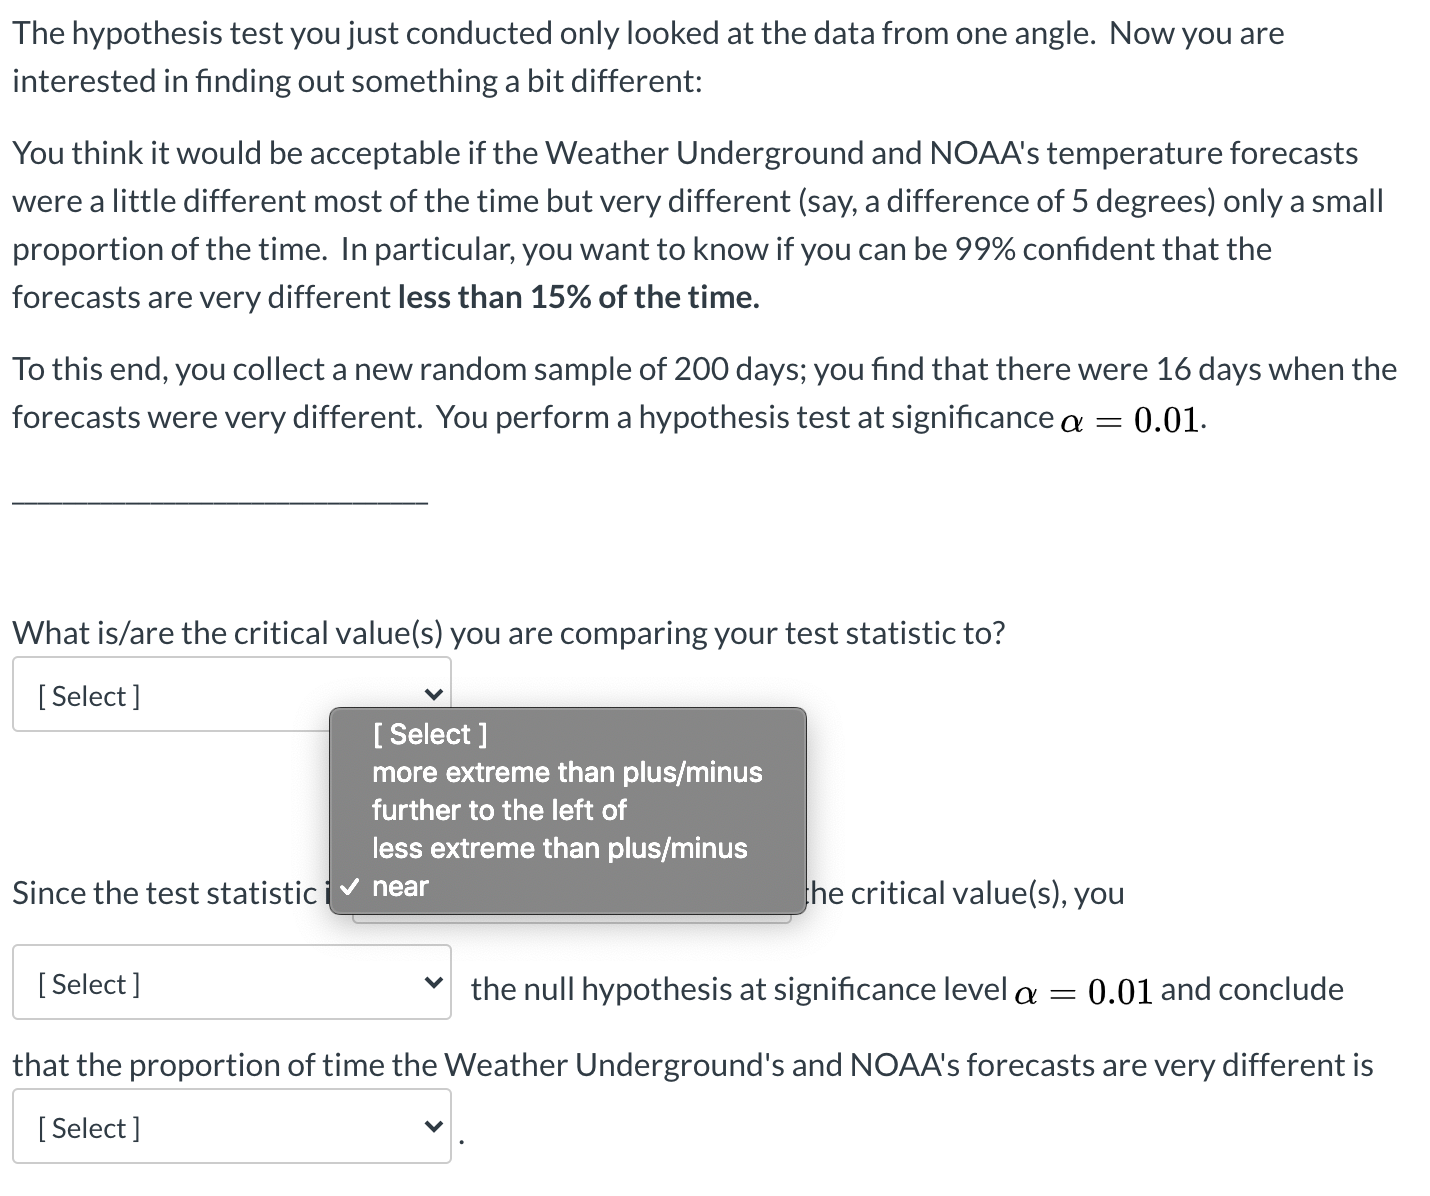
Two of the most widely used sources for daily temperature forecasts in the US are 1) the National Oceanic and Atmospheric Administration (NOAA), usually considered the most accurate source (more sophisticated equipment, more highly trained staff), and 2) the Weather Underground, which compiles and analyses data from citizen scientists to make its forecasts. As the Weather Underground's lead data scientist, you are worried that the Weather Undergrou nd's forecasts are very different from NOAA's. You decide to run an experiment in which you select 100 days from the last three years at random, and see how different each day's forecast from NCAA and the Weather Underground are. Since it is of interest not only to see whether they differ but also to quantify the difference, you decide to test your hypothesis that the Weather Underground forecasts differ from the NOAA forecasts at signicance level a: = .01 by constructing a 99% Condence Interval. Sample means and standard deviations are below. Use the ones that you need to construct a 99% Cl and conduct a hypothesis test. - EWU = 70.35, sample sd of mWU = 3.9 - :ENoAA = 68.62, sample sd of azNoAA = 5.1 . aim-ff = 1.73, sample sd of and,\" = 2.3 The hypothesis test you just conducted only looked at the data from one angle. Now you are interested in nding out something a bit different: You think it would be acceptable if the Weather Underground and NOAA's temperature forecasts were a little different most of the time but very different (say, a difference of 5 degrees) only a small proportion of the time. In particular, you want to know if you can be 99% condent that the forecasts are very different less than 15% of the time. To this end, you collect a new random sample of 200 days; you nd that there were 16 days when the forecasts were very different. You perform a hypothesis test at signicance a : 0.01. Select the correct answer: Calculate the appropriate test statistic: . .1 OZ=p PO zwzjm 2).,(1 po) 1/0.15(0.85)/200 OZ=P_p ==_3_64g t/pu 1)/'n, ./0.08(0.92)/200 ' . .1 O t : P 190 : 0 08 0 5 : 3.649 15(1 13) , /0.08(0.92)/200 Otzppo M=_2'772 100(1 Po)/'n _ ./0.15(0.85)/200 The hypothesis test you just conducted only looked at the data from one angle. Now you are interested in finding out something a bit different: You think it would be acceptable if the Weather Underground and NOAA's temperature forecasts were a little different most of the time but very different (say, a difference of 5 degrees) only a small proportion of the time. In particular, you want to know if you can be 99% confident that the forecasts are very different less than 15% of the time. To this end, you collect a new random sample of 200 days; you find that there were 16 days when the forecasts were very different. You perform a hypothesis test at significance a = 0.01. What is/are the critical value(s) you are comparing your test statistic to? [ Select ] [ Select ] more extreme than plus/minus further to the left of less extreme than plus/minus Since the test statistic v near he critical value(s), you [ Select ] V the null hypothesis at significance level a = 0.01 and conclude that the proportion of time the Weather Underground's and NOAA's forecasts are very different is [ Select ]Since the test statistic is near the critical value(s), you [ Select ] V the null hypothesis at significance level a = 0.01 and conclude that the proportion of time the Weather Underground's and NOAA's forecasts are very different is [ Select ] JUST ABOUT 0.15 MORE THAN 0.15 LESS THAN 0.15 NOT EQUAL TO 0.15


