i need help with my homework. i need short explanation and correct answer. NEED ASAP.
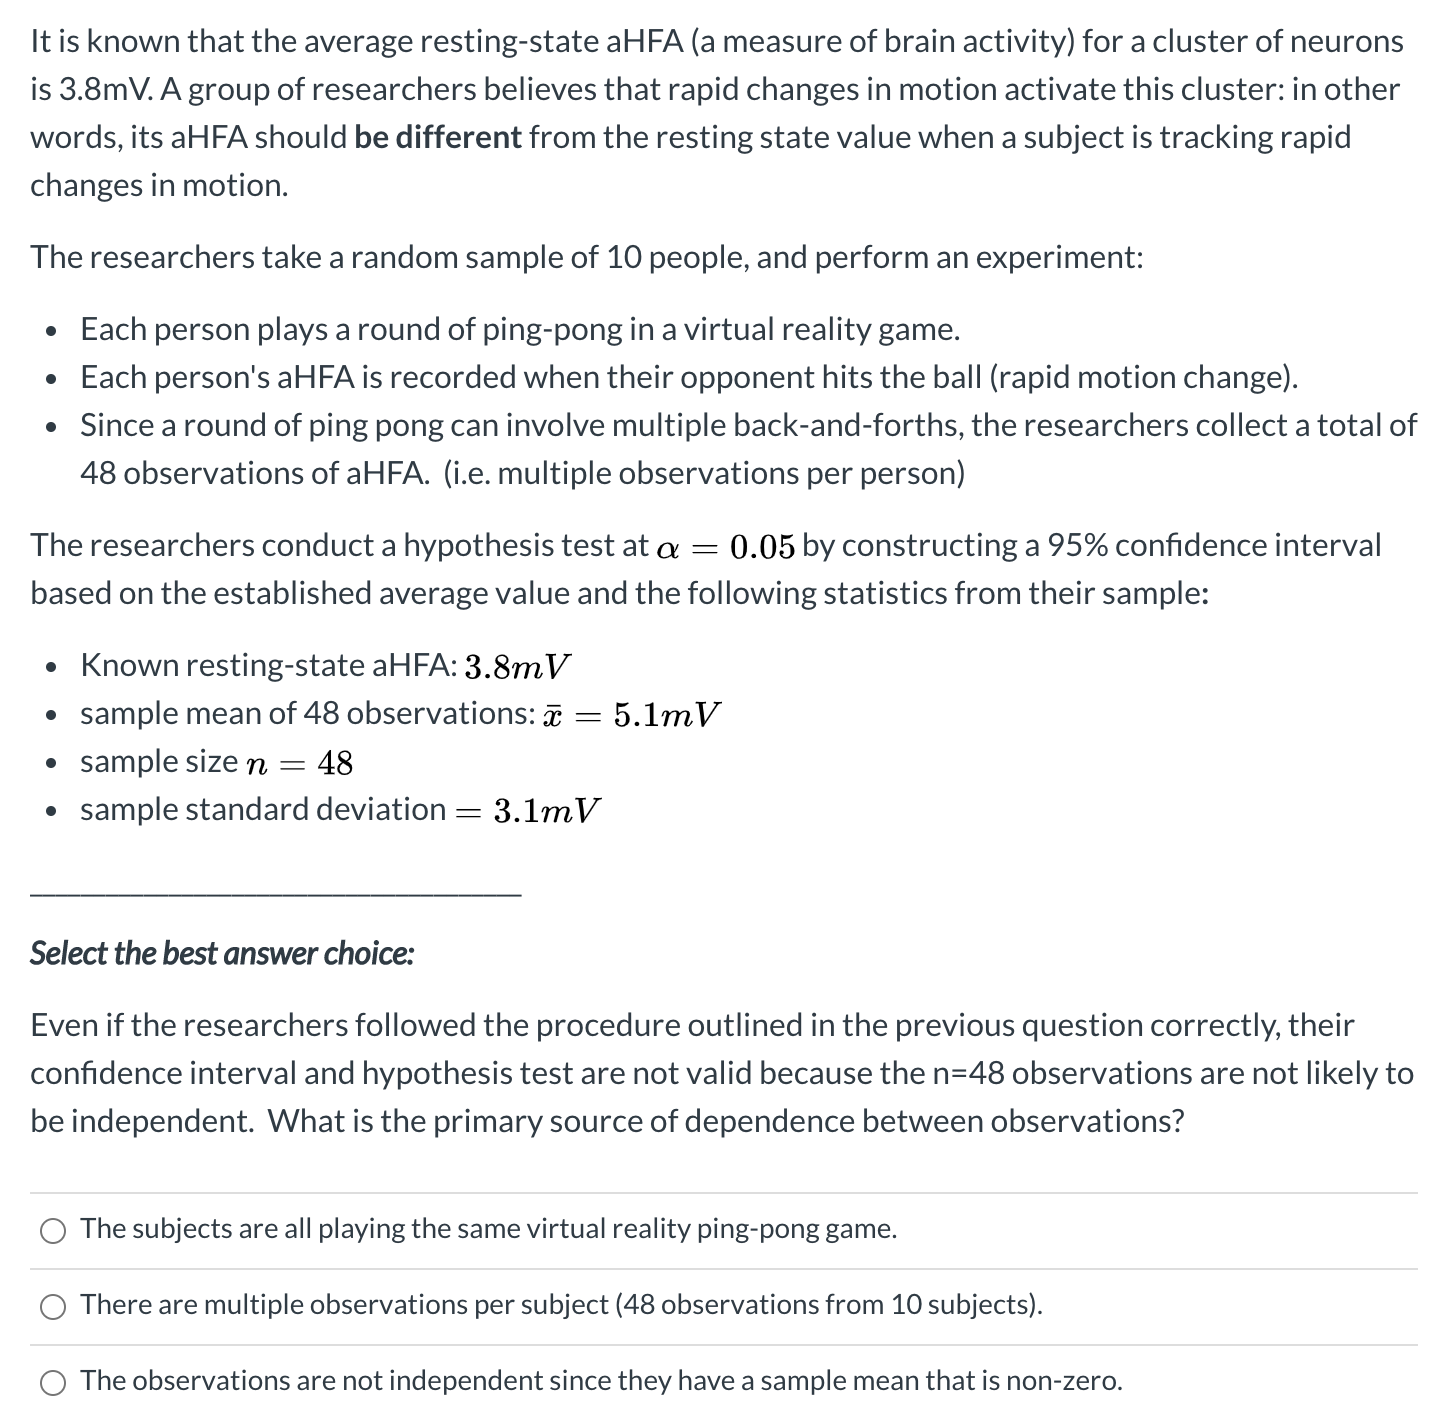
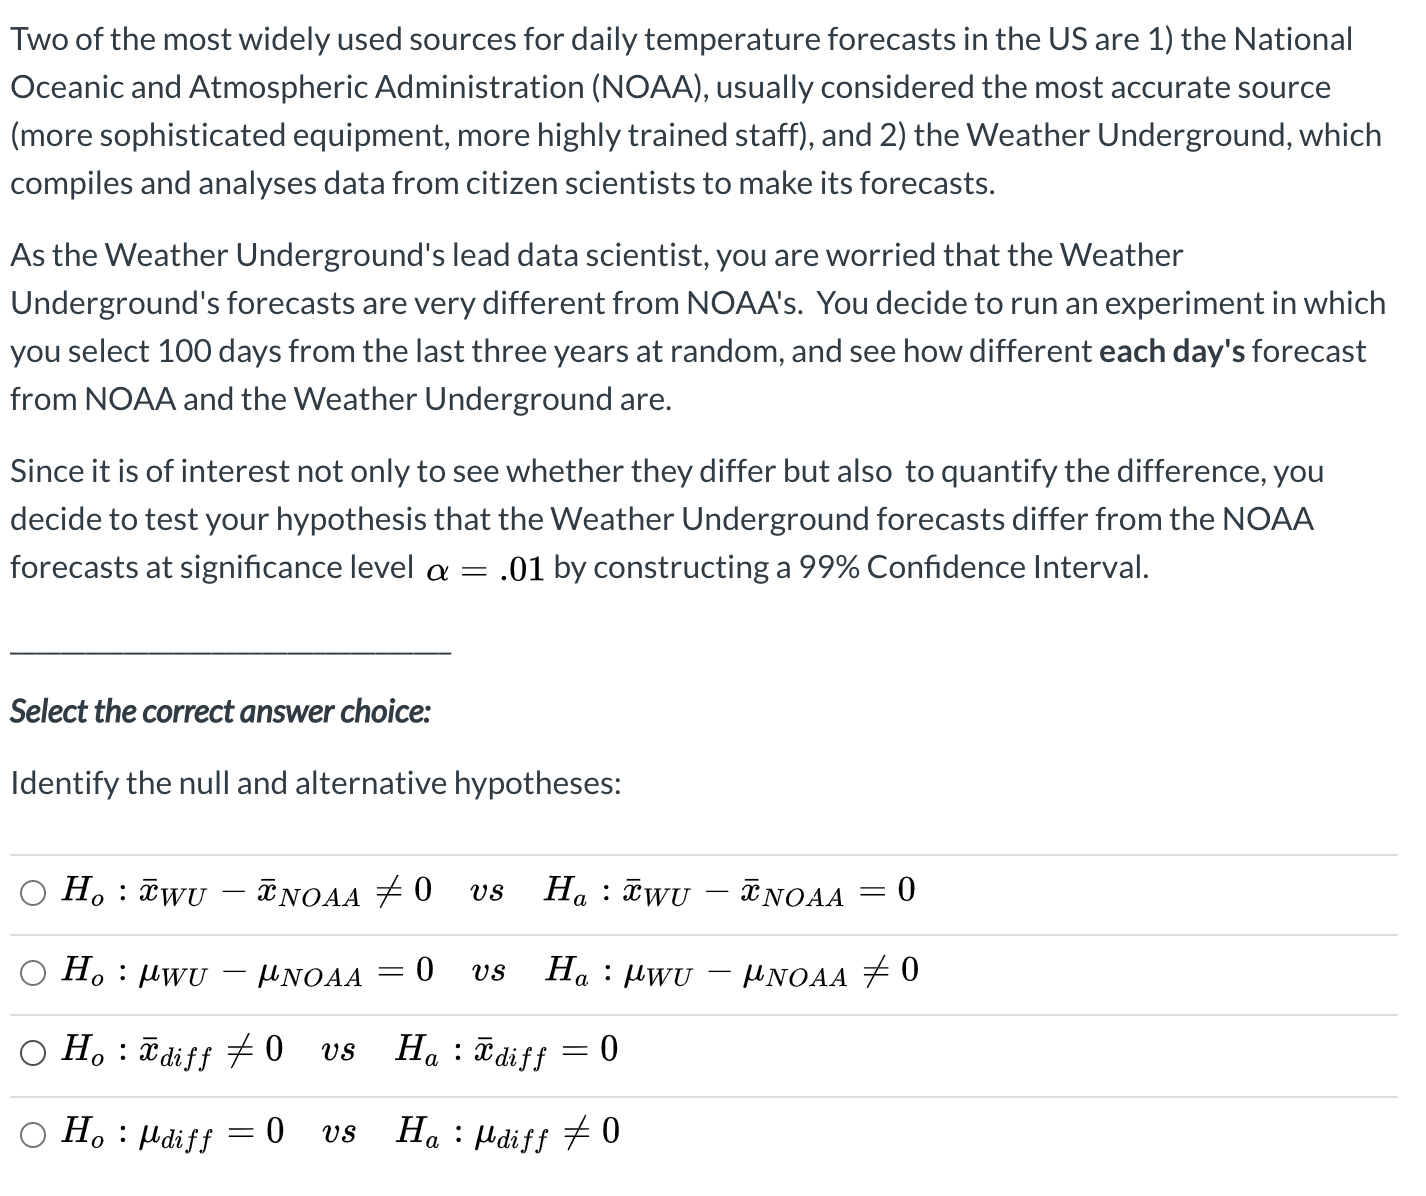
It is known that the average resting-state aHFA (a measure of brain activity) for a cluster of neurons is 3.8mV. A group of researchers believes that rapid changes in motion activate this cluster: in other words, its aH FA should be different from the resting state value when a subject is tracking rapid changes in motion. The researchers take a random sample of 10 people, and perform an experiment: . Each person plays a round of ping-pong in a virtual reality game. . Each person's aHFA is recorded when their opponent hits the ball (rapid motion change). . Since a round of ping pong can involve multiple back-and-forths, the researchers collect a total of 48 observations of aHFA. (i.e. multiple observations per person) The researchers conduct a hypothesis test at a : 0.05 by constructing a 95% condence interval based on the established average value and the following statistics from their sample: . Known resting-state aHFA: 3.8mV - sample mean of 48 observations: 5: = 5.1mV - sample size n = 48 . sample standard deviation 2 3.1mV Select the best answer choice: Even if the researchers followed the procedure outlined in the previous question correctly, their condence interval and hypothesis test are not valid because the n=48 observations are not likely to be independent. What is the primary source of dependence between observations? 0 The subjects are all playing the same virtual reality ping-pong game. 0 There are multiple observations per subject (48 observations from 10 subjects). 0 The observations are not independent since they have a sample mean that is non-zero. Two of the most widely used sources for daily temperature forecasts in the US are 1) the National Oceanic and Atmospheric Administration (NOAA), usually considered the most accurate source (more sophisticated equipment, more highly trained staff), and 2) the Weather Underground, which compiles and analyses data from citizen scientists to make its forecasts. As the Weather Underground's lead data scientist, you are worried that the Weather Undergrou nd's forecasts are very different from NOAA's. You decide to run an experiment in which you select 100 days from the last three years at random, and see how different each day's forecast from NCAA and the Weather Underground are. Since it is of interest not only to see whether they differ but also to quantify the difference, you decide to test your hypothesis that the Weather Underground forecasts differ from the NOAA forecasts at significance level a = .01 by constructing a 99% Confidence Interval. Select the correct answer choice: Identify the null and alternative hypotheses: 0 Ho 1 SEWU ENOAA 75 0 '03 Ha I EWU 573N0AA = 0 O Ho 2 MWU MNOAA = 0 Us Ha I #WU MNOAA 79 0 O HO 2 idiff 75 0 '03 Ha laidiff = 0 O HO = \"diff =0 vs Ha. :dz'ff 75 0