I need help with Part 2 the MATLAB part.
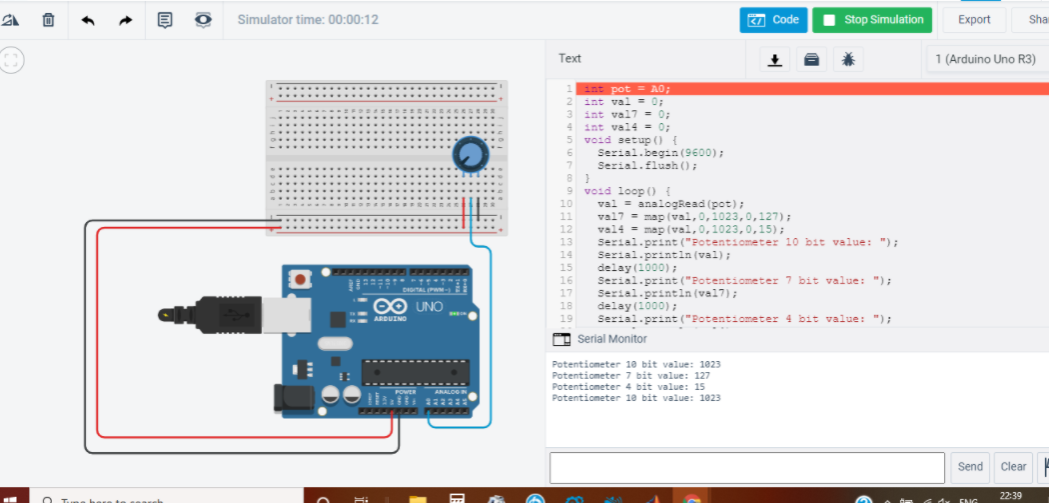
Here is the code for the for the below picture:
int pot = A0;
int val = 0;
int val7 = 0;
int val4 = 0;
void setup() {
Serial.begin(9600);
Serial.flush();
}
void loop() {
val = analogRead(pot);
val7 = map(val,0,1023,0,127);
val4 = map(val,0,1023,0,15);
Serial.print("Potentiometer 10 bit value: ");
Serial.println(val);
delay(1000);
Serial.print("Potentiometer 7 bit value: ");
Serial.println(val7);
delay(1000);
Serial.print("Potentiometer 4 bit value: ");
Serial.println(val4);
delay(1000);
}
I need help with PART 2 all the way down, using Part 1
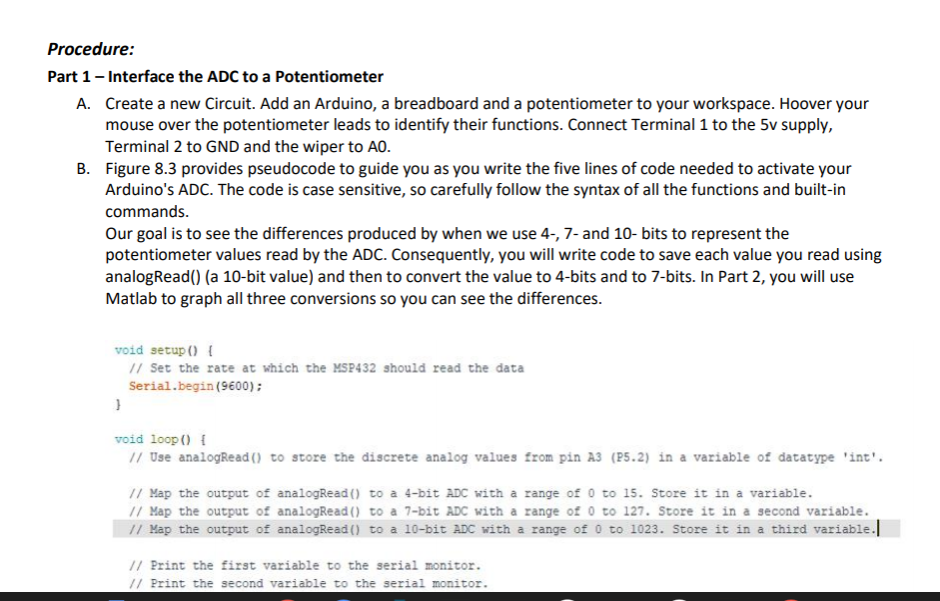
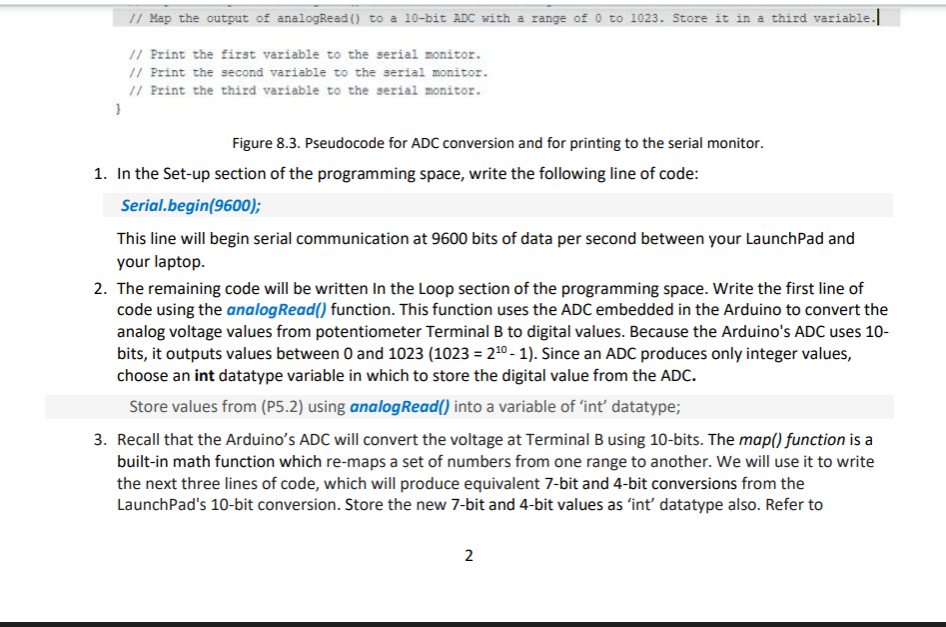
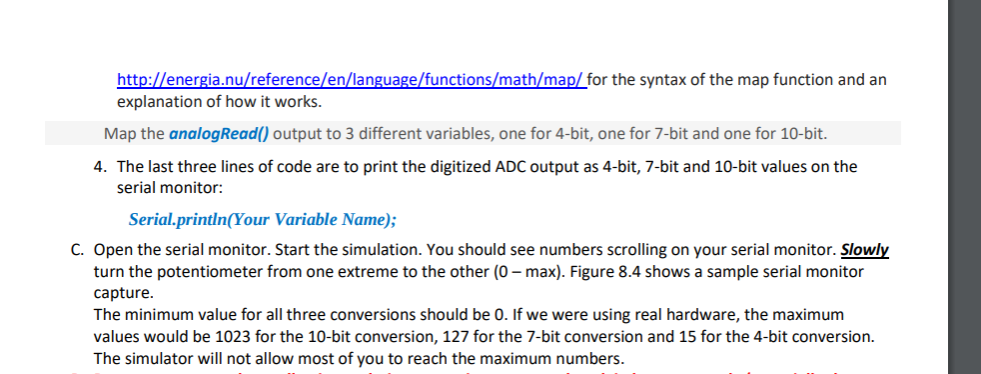

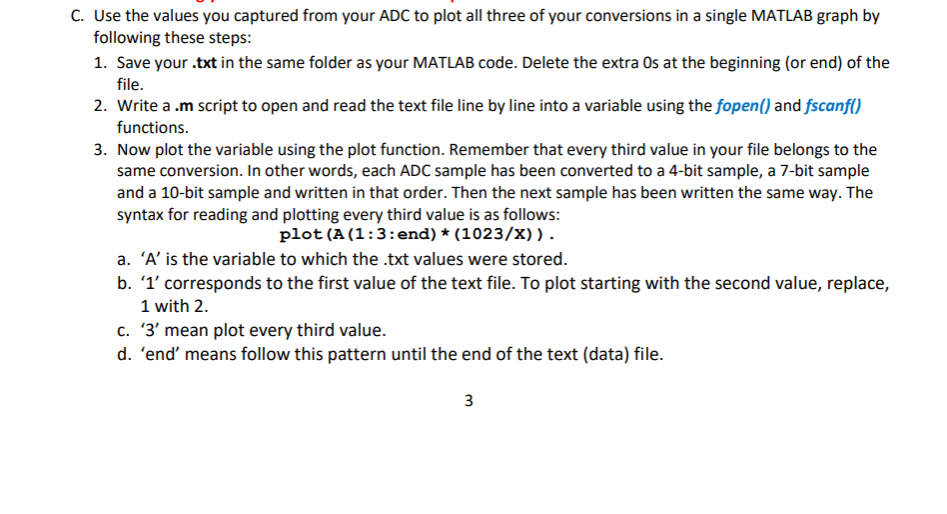
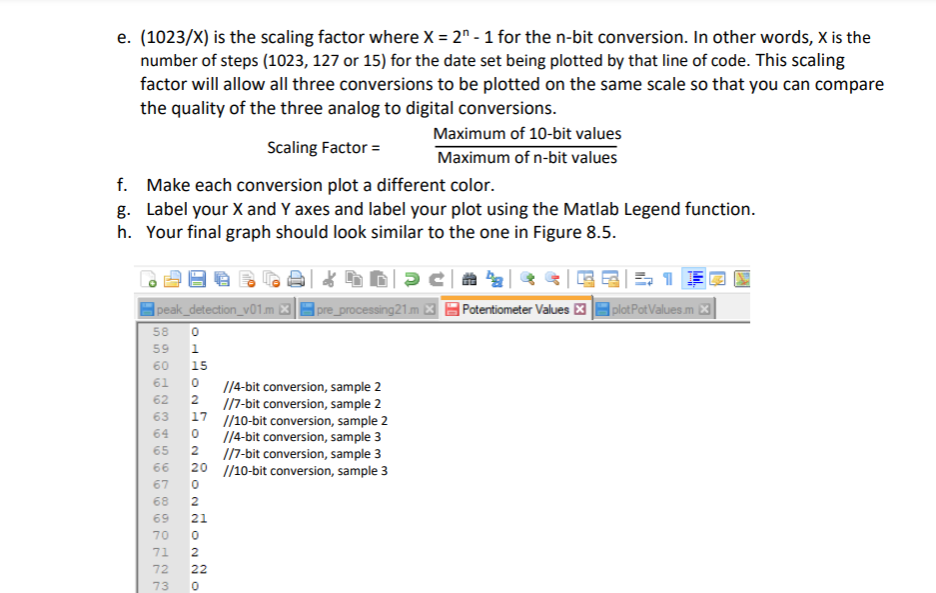

Procedure: Part 1 - Interface the ADC to a Potentiometer A. Create a new Circuit. Add an Arduino, a breadboard and a potentiometer to your workspace. Hoover your mouse over the potentiometer leads to identify their functions. Connect Terminal 1 to the 5v supply, Terminal 2 to GND and the wiper to A. B. Figure 8.3 provides pseudocode to guide you as you write the five lines of code needed to activate your Arduino's ADC. The code is case sensitive, so carefully follow the syntax of all the functions and built-in commands. Our goal is to see the differences produced by when we use 4., 7- and 10-bits to represent the potentiometer values read by the ADC. Consequently, you will write code to save each value you read using analogRead() (a 10-bit value) and then to convert the value to 4-bits and to 7-bits. In Part 2, you will use Matlab to graph all three conversions so you can see the differences. void setup() { // Set the rate at which the MSP432 should read the data Serial.begin(9600); } void loop() { // Use analogRead() to store the discrete analog values from pin A3 (P5.2) in a variable of datatype 'int'. // Map the output of analogRead() to a 4-bit ADC with a range of 0 to 15. Store it in a variable. // Map the output of analogRead() to a 7-bit ADC with a range of 0 to 127. Store it in a second variable. 1/ Map the output of analogRead() to a 10-bit ADC with a range of 0 to 1023. Store it in a third variable. // Print the first variable to the serial monitor. // Print the second variable to the serial monitor. // Map the output of analogRead() to a 10-bit ADC with a range of 0 to 1023. Store it in a third variable. // Print the first variable to the serial monitor. // Print the second variable to the serial monitor. // Print the third variable to the serial monitor. } Figure 8.3. Pseudocode for ADC conversion and for printing to the serial monitor. 1. In the Set-up section of the programming space, write the following line of code: Serial.begin(9600); This line will begin serial communication at 9600 bits of data per second between your LaunchPad and your laptop 2. The remaining code will be written in the Loop section of the programming space. Write the first line of code using the analogRead() function. This function uses the ADC embedded in the Arduino to convert the analog voltage values from potentiometer Terminal B to digital values. Because the Arduino's ADC uses 10- bits, it outputs values between 0 and 1023 (1023 = 220 - 1). Since an ADC produces only integer values, choose an int datatype variable in which to store the digital value from the ADC. Store values from (P5.2) using analogRead() into a variable of fint datatype; 3. Recall that the Arduino's ADC will convert the voltage at Terminal B using 10-bits. The map() function is a built-in math function which re-maps a set of numbers from one range to another. We will use it to write the next three lines of code, which will produce equivalent 7-bit and 4-bit conversions from the LaunchPad's 10-bit conversion. Store the new 7-bit and 4-bit values as 'int' datatype also. Refer to 2 http://energia.nu/reference/en/language/functions/math/map/ for the syntax of the map function and an explanation of how it works. Map the analogRead() output to 3 different variables, one for 4-bit, one for 7-bit and one for 10-bit. 4. The last three lines of code are to print the digitized ADC output as 4-bit, 7-bit and 10-bit values on the serial monitor: Serial.println(Your Variable Name); C. Open the serial monitor. Start the simulation. You should see numbers scrolling on your serial monitor. Slowly turn the potentiometer from one extreme to the other (0 - max). Figure 8.4 shows a sample serial monitor capture. The minimum value for all three conversions should be 0. If we were using real hardware, the maximum values would be 1023 for the 10-bit conversion, 127 for the 7-bit conversion and 15 for the 4-bit conversion. The simulator will not allow most of you to reach the maximum numbers. Simulator time: 00:00:12 37 Code Stop Simulation Export Sha Text 1 (Arduino Uno R3) int pot = 10; 2 int val = 0; 3 int val7 = 0; 4 int val4 = 0; 5 void setup() { 6 Serial.begin(9600); 7 Serial. flush(); 8) 9 void loop() ! 10 val = analogRead(pet); 11 val7 = map (val, 0,1023,0,127); 12 val4 = map (val,0, 1023, 0,15); 13 Serial.print("Potentiometer 10 bit value: "); 14 Serial.println(val); 15 delay(1000); 16 Serial.print("Potentiometer 7 bit value: "); 17 Serial.println(val); 16 delay(1000); 19 Serial.print("Potentiometer 4 bit value: "); Serial Monitor O UNO ARDUINO Potentiometer 10 bit value: 1023 Potentiometer 7 bit value: 127 Potentiometer 4 bit value: 15 Potentiometer 10 bit value: 1023 13.1222223 Send Clear 22:39 ENG Part 2 - Analyze the Data A. Calculate the step size for each of your conversions: 10-bit step = Vc/1024 = 7-bit step = Vcc/128 = 4-bit step = Vcd/16 = C. Use the values you captured from your ADC to plot all three of your conversions in a single MATLAB graph by following these steps: 1. Save your .txt in the same folder as your MATLAB code. Delete the extra Os at the beginning (or end) of the file. 2. Write a .m script to open and read the text file line by line into a variable using the fopen() and fscanf() functions. 3. Now plot the variable using the plot function. Remember that every third value in your file belongs to the same conversion. In other words, each ADC sample has been converted to a 4-bit sample, a 7-bit sample and a 10-bit sample and written in that order. Then the next sample has been written the same way. The syntax for reading and plotting every third value is as follows: plot (A(1:3:end) * (1023/x)). a. 'A' is the variable to which the .txt values were stored. b. 'l' corresponds to the first value of the text file. To plot starting with the second value, replace, 1 with 2. C. '3' mean plot every third value. d. 'end' means follow this pattern until the end of the text (data) file. 3 e. (1023/X) is the scaling factor where X = 2" - 1 for the n-bit conversion. In other words, X is the number of steps (1023, 127 or 15) for the date set being plotted by that line of code. This scaling factor will allow all three conversions to be plotted on the same scale so that you can compare the quality of the three analog to digital conversions. Maximum of 10-bit values Scaling Factor = Maximum of n-bit values f. Make each conversion plot a different color. g. Label your X and Y axes and label your plot using the Matlab Legend function. h. Your final graph should look similar to the one in Figure 8.5. DC peak_detection_v01.m pre_processing21m > Potentiometer Values >> plotPotValues.mx 0 1 15 0 1/4-bit conversion, sample 2 2 1/7-bit conversion, sample 2 17 1/10-bit conversion, sample 2 0 1/4-bit conversion, sample 3 2 1/7-bit conversion, sample 3 20 l/10-bit conversion, sample 3 0 58 59 60 61 62 63 64 65 66 67 68 69 70 71 72 73 ON 2 21 2 22 D. Answer the following questions. 1. Which conversion yields the smoothest curve? 2. Which conversion yields the most blocky curve? 3. The more bits we use in an ADC, the more expensive it is. Which of your curves looks like the best choice in a trade-off between a smooth curve and cost? Procedure: Part 1 - Interface the ADC to a Potentiometer A. Create a new Circuit. Add an Arduino, a breadboard and a potentiometer to your workspace. Hoover your mouse over the potentiometer leads to identify their functions. Connect Terminal 1 to the 5v supply, Terminal 2 to GND and the wiper to A. B. Figure 8.3 provides pseudocode to guide you as you write the five lines of code needed to activate your Arduino's ADC. The code is case sensitive, so carefully follow the syntax of all the functions and built-in commands. Our goal is to see the differences produced by when we use 4., 7- and 10-bits to represent the potentiometer values read by the ADC. Consequently, you will write code to save each value you read using analogRead() (a 10-bit value) and then to convert the value to 4-bits and to 7-bits. In Part 2, you will use Matlab to graph all three conversions so you can see the differences. void setup() { // Set the rate at which the MSP432 should read the data Serial.begin(9600); } void loop() { // Use analogRead() to store the discrete analog values from pin A3 (P5.2) in a variable of datatype 'int'. // Map the output of analogRead() to a 4-bit ADC with a range of 0 to 15. Store it in a variable. // Map the output of analogRead() to a 7-bit ADC with a range of 0 to 127. Store it in a second variable. 1/ Map the output of analogRead() to a 10-bit ADC with a range of 0 to 1023. Store it in a third variable. // Print the first variable to the serial monitor. // Print the second variable to the serial monitor. // Map the output of analogRead() to a 10-bit ADC with a range of 0 to 1023. Store it in a third variable. // Print the first variable to the serial monitor. // Print the second variable to the serial monitor. // Print the third variable to the serial monitor. } Figure 8.3. Pseudocode for ADC conversion and for printing to the serial monitor. 1. In the Set-up section of the programming space, write the following line of code: Serial.begin(9600); This line will begin serial communication at 9600 bits of data per second between your LaunchPad and your laptop 2. The remaining code will be written in the Loop section of the programming space. Write the first line of code using the analogRead() function. This function uses the ADC embedded in the Arduino to convert the analog voltage values from potentiometer Terminal B to digital values. Because the Arduino's ADC uses 10- bits, it outputs values between 0 and 1023 (1023 = 220 - 1). Since an ADC produces only integer values, choose an int datatype variable in which to store the digital value from the ADC. Store values from (P5.2) using analogRead() into a variable of fint datatype; 3. Recall that the Arduino's ADC will convert the voltage at Terminal B using 10-bits. The map() function is a built-in math function which re-maps a set of numbers from one range to another. We will use it to write the next three lines of code, which will produce equivalent 7-bit and 4-bit conversions from the LaunchPad's 10-bit conversion. Store the new 7-bit and 4-bit values as 'int' datatype also. Refer to 2 http://energia.nu/reference/en/language/functions/math/map/ for the syntax of the map function and an explanation of how it works. Map the analogRead() output to 3 different variables, one for 4-bit, one for 7-bit and one for 10-bit. 4. The last three lines of code are to print the digitized ADC output as 4-bit, 7-bit and 10-bit values on the serial monitor: Serial.println(Your Variable Name); C. Open the serial monitor. Start the simulation. You should see numbers scrolling on your serial monitor. Slowly turn the potentiometer from one extreme to the other (0 - max). Figure 8.4 shows a sample serial monitor capture. The minimum value for all three conversions should be 0. If we were using real hardware, the maximum values would be 1023 for the 10-bit conversion, 127 for the 7-bit conversion and 15 for the 4-bit conversion. The simulator will not allow most of you to reach the maximum numbers. Simulator time: 00:00:12 37 Code Stop Simulation Export Sha Text 1 (Arduino Uno R3) int pot = 10; 2 int val = 0; 3 int val7 = 0; 4 int val4 = 0; 5 void setup() { 6 Serial.begin(9600); 7 Serial. flush(); 8) 9 void loop() ! 10 val = analogRead(pet); 11 val7 = map (val, 0,1023,0,127); 12 val4 = map (val,0, 1023, 0,15); 13 Serial.print("Potentiometer 10 bit value: "); 14 Serial.println(val); 15 delay(1000); 16 Serial.print("Potentiometer 7 bit value: "); 17 Serial.println(val); 16 delay(1000); 19 Serial.print("Potentiometer 4 bit value: "); Serial Monitor O UNO ARDUINO Potentiometer 10 bit value: 1023 Potentiometer 7 bit value: 127 Potentiometer 4 bit value: 15 Potentiometer 10 bit value: 1023 13.1222223 Send Clear 22:39 ENG Part 2 - Analyze the Data A. Calculate the step size for each of your conversions: 10-bit step = Vc/1024 = 7-bit step = Vcc/128 = 4-bit step = Vcd/16 = C. Use the values you captured from your ADC to plot all three of your conversions in a single MATLAB graph by following these steps: 1. Save your .txt in the same folder as your MATLAB code. Delete the extra Os at the beginning (or end) of the file. 2. Write a .m script to open and read the text file line by line into a variable using the fopen() and fscanf() functions. 3. Now plot the variable using the plot function. Remember that every third value in your file belongs to the same conversion. In other words, each ADC sample has been converted to a 4-bit sample, a 7-bit sample and a 10-bit sample and written in that order. Then the next sample has been written the same way. The syntax for reading and plotting every third value is as follows: plot (A(1:3:end) * (1023/x)). a. 'A' is the variable to which the .txt values were stored. b. 'l' corresponds to the first value of the text file. To plot starting with the second value, replace, 1 with 2. C. '3' mean plot every third value. d. 'end' means follow this pattern until the end of the text (data) file. 3 e. (1023/X) is the scaling factor where X = 2" - 1 for the n-bit conversion. In other words, X is the number of steps (1023, 127 or 15) for the date set being plotted by that line of code. This scaling factor will allow all three conversions to be plotted on the same scale so that you can compare the quality of the three analog to digital conversions. Maximum of 10-bit values Scaling Factor = Maximum of n-bit values f. Make each conversion plot a different color. g. Label your X and Y axes and label your plot using the Matlab Legend function. h. Your final graph should look similar to the one in Figure 8.5. DC peak_detection_v01.m pre_processing21m > Potentiometer Values >> plotPotValues.mx 0 1 15 0 1/4-bit conversion, sample 2 2 1/7-bit conversion, sample 2 17 1/10-bit conversion, sample 2 0 1/4-bit conversion, sample 3 2 1/7-bit conversion, sample 3 20 l/10-bit conversion, sample 3 0 58 59 60 61 62 63 64 65 66 67 68 69 70 71 72 73 ON 2 21 2 22 D. Answer the following questions. 1. Which conversion yields the smoothest curve? 2. Which conversion yields the most blocky curve? 3. The more bits we use in an ADC, the more expensive it is. Which of your curves looks like the best choice in a trade-off between a smooth curve and cost


