

Question: I need help with question #4. I have attached the graphs and answers for number 1-3. Data Table 1. #1 #2 #3 Mass of KHP
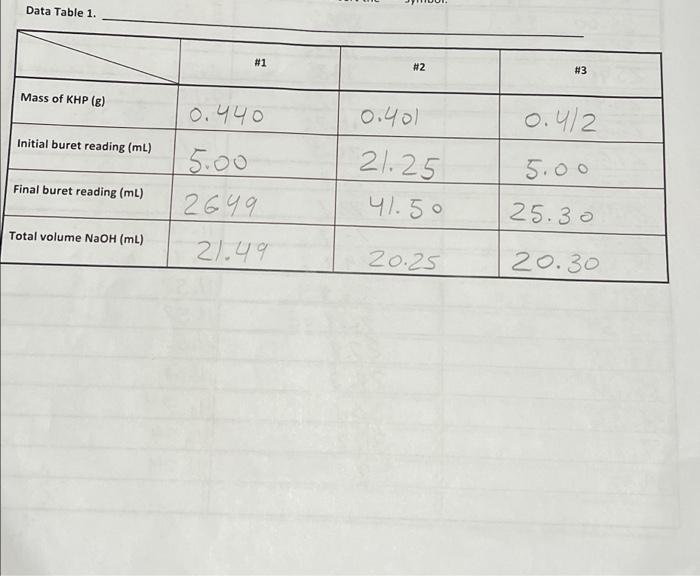
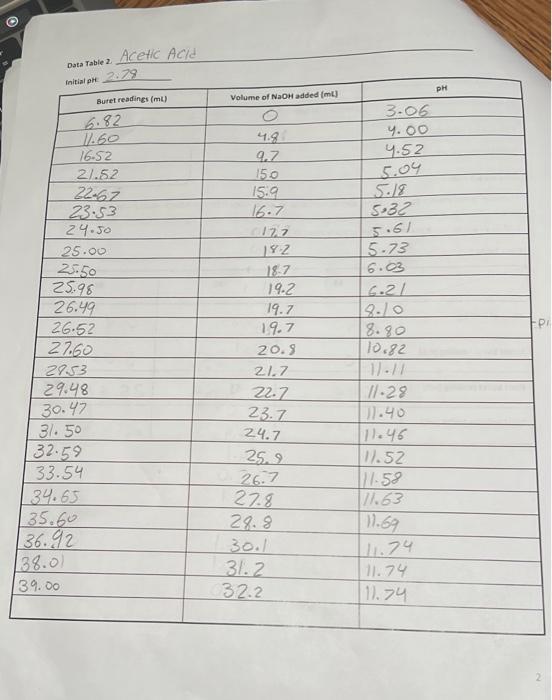
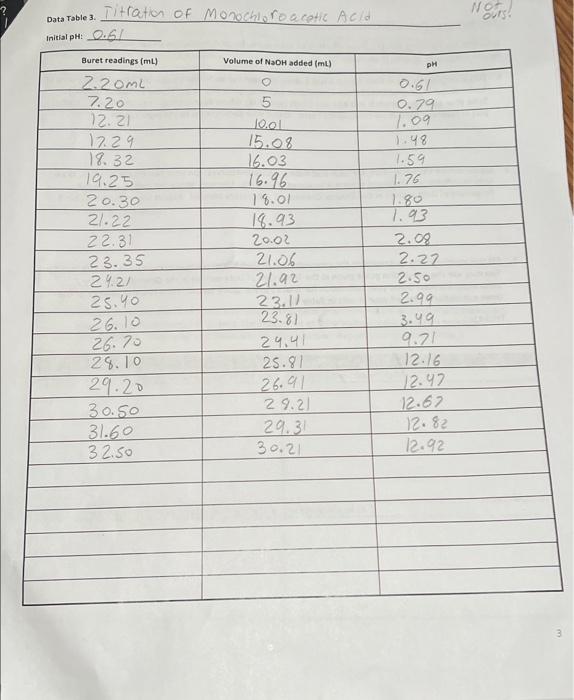
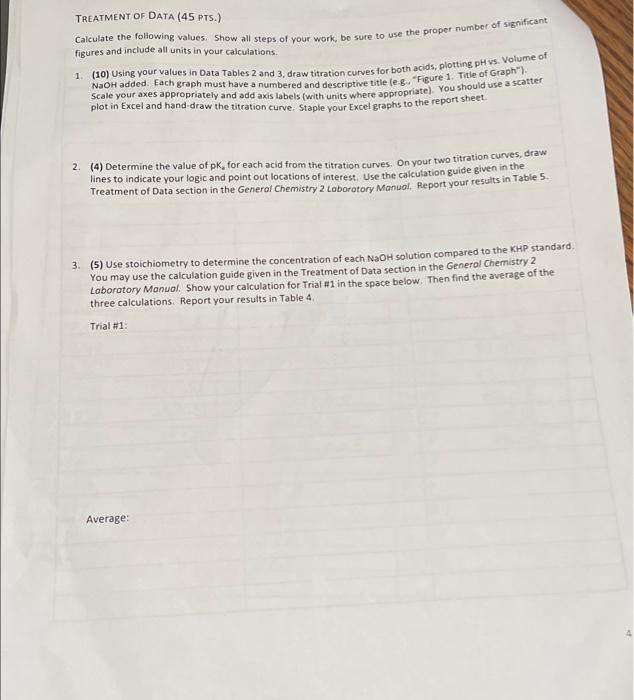
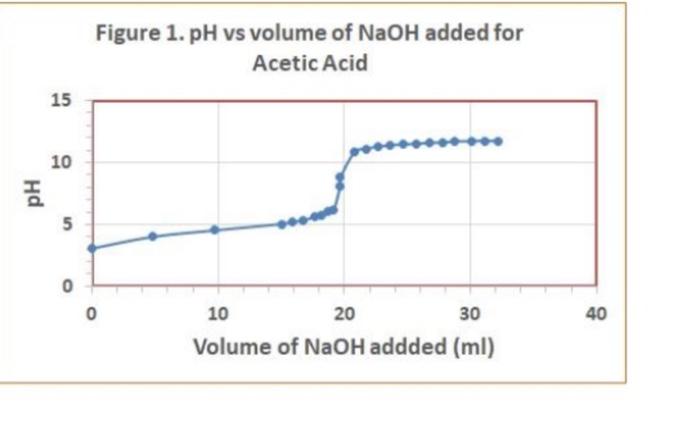
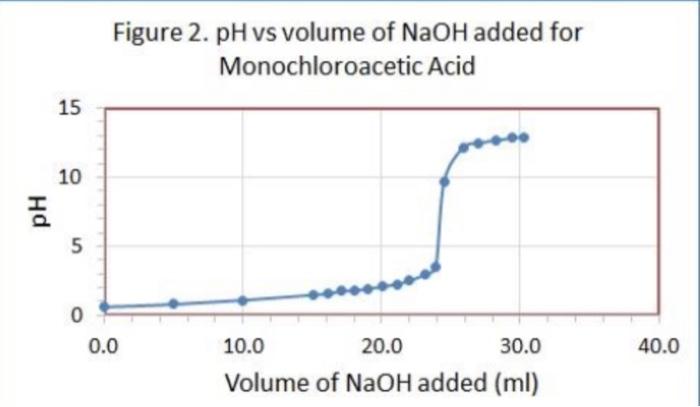
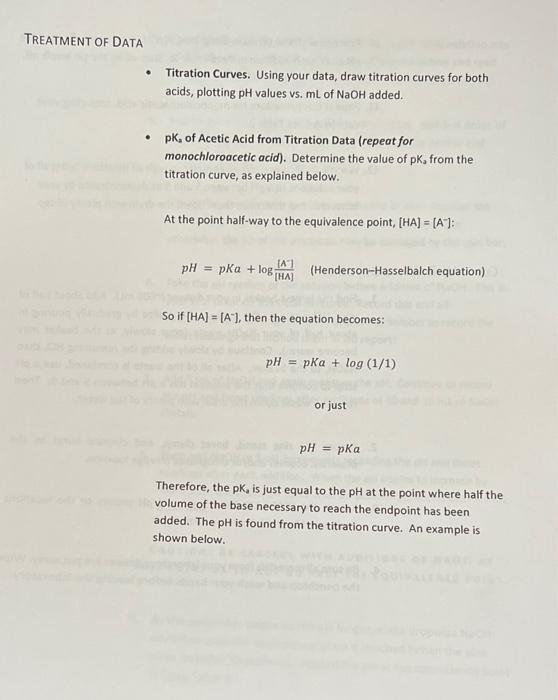
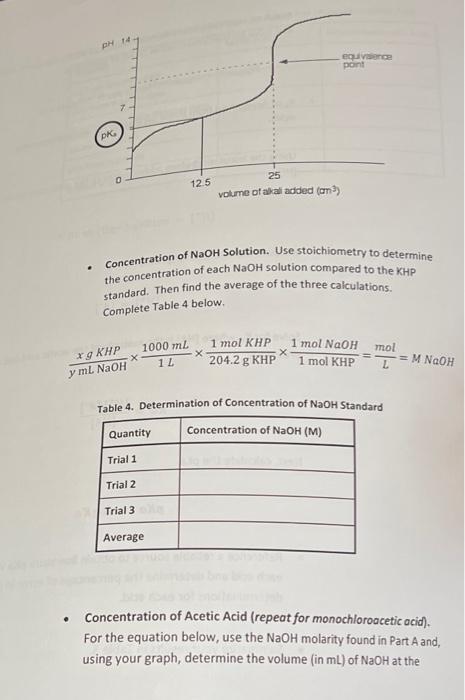
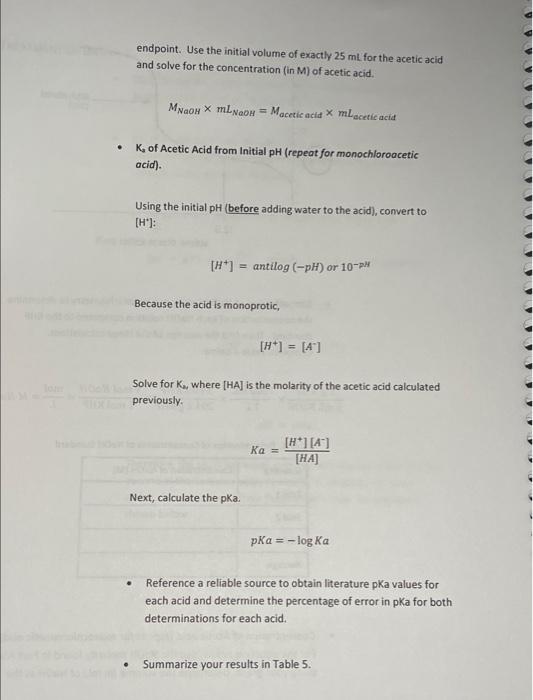
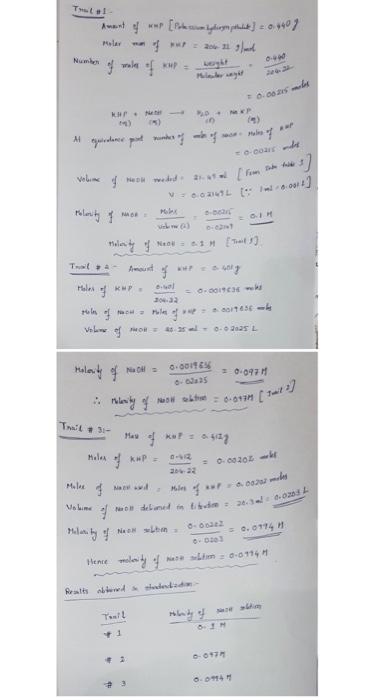
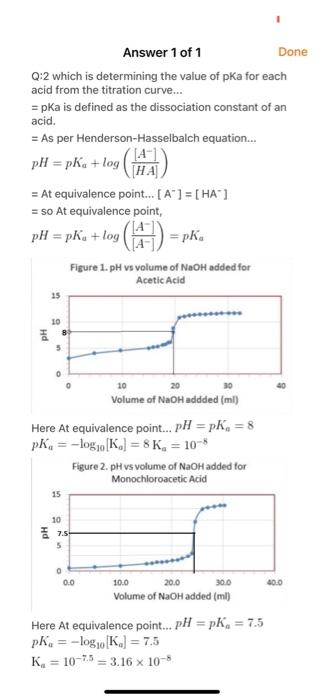
Data Table 1. #1 #2 #3 Mass of KHP (6) 0.440 0.401 0.4/2 Initial buret reading (ml) 5.00 Final buret reading (ml) 5.00 2649 21.49 21.25 41.50 25.30 Total volume NaOH (ml) 20.25 20.30 Acetic Acid Data Table 2 Initial p 2.29 PH Buret readings (ml) Volume of NaOH added (ml) 6.82 3.06 4.00 4.52 9.7 150 15.9 16.7 5.18 5:32 5.61 5.73 6.21 8.80 10.82 11.60 16.52 21.52 22.67 23.53 24.50 25.00 25.50 25.98 26.49 26.52 27.60 2753 29.48 30.47 31. 50 132.59 33.54 34.65 135.60 36.92 138.00 39.00 182 18.7 19.2 19.7 19.7 20.5 21.7 22.7 23.7 24.7 25.2 26.7 27.8 28.8 30.1 31.2 32.2 // -29 11.40 [11.46 W.52 177.58 17.63 11.69 111.74 11.74 111.74 Titration of Monochloroacetic Acid Noors Data Table 3. Initial pH: 0.6/ Volume of NaOH added (ml) Buret readings (ml) 2.20ML 7.20 12.21 17.29 18.32 19.25 20.30 21.22 22.31 23.35 24.21 25. 26.10 26.70 28.10 29.20 30.50 31.60 32.50 5 Jool 15.08 16.03 16.96 18.01 18.93 20.02 21.06 21.92 23.11 23.81 29.41 25.81 26.91 29.21 29.31 30.21 pH O.GL 0.79 1.09 1.48 1.59 1.76 1.80 1.93 2.08 2.27 2.50 2.99 3.49 9.21 12.16 12.47 12.67 12.82 12.92 3 TREATMENT OF DATA (45 pts.) Calculate the following values Show all steps of your work, be sure to use the proper number of significant figures and include all units in your calculations. 1. (10) using your values in Data Tables 2 and 3. draw titration curves for both acids, plotting pH vs Volume of NaOH added. Each graph must have a numbered and catscriptive title les. Figure 1. Tale of Graph Scale your axes appropriately and add as botes with leses where appropriate). You should use a scatter plot in Excel and hand-draw the titration curve Staple your Excel graphs to the report sheet 2. (4) Determine the value of pK, for each acid from the titration curves. On your two titration curves, draw lines to indicate your logic and point out locations of interest. Use the calculation guide given in the Treatment of Data section in the General Chemistry 2 Laboratory Manual Report your results in Table 5. 3. (5) Use stoichiometry to determine the concentration of each NaOH solution compared to the KHP standard. You may use the calculation guide given in the Treatment of Data section in the General Chemistry 2 Laboratory Manual. Show your calculation for Trial #1 in the space below. Then find the average of the three calculations. Report your results in Table 4. Trial #1: Average: Figure 1. pH vs volume of NaOH added for Acetic Acid 15 10 Hd 5 0 0 20 40 10 30 Volume of NaOH addded (ml) Figure 2. pH vs volume of NaOH added for Monochloroacetic Acid 15 10 Hd 5 5 O 0 0.0 40.0 10.0 20.0 30.0 Volume of NaOH added (ml) TREATMENT OF DATA Titration Curves. Using your data, draw titration curves for both acids, plotting pH values vs. mL of NaOH added. pk, of Acetic Acid from Titration Data (repeat for monochloroacetic acid). Determine the value of pK, from the titration curve, as explained below. At the point half-way to the equivalence point, [HA] = [A]: pH = pka + log THAI IA) (Henderson-Hasselbalch equation) So if [HA] = [A"), then the equation becomes: pH = pka + log (1/1) or just pH = pka Therefore, the pK, is just equal to the pH at the point where half the volume of the base necessary to reach the endpoint has been added. The pH is found from the titration curve. An example is shown below H 14 epulce point PK 125 25 volume of alkali added (on) . Concentration of NaOH Solution. Use stoichiometry to determine the concentration of each NaOH solution compared to the KHP standard. Then find the average of the three calculations. Complete Table 4 below 1000 ml 11 xg KHP y ml. NaOH 1 mol KHP 204.2 g KHP 1 mol NaOH 1 mol KHP mol L M NaOH Table 4. Determination of Concentration of NaOH Standard Concentration of NaOH (M) Quantity Trial 1 Trial 2 Trial 3 Average . Concentration of Acetic Acid (repeat for monochloroacetic acid). For the equation below, use the NaOH molarity found in Part A and, using your graph, determine the volume (in ml) of NaOH at the d endpoint. Use the initial volume of exactly 25 ml for the acetic acid and solve for the concentration (in M) of acetic acid. MNOH X ml NaOH = Macetic acid * mLacetic acid . K of Acetic Acid from Initial pH (repeat for monochloroacetic acid). Using the initial pH before adding water to the acid), convert to [H]: [+] = antilog (pH) or 10- Because the acid is monoprotic, [H+] = [4] Solve for K., where [HA] is the molarity of the acetic acid calculated previously Ka = [H][A] [HA] Next, calculate the pka. pka = -log Ka Reference a reliable source to obtain literature pka values for each acid and determine the percentage of error in pka for both determinations for each acid. Summarize your results in Table 5. Total want w [Borkum litums) 2007 - 2011 walero Hola Number - 0.00 kut- f polis o.com van wed the +] 0.021471.00] vik) Folosity of Mice tularity of now aim (als - Am f 9 mode Valo 42-2.25L Holes KWP . 03 = o. DOCH | 16- 0.001165 0.25 -0.097 Helesily Musly for boe0-07 [tex3] Trail 31- Mhes kuta 447 Mele KP 06202 Minas well Volim dela = 2.0.0 News 0.00 = 0.0174H Maliby Hence molenity of L0-0114 Bratis Tsalt ring of salta SH --07 0.04 Answer 1 of 1 Done Q:2 which is determining the value of pKa for each acid from the titration curve... = pka is defined as the dissociation constant of an acid. = As per Henderson-Hasselbalch equation... pH = pka + log (4) (HA = At equivalence point... [ A ] = [HA] = so At equivalence point, pH = pku +10g (4-1) = pke + Figure 1. pH vs volume of NaOH added for Acetic Acid 15 10 5 5 Volume of NaOH addded (ml) Here At equivalence point... pH = pk, = 8 pk = -log10K.] = 8 K. = 10-8 Figure 2. pH vs volume of NaOH added for Monochloroacetic Acid 15 10 7.5- 5 0 0.0 10.0 20.0 30.0 400 Volume of NaOH added (ml) Here At equivalence point... pH = pk. = 7.5 pk = -log, K.] = 7.5 K. = 10-75 = 3.16 x 10⁻⁵ Data Table 1. #1 #2 #3 Mass of KHP (6) 0.440 0.401 0.4/2 Initial buret reading (ml) 5.00 Final buret reading (ml) 5.00 2649 21.49 21.25 41.50 25.30 Total volume NaOH (ml) 20.25 20.30 Acetic Acid Data Table 2 Initial p 2.29 PH Buret readings (ml) Volume of NaOH added (ml) 6.82 3.06 4.00 4.52 9.7 150 15.9 16.7 5.18 5:32 5.61 5.73 6.21 8.80 10.82 11.60 16.52 21.52 22.67 23.53 24.50 25.00 25.50 25.98 26.49 26.52 27.60 2753 29.48 30.47 31. 50 132.59 33.54 34.65 135.60 36.92 138.00 39.00 182 18.7 19.2 19.7 19.7 20.5 21.7 22.7 23.7 24.7 25.2 26.7 27.8 28.8 30.1 31.2 32.2 // -29 11.40 [11.46 W.52 177.58 17.63 11.69 111.74 11.74 111.74 Titration of Monochloroacetic Acid Noors Data Table 3. Initial pH: 0.6/ Volume of NaOH added (ml) Buret readings (ml) 2.20ML 7.20 12.21 17.29 18.32 19.25 20.30 21.22 22.31 23.35 24.21 25. 26.10 26.70 28.10 29.20 30.50 31.60 32.50 5 Jool 15.08 16.03 16.96 18.01 18.93 20.02 21.06 21.92 23.11 23.81 29.41 25.81 26.91 29.21 29.31 30.21 pH O.GL 0.79 1.09 1.48 1.59 1.76 1.80 1.93 2.08 2.27 2.50 2.99 3.49 9.21 12.16 12.47 12.67 12.82 12.92 3 TREATMENT OF DATA (45 pts.) Calculate the following values Show all steps of your work, be sure to use the proper number of significant figures and include all units in your calculations. 1. (10) using your values in Data Tables 2 and 3. draw titration curves for both acids, plotting pH vs Volume of NaOH added. Each graph must have a numbered and catscriptive title les. Figure 1. Tale of Graph Scale your axes appropriately and add as botes with leses where appropriate). You should use a scatter plot in Excel and hand-draw the titration curve Staple your Excel graphs to the report sheet 2. (4) Determine the value of pK, for each acid from the titration curves. On your two titration curves, draw lines to indicate your logic and point out locations of interest. Use the calculation guide given in the Treatment of Data section in the General Chemistry 2 Laboratory Manual Report your results in Table 5. 3. (5) Use stoichiometry to determine the concentration of each NaOH solution compared to the KHP standard. You may use the calculation guide given in the Treatment of Data section in the General Chemistry 2 Laboratory Manual. Show your calculation for Trial #1 in the space below. Then find the average of the three calculations. Report your results in Table 4. Trial #1: Average: Figure 1. pH vs volume of NaOH added for Acetic Acid 15 10 Hd 5 0 0 20 40 10 30 Volume of NaOH addded (ml) Figure 2. pH vs volume of NaOH added for Monochloroacetic Acid 15 10 Hd 5 5 O 0 0.0 40.0 10.0 20.0 30.0 Volume of NaOH added (ml) TREATMENT OF DATA Titration Curves. Using your data, draw titration curves for both acids, plotting pH values vs. mL of NaOH added. pk, of Acetic Acid from Titration Data (repeat for monochloroacetic acid). Determine the value of pK, from the titration curve, as explained below. At the point half-way to the equivalence point, [HA] = [A]: pH = pka + log THAI IA) (Henderson-Hasselbalch equation) So if [HA] = [A"), then the equation becomes: pH = pka + log (1/1) or just pH = pka Therefore, the pK, is just equal to the pH at the point where half the volume of the base necessary to reach the endpoint has been added. The pH is found from the titration curve. An example is shown below H 14 epulce point PK 125 25 volume of alkali added (on) . Concentration of NaOH Solution. Use stoichiometry to determine the concentration of each NaOH solution compared to the KHP standard. Then find the average of the three calculations. Complete Table 4 below 1000 ml 11 xg KHP y ml. NaOH 1 mol KHP 204.2 g KHP 1 mol NaOH 1 mol KHP mol L M NaOH Table 4. Determination of Concentration of NaOH Standard Concentration of NaOH (M) Quantity Trial 1 Trial 2 Trial 3 Average . Concentration of Acetic Acid (repeat for monochloroacetic acid). For the equation below, use the NaOH molarity found in Part A and, using your graph, determine the volume (in ml) of NaOH at the d endpoint. Use the initial volume of exactly 25 ml for the acetic acid and solve for the concentration (in M) of acetic acid. MNOH X ml NaOH = Macetic acid * mLacetic acid . K of Acetic Acid from Initial pH (repeat for monochloroacetic acid). Using the initial pH before adding water to the acid), convert to [H]: [+] = antilog (pH) or 10- Because the acid is monoprotic, [H+] = [4] Solve for K., where [HA] is the molarity of the acetic acid calculated previously Ka = [H][A] [HA] Next, calculate the pka. pka = -log Ka Reference a reliable source to obtain literature pka values for each acid and determine the percentage of error in pka for both determinations for each acid. Summarize your results in Table 5. Total want w [Borkum litums) 2007 - 2011 walero Hola Number - 0.00 kut- f polis o.com van wed the +] 0.021471.00] vik) Folosity of Mice tularity of now aim (als - Am f 9 mode Valo 42-2.25L Holes KWP . 03 = o. DOCH | 16- 0.001165 0.25 -0.097 Helesily Musly for boe0-07 [tex3] Trail 31- Mhes kuta 447 Mele KP 06202 Minas well Volim dela = 2.0.0 News 0.00 = 0.0174H Maliby Hence molenity of L0-0114 Bratis Tsalt ring of salta SH --07 0.04 Answer 1 of 1 Done Q:2 which is determining the value of pKa for each acid from the titration curve... = pka is defined as the dissociation constant of an acid. = As per Henderson-Hasselbalch equation... pH = pka + log (4) (HA = At equivalence point... [ A ] = [HA] = so At equivalence point, pH = pku +10g (4-1) = pke + Figure 1. pH vs volume of NaOH added for Acetic Acid 15 10 5 5 Volume of NaOH addded (ml) Here At equivalence point... pH = pk, = 8 pk = -log10K.] = 8 K. = 10-8 Figure 2. pH vs volume of NaOH added for Monochloroacetic Acid 15 10 7.5- 5 0 0.0 10.0 20.0 30.0 400 Volume of NaOH added (ml) Here At equivalence point... pH = pk. = 7.5 pk = -log, K.] = 7.5 K. = 10-75 = 3.16 x 10⁻⁵
Step by Step Solution
There are 3 Steps involved in it

Get step-by-step solutions from verified subject matter experts