

Question
I need help with Question 7 on a computational modeling homework. Please see 6 in reference to 7. Coding language: python. Thanks for your help!
I need help with Question 7 on a computational modeling homework. Please see 6 in reference to 7. Coding language: python. Thanks for your help!
COPYABLE CODE:
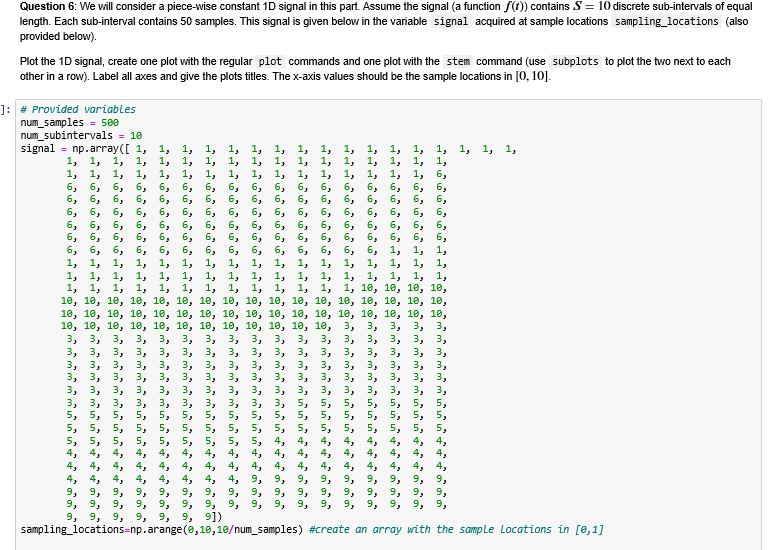
num_samples = 500 num_subintervals = 10 signal = np.array([ 1, 1, 1, 1, 1, 1, 1, 1, 1, 1, 1, 1, 1, 1, 1, 1, 1, 1, 1, 1, 1, 1, 1, 1, 1, 1, 1, 1, 1, 1, 1, 1, 1, 1, 1, 1, 1, 1, 1, 1, 1, 1, 1, 1, 1, 1, 1, 1, 1, 1, 6, 6, 6, 6, 6, 6, 6, 6, 6, 6, 6, 6, 6, 6, 6, 6, 6, 6, 6, 6, 6, 6, 6, 6, 6, 6, 6, 6, 6, 6, 6, 6, 6, 6, 6, 6, 6, 6, 6, 6, 6, 6, 6, 6, 6, 6, 6, 6, 6, 6, 6, 6, 6, 6, 6, 6, 6, 6, 6, 6, 6, 6, 6, 6, 6, 6, 6, 6, 6, 6, 6, 6, 6, 6, 6, 6, 6, 6, 6, 6, 6, 6, 6, 6, 6, 6, 6, 6, 6, 6, 6, 6, 6, 6, 6, 6, 6, 6, 6, 6, 1, 1, 1, 1, 1, 1, 1, 1, 1, 1, 1, 1, 1, 1, 1, 1, 1, 1, 1, 1, 1, 1, 1, 1, 1, 1, 1, 1, 1, 1, 1, 1, 1, 1, 1, 1, 1, 1, 1, 1, 1, 1, 1, 1, 1, 1, 1, 1, 1, 1, 10, 10, 10, 10, 10, 10, 10, 10, 10, 10, 10, 10, 10, 10, 10, 10, 10, 10, 10, 10, 10, 10, 10, 10, 10, 10, 10, 10, 10, 10, 10, 10, 10, 10, 10, 10, 10, 10, 10, 10, 10, 10, 10, 10, 10, 10, 10, 10, 10, 10, 3, 3, 3, 3, 3, 3, 3, 3, 3, 3, 3, 3, 3, 3, 3, 3, 3, 3, 3, 3, 3, 3, 3, 3, 3, 3, 3, 3, 3, 3, 3, 3, 3, 3, 3, 3, 3, 3, 3, 3, 3, 3, 3, 3, 3, 3, 3, 3, 3, 3, 3, 3, 3, 3, 3, 3, 3, 3, 3, 3, 3, 3, 3, 3, 3, 3, 3, 3, 3, 3, 3, 3, 3, 3, 3, 3, 3, 3, 3, 3, 3, 3, 3, 3, 3, 3, 3, 3, 3, 3, 3, 3, 3, 3, 3, 3, 3, 3, 3, 3, 5, 5, 5, 5, 5, 5, 5, 5, 5, 5, 5, 5, 5, 5, 5, 5, 5, 5, 5, 5, 5, 5, 5, 5, 5, 5, 5, 5, 5, 5, 5, 5, 5, 5, 5, 5, 5, 5, 5, 5, 5, 5, 5, 5, 5, 5, 5, 5, 5, 5, 4, 4, 4, 4, 4, 4, 4, 4, 4, 4, 4, 4, 4, 4, 4, 4, 4, 4, 4, 4, 4, 4, 4, 4, 4, 4, 4, 4, 4, 4, 4, 4, 4, 4, 4, 4, 4, 4, 4, 4, 4, 4, 4, 4, 4, 4, 4, 4, 4, 4, 9, 9, 9, 9, 9, 9, 9, 9, 9, 9, 9, 9, 9, 9, 9, 9, 9, 9, 9, 9, 9, 9, 9, 9, 9, 9, 9, 9, 9, 9, 9, 9, 9, 9, 9, 9, 9, 9, 9, 9, 9, 9, 9, 9, 9, 9, 9, 9, 9, 9]) sampling_locations=np.arange(0,10,10um_samples) #create an array with the sample locations in [0,1]
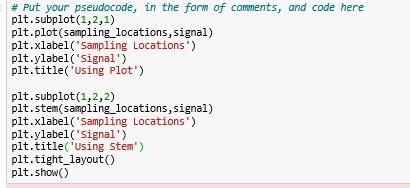
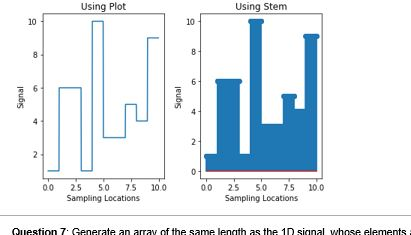
plt.subplot(1,2,1) plt.plot(sampling_locations,signal) plt.xlabel('Sampling Locations') plt.ylabel('Signal') plt.title('Using Plot')
plt.subplot(1,2,2) plt.stem(sampling_locations,signal) plt.xlabel('Sampling Locations') plt.ylabel('Signal') plt.title('Using Stem') plt.tight_layout() plt.show()
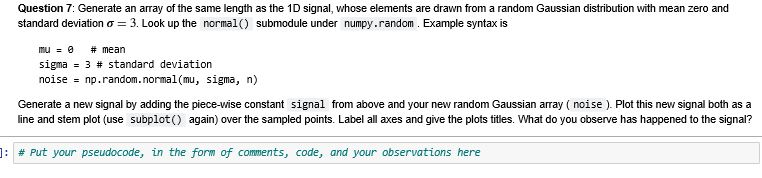
Generate an array of the same length as the 1D signal, whose elements are drawn from a random Gaussian distribution with mean zero and standard deviation $\sigma=3$. Look up the `normal()` submodule under `numpy.random`. Example syntax is
``` mu = 0 # mean sigma = 3 # standard deviation noise = np.random.normal(mu, sigma, n) ```
Generate a new signal by adding the piece-wise constant `signal` from above and your new random Gaussian array (`noise`). Plot this new signal both as a line and stem plot (use `subplot()` again) over the sampled points. Label all axes and give the plots titles. What do you observe has happened to the signal?
Question 7: Generate an array of the same length as the 1D signal, whose elements are drawn from a random Gaussian distribution with mean zero and standard deviation o = 3. Look up the normal() submodule under numpy.random. Example syntax is mu = @ # mean sigma = 3 # standard deviation noise = np.random.normal (mu, sigma, n) Generate a new signal by adding the piece-wise constant signal from above and your new random Gaussian array ( noise ). Plot this new signal both as a line and stem plot (use subplot() again) over the sampled points. Label all axes and give the plots titles. What do you observe has happened to the signal? ]: # Put your pseudocode, in the form of comments, code, and your observations here 1, 1, 1, Question 6: We will consider a piece-wise constant 1D signal in this part. Assume the signal (a function f(t)) contains S = 10 discrete sub-intervals of equal length. Each sub-interval contains 50 samples. This signal is given below in the variable signal acquired at sample locations sampling_locations (also provided below). Plot the 1D signal, create one plot with the regular plot commands and one plot with the stem command (use subplots to plot the two next to each other in a row). Label all axes and give the plots titles. The X-axis values should be the sample locations in (0, 10). =' ' ' ' ' ' ' ' ' ' ' ' ' ' ' - ' - ' ' ' - ' ' ' ' - 4 4 4 9, 9, 8, 8, 4, 9, 9, 3, 4, 9, 9, 9, 4, 4, 9, 9, 9, sampling_locations=np.arange(0,10,10um_samples) #create an array with the sample Locations in [0,1] 4, 4, 9, 9, 9, 4, 4, 9, 9, 9, 4, 4, 8, 9, 9, 4, 4, 4, 9, 9, 4, 4, 9, 9, 9]) 4, 4, 9, 9, 9, 4, 4, 9, 9, 9, 4, 4, 9, 9, 9, 4, 4, 9, 9, 9, 4, 4, 9, 9, 9, 4, 4, 9, 9, 9, - - - - - - - - ' - " " " 1, B 0 0 0 * * * eee - - - 0 0 0 0 0 0 - . - 1, 1, 6, 8, 1, 2, 5, 6, 1, 1, 6, signal = np.array([ 1, 1, 5, # Provided variables num_samples = 580 num_subintervals = 10 1, 1, 6, 6, " " " ' - f' ' ' ''' ' ' ' e 2 - - - . ' ' ' - * * * # Put your pseudocode, in the form of comments, and code here plt.subplot(1,2,1) plt.plot(sampling_locations, signal) plt.xlabel('Sampling Locations") plt.ylabel('Signal') plt.title('Using Plot') plt. subplot(1,2,2) plt.stem(sampling_locations,signal) plt.xlabel('Sampling Locations) plt.ylabel('Signal') plt.title('Using Stem') plt.tight_layout() plt.show() Using Plot Using Stem Signal Signal 00 25 50 75 Sampling Locations 100 0 0 25 50 75 Sampling Locations 100 Question 7 Generate an array of the same length as the 10 signal whose elements Question 7: Generate an array of the same length as the 1D signal, whose elements are drawn from a random Gaussian distribution with mean zero and standard deviation o = 3. Look up the normal() submodule under numpy.random. Example syntax is mu = @ # mean sigma = 3 # standard deviation noise = np.random.normal (mu, sigma, n) Generate a new signal by adding the piece-wise constant signal from above and your new random Gaussian array ( noise ). Plot this new signal both as a line and stem plot (use subplot() again) over the sampled points. Label all axes and give the plots titles. What do you observe has happened to the signal? ]: # Put your pseudocode, in the form of comments, code, and your observations here 1, 1, 1, Question 6: We will consider a piece-wise constant 1D signal in this part. Assume the signal (a function f(t)) contains S = 10 discrete sub-intervals of equal length. Each sub-interval contains 50 samples. This signal is given below in the variable signal acquired at sample locations sampling_locations (also provided below). Plot the 1D signal, create one plot with the regular plot commands and one plot with the stem command (use subplots to plot the two next to each other in a row). Label all axes and give the plots titles. The X-axis values should be the sample locations in (0, 10). =' ' ' ' ' ' ' ' ' ' ' ' ' ' ' - ' - ' ' ' - ' ' ' ' - 4 4 4 9, 9, 8, 8, 4, 9, 9, 3, 4, 9, 9, 9, 4, 4, 9, 9, 9, sampling_locations=np.arange(0,10,10um_samples) #create an array with the sample Locations in [0,1] 4, 4, 9, 9, 9, 4, 4, 9, 9, 9, 4, 4, 8, 9, 9, 4, 4, 4, 9, 9, 4, 4, 9, 9, 9]) 4, 4, 9, 9, 9, 4, 4, 9, 9, 9, 4, 4, 9, 9, 9, 4, 4, 9, 9, 9, 4, 4, 9, 9, 9, 4, 4, 9, 9, 9, - - - - - - - - ' - " " " 1, B 0 0 0 * * * eee - - - 0 0 0 0 0 0 - . - 1, 1, 6, 8, 1, 2, 5, 6, 1, 1, 6, signal = np.array([ 1, 1, 5, # Provided variables num_samples = 580 num_subintervals = 10 1, 1, 6, 6, " " " ' - f' ' ' ''' ' ' ' e 2 - - - . ' ' ' - * * * # Put your pseudocode, in the form of comments, and code here plt.subplot(1,2,1) plt.plot(sampling_locations, signal) plt.xlabel('Sampling Locations") plt.ylabel('Signal') plt.title('Using Plot') plt. subplot(1,2,2) plt.stem(sampling_locations,signal) plt.xlabel('Sampling Locations) plt.ylabel('Signal') plt.title('Using Stem') plt.tight_layout() plt.show() Using Plot Using Stem Signal Signal 00 25 50 75 Sampling Locations 100 0 0 25 50 75 Sampling Locations 100 Question 7 Generate an array of the same length as the 10 signal whose elementsStep by Step Solution
There are 3 Steps involved in it
Step: 1

Get Instant Access to Expert-Tailored Solutions
See step-by-step solutions with expert insights and AI powered tools for academic success
Step: 2

Step: 3
Ace Your Homework with AI
Get the answers you need in no time with our AI-driven, step-by-step assistance
Get Started
Expert Oracle Database Architecture
Authors: Thomas Kyte, Darl Kuhn
3rd Edition
1430262990, 9781430262992