

Answered step by step
Verified Expert Solution
Question
1 Approved Answer
I need help with the part about making a figure in excel please!! You have been hired by the secretive - society to analyze a
I need help with the part about making a figure in excel please!!
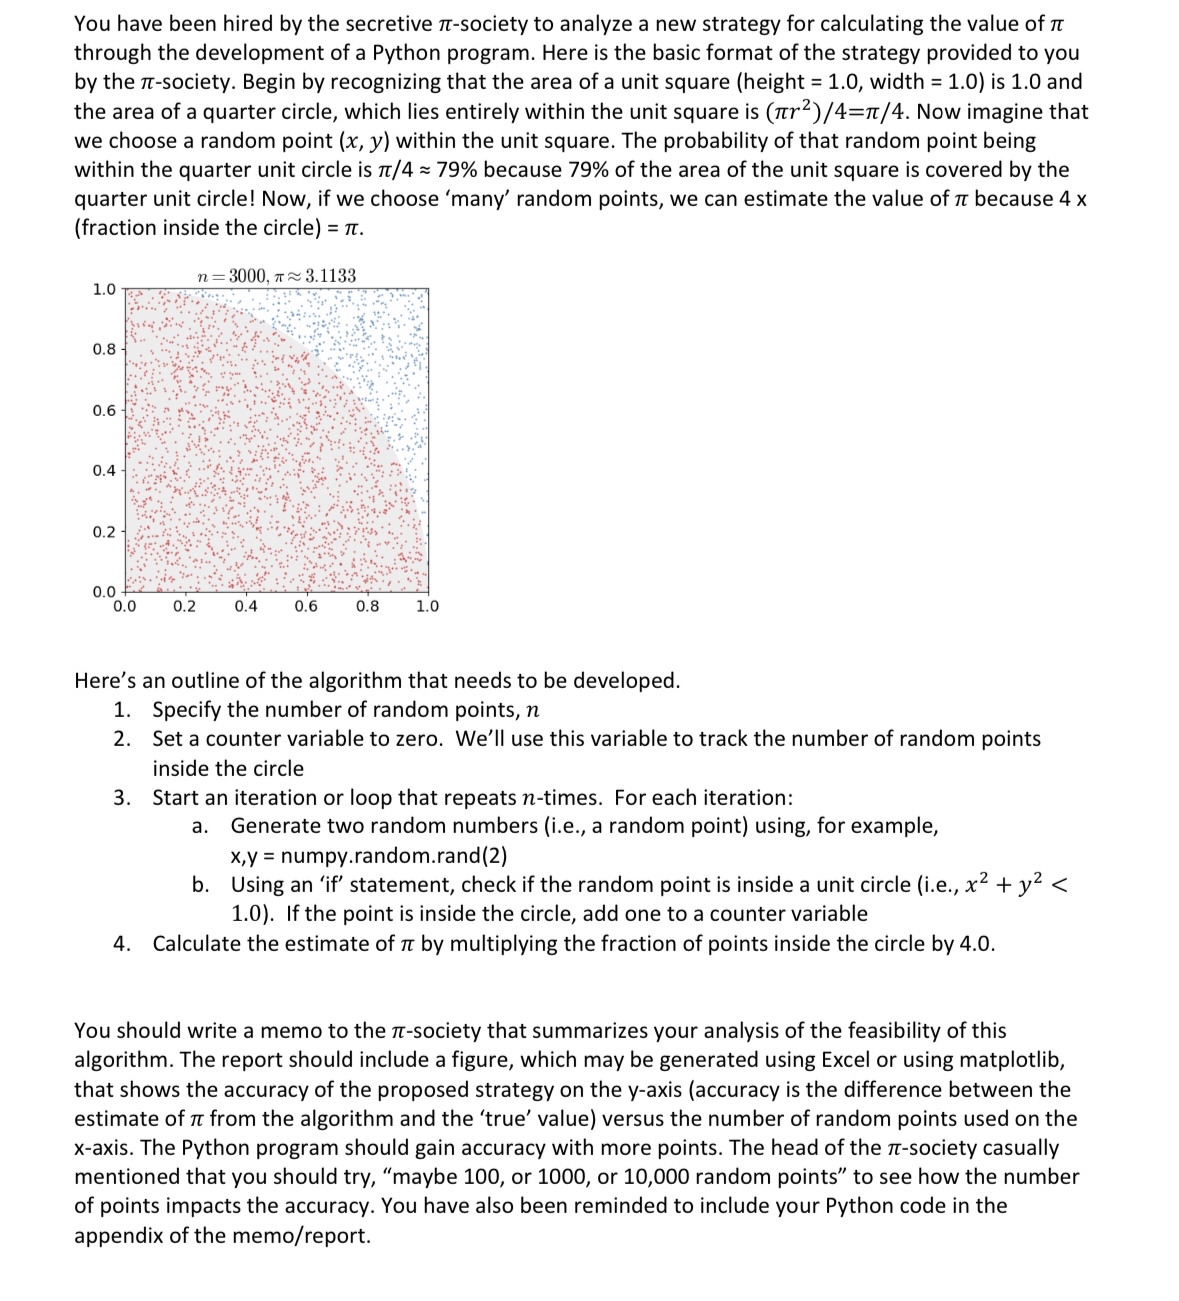
You have been hired by the secretive society to analyze a new strategy for calculating the value of through the development of a Python program. Here is the basic format of the strategy provided to you by the society. Begin by recognizing that the area of a unit square height width is and the area of a quarter circle, which lies entirely within the unit square is Now imagine that we choose a random point within the unit square. The probability of that random point being within the quarter unit circle is ~~ because of the area of the unit square is covered by the quarter unit circle! Now, if we choose 'many' random points, we can estimate the value of because fraction inside the circle
Here's an outline of the algorithm that needs to be developed.
Specify the number of random points,
Set a counter variable to zero. We'll use this variable to track the number of random points inside the circle
Start an iteration or loop that repeats times. For each iteration:
a Generate two random numbers ie a random point using, for example, numpy.random.rand
b Using an if statement, check if the random point is inside a unit circle ie If the point is inside the circle, add one to a counter variable
Calculate the estimate of by multiplying the fraction of points inside the circle by
You should write a memo to the society that summarizes your analysis of the feasibility of this algorithm. The report should include a figure, which may be generated using Excel or using matplotlib, that shows the accuracy of the proposed strategy on the axis accuracy is the difference between the estimate of from the algorithm and the 'true' value versus the number of random points used on the axis. The Python program should gain accuracy with more points. The head of the society casually mentioned that you should try, "maybe or or random points" to see how the number of points impacts the accuracy. You have also been reminded to include your Python code in the appendix of the memoreport
Step by Step Solution
There are 3 Steps involved in it
Step: 1

Get Instant Access to Expert-Tailored Solutions
See step-by-step solutions with expert insights and AI powered tools for academic success
Step: 2

Step: 3
Ace Your Homework with AI
Get the answers you need in no time with our AI-driven, step-by-step assistance
Get Started
Learning MySQL Get A Handle On Your Data
Authors: Seyed M M Tahaghoghi
1st Edition
0596529465, 9780596529468