Answered step by step
Verified Expert Solution
Link Copied!

Question

1 Approved Answer

I need help with the question pls include the graphs and plot The examination scores (out of 100 percent) for a class are shown below.

I need help with the question pls include the graphs and plot
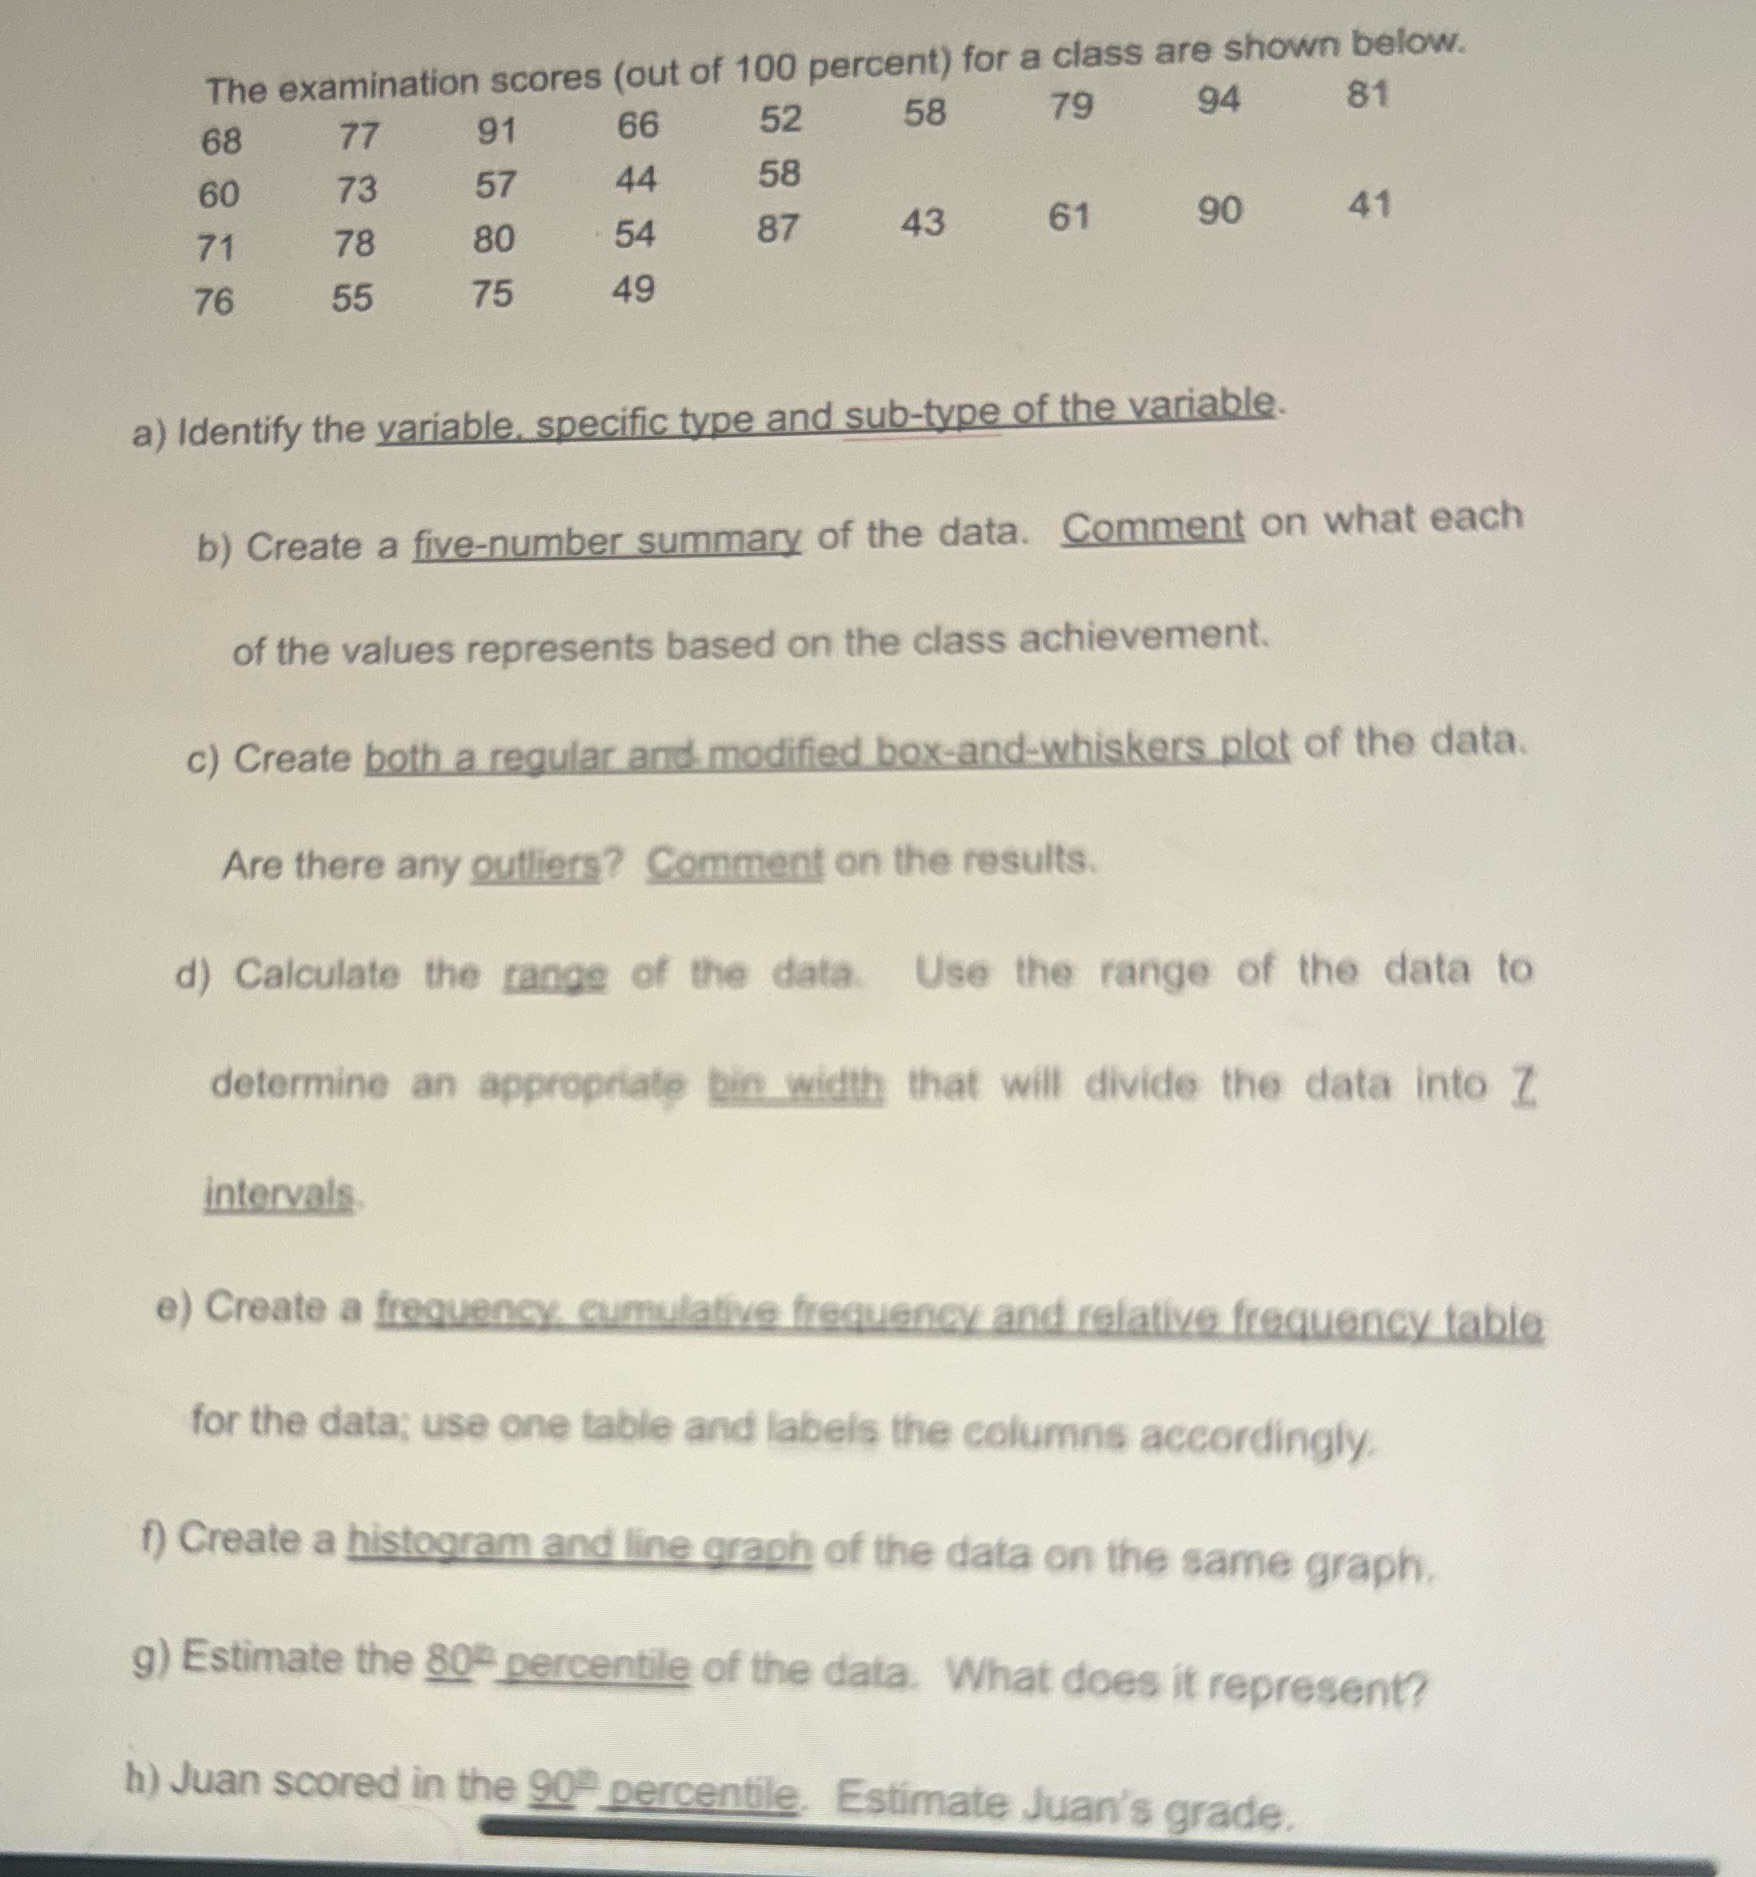
image text in transcribed
The examination scores (out of 100 percent) for a class are shown below. 66 52 58 79 94 81 68 77 91 60 73 57 44 58 80 54 87 43 61 90 41 71 78 76 55 75 49 a) Identify the variable, specific type and sub-type of the variable. b) Create a five-number summary of the data. Comment on what each of the values represents based on the class achievement. c) Create both a regular and modified box-and-whiskers plot of the data. Are there any outliers? Comment on the results. d) Calculate the range of the data. Use the range of the data to determine an appropriate bin width that will divide the data into Z intervals e) Create a frequency. cumulative frequency and relative frequency table for the data; use one table and labels the columns accordingly. f) Create a histogram and line graph of the data on the same graph, g) Estimate the 80% percentile of the data. What does it represent? h) Juan scored in the 90 percentile. Estimate Juan's grade

Step by Step Solution

There are 3 Steps involved in it

Step: 1

blur-text-image

Get Instant Access to Expert-Tailored Solutions

See step-by-step solutions with expert insights and AI powered tools for academic success

Step: 2

blur-text-image

Step: 3

blur-text-image

Ace Your Homework with AI

Get the answers you need in no time with our AI-driven, step-by-step assistance

Get Started

Recommended Textbook for

Linear Algebra A Modern Introduction

Authors: David Poole

4th edition

1285463242, 978-1285982830, 1285982835, 978-1285463247

More Books

Students also viewed these Mathematics questions