Answered step by step
Verified Expert Solution
Question
1 Approved Answer
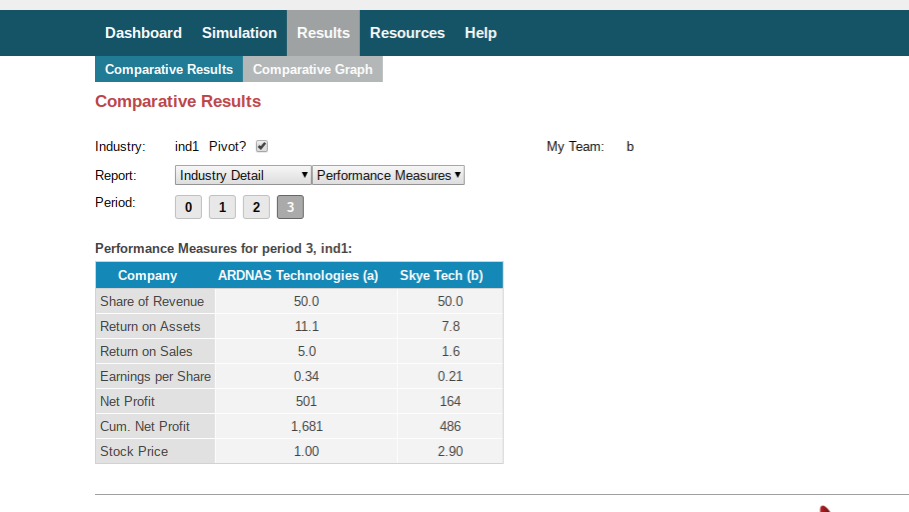
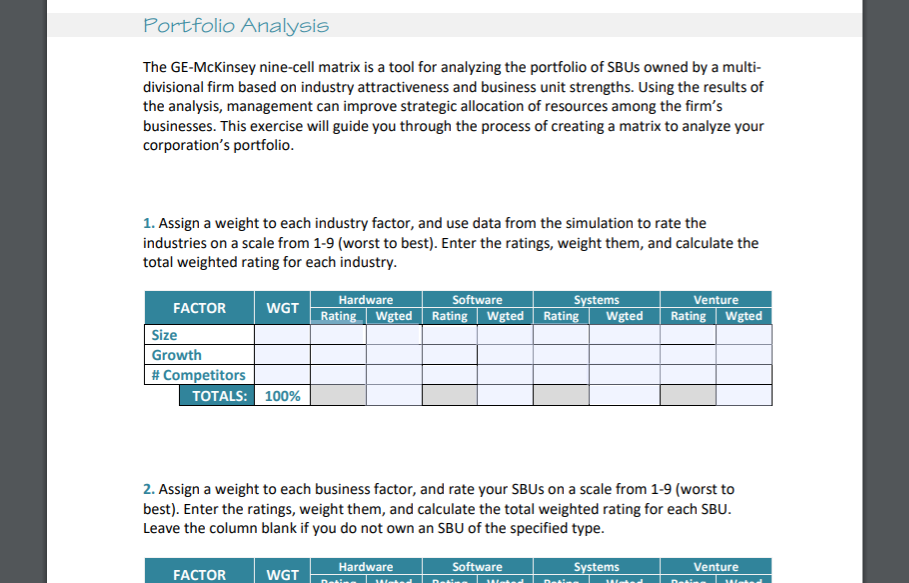
I need help with these asap. I am on team B. Please help asap!!! Dashboard Simulation Results Resources Help Comparative Results Comparative Graph Comparative Results


I need help with these asap. I am on team B. Please help asap!!!
Dashboard Simulation Results Resources Help Comparative Results Comparative Graph Comparative Results Industry: ind1 Pivot? Report: Period: My Team: Industry Detail Performance Measures 3 Performance Measures for period 3, ind1: Company Share of Revenue Return on Assets Return on Sales Earnings per Share Net Profit Cum. Net Profit Stock Price ARDNAS Technologies (a) Skye Tech (b) 50.0 11.1 5.0 0.34 501 1,681 1.00 50.0 7.8 1.6 0.21 164 486 2.90 Dashboard Simulation Results Resources Help Comparative Results Comparative Graph Comparative Results Industry: ind1 Pivot? Report: Period: My Team: Industry Detail Performance Measures 3 Performance Measures for period 3, ind1: Company Share of Revenue Return on Assets Return on Sales Earnings per Share Net Profit Cum. Net Profit Stock Price ARDNAS Technologies (a) Skye Tech (b) 50.0 11.1 5.0 0.34 501 1,681 1.00 50.0 7.8 1.6 0.21 164 486 2.90Step by Step Solution
There are 3 Steps involved in it
Step: 1

Get Instant Access to Expert-Tailored Solutions
See step-by-step solutions with expert insights and AI powered tools for academic success
Step: 2

Step: 3

Ace Your Homework with AI
Get the answers you need in no time with our AI-driven, step-by-step assistance
Get Started


