I need help with this as soon as possible please and thank you. i need the full report step by step MDM4U Major Statistics Project
I need help with this as soon as possible please and thank you. i need the full report step by step
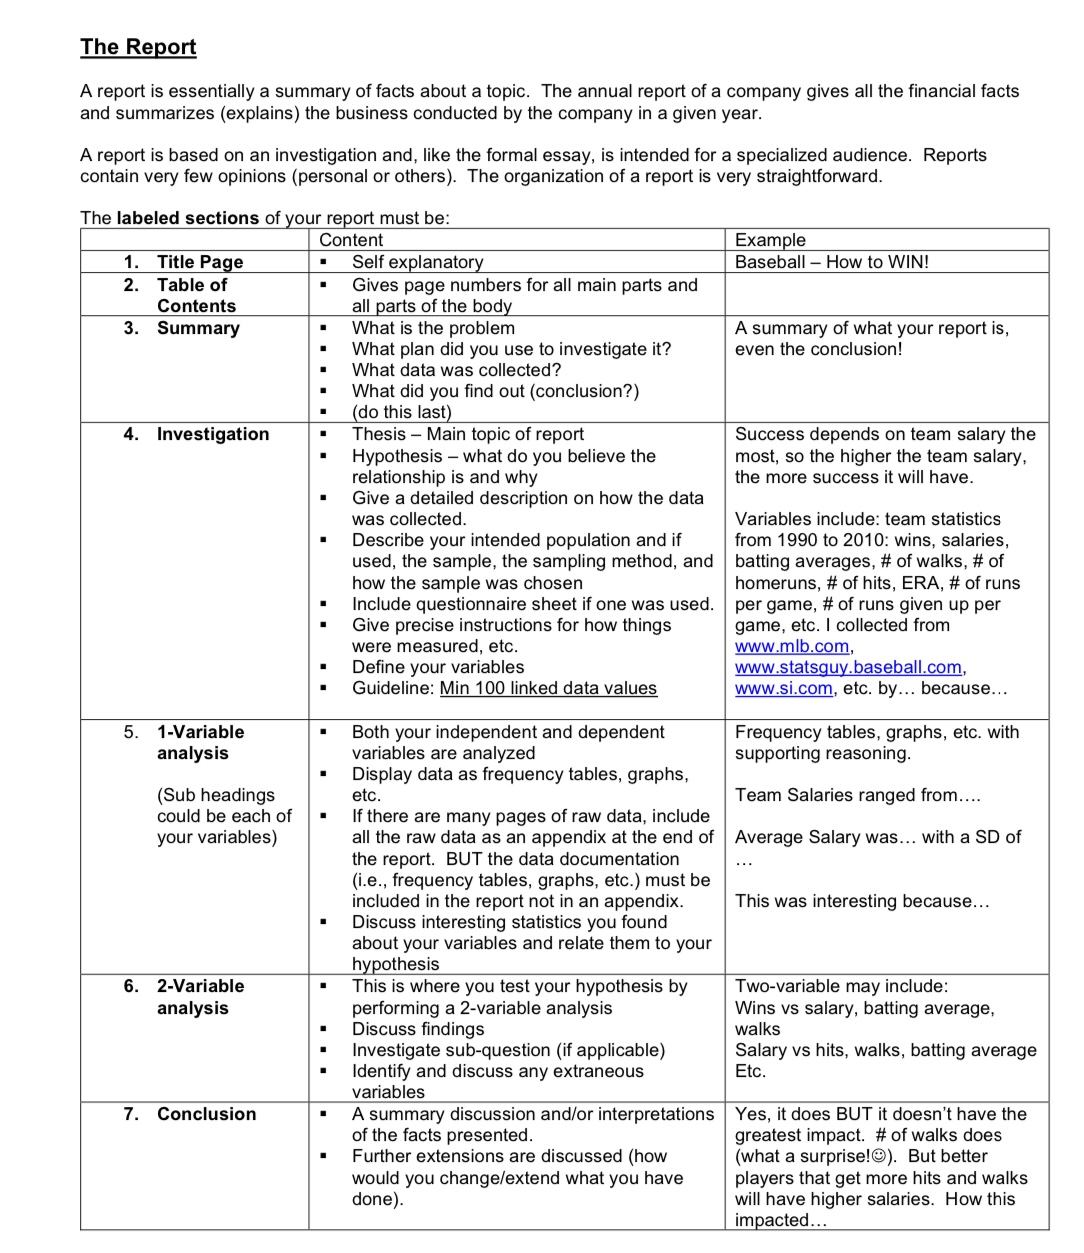
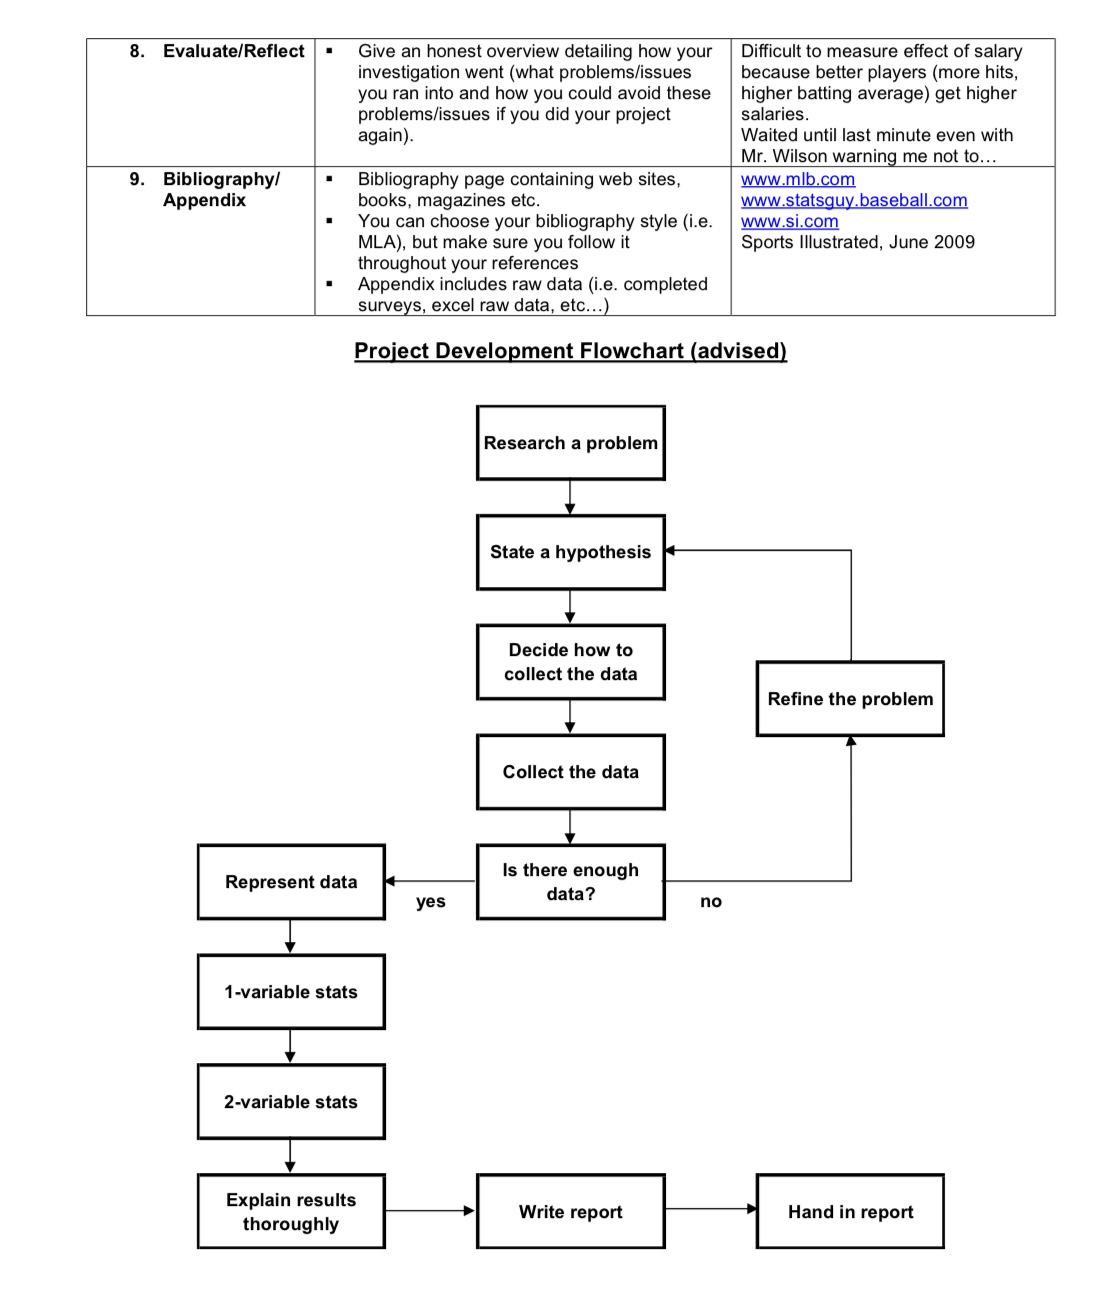
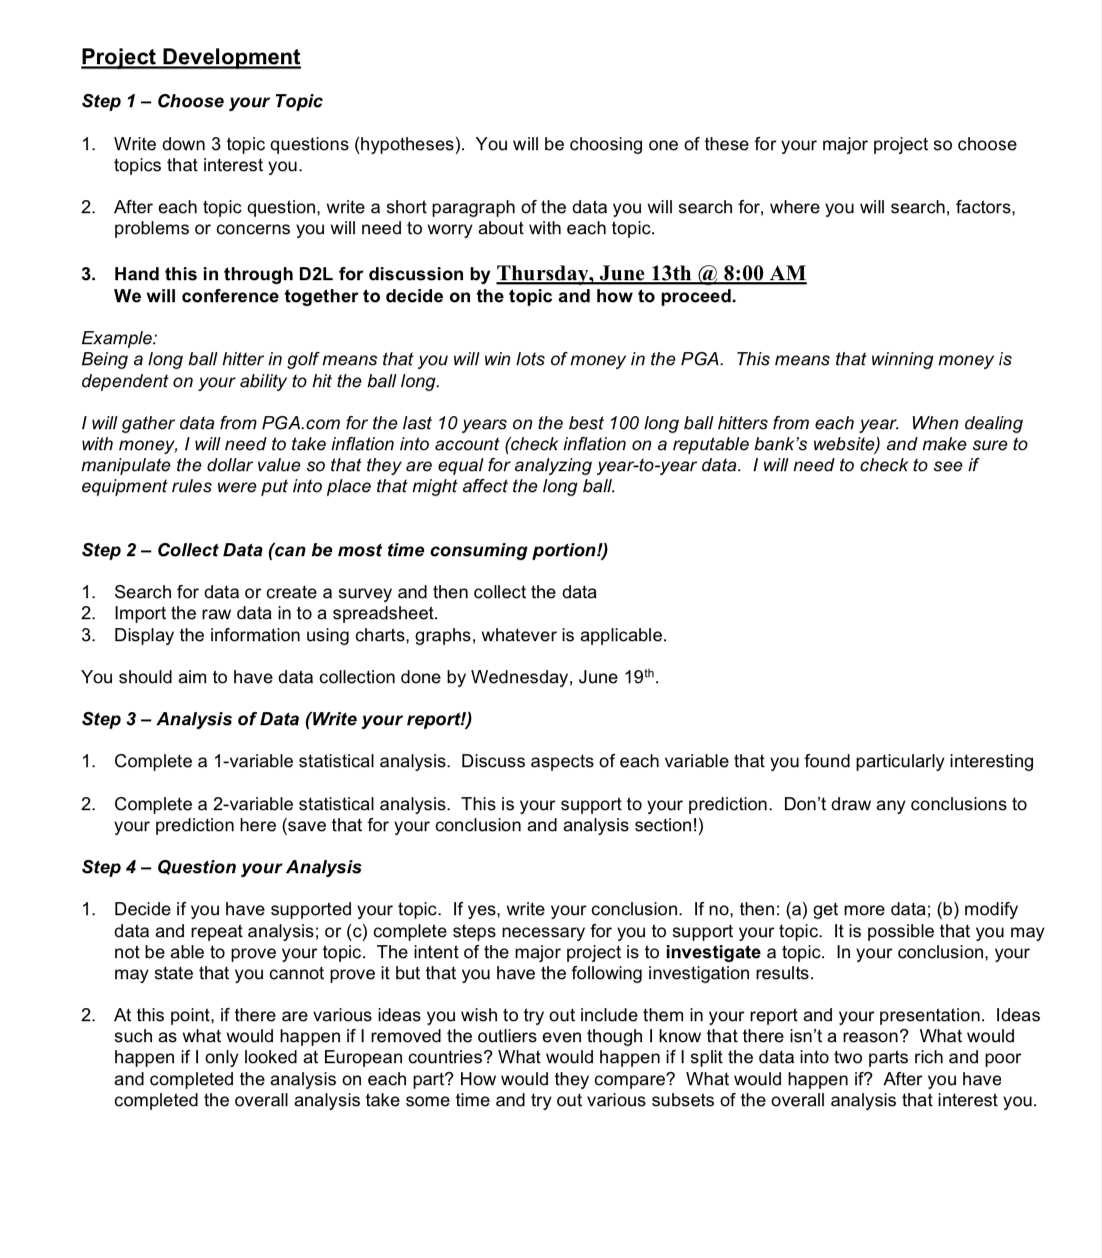
MDM4U Major Statistics Project Overview June 2024 This culminating project covers the following expectations from the Ministry Curriculum Document: Overall: Design and carry out a culminating investigation that requires the integration and application of the knowledge and skills related to the expectations of the course Communicate the findings of a culminating investigation Specific: Pose a significant problem of interest that requires the organization and analysis of a suitable set of data form either a primary (you collect) or secondary source (get from an existing database) Design a plan to study the problem Gather data related to the study of the problem Interpret, analyze and summarize the data related to the problem Draw conclusions from the analysis of the data Compile a clear, well-organized and detailed report of the investigation Report A report (not an essay) is to be handed in. Follow the structure provided in the package and rubric. The report is to include: Graphs, computer screen shots, mathematical equations * The data collected s efc. The report must be typed, and all parts done on Google Docs via your student Google account as provided by Simcoe County District School Board. This is your best work ever. You are 12U students. My expectations for the report are very high. When | read your report, | should say to myself: \"WOW! They've worked hard and this is the best work | have ever seen from them.\" A breakdown of how the report should be organized is included Notes on past experiences MDM4U Remember that your project is an investigation not a proof. | do not expect you to be able to prove or disprove your topic. All | require is an investigation to the best of your ability. If you find a correlation value of zero and you thought it would be one this is OK and you do not need to pick another topic. Do not automatically calculate every value and state them. You must decide which values you should calculate. When it is calculated, you must discuss what the value means to your investigation (i.e. do not find a mode if it doesn''t make sense to find a mode). Make sure your graphs are appropriate for your topic. Do not automatically make a frequency table, graph it and make a cumulative graph. It might be more appropriate to show the data in chronological order. THINK about the values calculated and what you are investigating. Always remember to discuss everything you calculate. Don't tell me how you calculated it or what it is, tell me why it's important to your investigation!! Page 1 of 5 The Report A report is essentially a summary of facts about a topic. The annual report of a company gives all the financial facts and summarizes (explains) the business conducted by the company in a given year. A report is based on an investigation and, like the formal essay, is intended for a specialized audience. Reports contain very few opinions (personal or others). The organization of a report is very straightforward. The labeled sections of your report must be: Content Example 1. Title Page = Self explanatory Baseball How to WIN! 2. Table of = Gives page numbers for all main parts and Contents all parts of the body 3. Summary = What is the problem A summary of what your report is, = What plan did you use to investigate it? even the conclusion! = What data was collected? = What did you find out (conclusion?) = (do this last) 4. Investigation = Thesis Main topic of report Success depends on team salary the = Hypothesis what do you believe the most, so the higher the team salary, relationship is and why the more success it will have. = Give a detailed description on how the data was collected. Variables include: team statistics = Describe your intended population and if from 1990 to 2010: wins, salaries, used, the sample, the sampling method, and | batting averages, # of walks, # of how the sample was chosen homeruns, # of hits, ERA, # of runs = Include questionnaire sheet if one was used. | per game, # of runs given up per = Give precise instructions for how things game, etc. | collected from were measured, etc. www.mlb.com, = Define your variables www statsguy.baseball.com, = Guideline: Min 100 linked data values www.si.com, etc. by... because... 5. 1-Variable = Both your independent and dependent Frequency tables, graphs, etc. with analysis variables are analyzed supporting reasoning. = Display data as frequency tables, graphs, (Sub headings etc. Team Salaries ranged from.... could be each of | = If there are many pages of raw data, include your variables) all the raw data as an appendix at the end of | Average Salary was... with a SD of the report. BUT the data documentation (i.e., frequency tables, graphs, etc.) must be included in the report not in an appendix. This was interesting because... = Discuss interesting statistics you found about your variables and relate them to your hypothesis 6. 2-Variable = This is where you test your hypothesis by Two-variable may include: analysis performing a 2-variable analysis Wins vs salary, batting average, = Discuss findings walks = |Investigate sub-question (if applicable) Salary vs hits, walks, batting average = |dentify and discuss any extraneous Etc. variables 7. Conclusion = A summary discussion and/or interpretations | Yes, it does BUT it doesn't have the of the facts presented. greatest impact. # of walks does = Further extensions are discussed (how (what a surprise!@). But better would you change/extend what you have players that get more hits and walks done). will have higher salaries. How this impacted... 8. Evaluate/Reflect | = Give an honest overview detailing how your investigation went (what problems/issues you ran into and how you could avoid these problems/issues if you did your project again). Difficult to measure effect of salary because better players (more hits, higher batting average) get higher salaries. Waited until last minute even with Mr. Wilson warning me not to... 9. Bibliography/ = Bibliography page containing web sites, Appendix books, magazines etc. = You can choose your bibliography style (i.e. MLA), but make sure you follow it throughout your references = Appendix includes raw data (i.e. completed surveys, excel raw data, etc...) www.mlb.com www.statsguy.baseball.com WWW.si.com Sports lllustrated, June 2009 Project Development Flowchart (advised) Research a problem State a hypothesis Decide how to collect the data Collect the data Is there enough data? Represent data 1-variable stats 2-variable stats Explain results thoroughly Write report Refine the problem Hand in report Project Development Step 1 - Choose your Topic 1. Write down 3 topic questions (hypotheses). You will be choosing one of these for your major project so choose topics that interest you. 2. After each topic question, write a short paragraph of the data you will search for, where you will search, factors, problems or concerns you will need to worry about with each topic. 3. Hand this in through D2L for discussion by Thursday, June 13th @ 8:00 AM We will conference together to decide on the topic and how to proceed. Example: Being a long ball hitter in golf means that you will win lots of money in the PGA. This means that winning money is dependent on your ability to hit the ball long. | will gather data from PGA.com for the last 10 years on the best 100 long ball hitters from each year. When dealing with money, | will need to take inflation into account (check inflation on a reputable bank's website) and make sure to manipulate the dollar value so that they are equal for analyzing year-to-year data. | will need to check to see if equipment rules were put into place that might affect the long ball. Step 2 - Collect Data (can be most time consuming portion!) 1. Search for data or create a survey and then collect the data 2. Import the raw data in to a spreadsheet. 3. Display the information using charts, graphs, whatever is applicable. You should aim to have data collection done by Wednesday, June 19", Step 3 - Analysis of Data (Write your report!) 1. Complete a 1-variable statistical analysis. Discuss aspects of each variable that you found particularly interesting 2. Complete a 2-variable statistical analysis. This is your support to your prediction. Don't draw any conclusions to your prediction here (save that for your conclusion and analysis section!) Step 4 - Question your Analysis 1. Decide if you have supported your topic. If yes, write your conclusion. If no, then: (a) get more data; (b) modify data and repeat analysis; or (c) complete steps necessary for you to support your topic. Itis possible that you may not be able to prove your topic. The intent of the major project is to investigate a topic. In your conclusion, your may state that you cannot prove it but that you have the following investigation results. 2. At this point, if there are various ideas you wish to try out include them in your report and your presentation. ldeas such as what would happen if | removed the outliers even though | know that there isn't a reason? What would happen if | only looked at European countries? What would happen if | split the data into two parts rich and poor and completed the analysis on each part? How would they compare? What would happen if? After you have completed the overall analysis take some time and try out various subsets of the overall analysis that interest you. Step 5 - Conclusion and Analysis of Project 1. At this point, your analysis is complete, so write your conclusion. Discuss specifically how your prediction was supported/contradicted using findings from your report. 2. After the conclusion, complete an honest overview detailing how your investigation went (what problems/issues you ran into and how you could avoid these problems/issues if you did your project again, can your data be used to make predictions?). Hints for Project Report 1. You are expected to compile a clear, well-organized, and fully justified report of your investigation and its results. Follow the report layout given earlier. 2. Your report will be assessed for its mathematical validity. This project is your opportunity to demonstrate your understanding of the skills and concepts of the course. Use the following checklist on this page to ensure that your report is a high quality mathematical product. Mathematical terminology is used correctly throughout. Mathematical terminology is used consistently throughout. Mathematical notation is used correctly throughout. Mathematical content is correct. Mathematical content is complete. Mathematical development is logical. All important steps in mathematical developments are included. Any assumptions used in your analysis are explicitly stated. Any limitations of your analysis are identified. Any limitations of your analysis are explicitly stated. Possible extensions of your analysis are identified. Possible extensions of your analysis are discussed. Conclusions follow logically from your analysis. 3. Make sure to have a friend proofread your report. 4. The presentation and layout of the report are important. Remember the easier it is for me to follow/understand the better the mark will be
Step by Step Solution
There are 3 Steps involved in it
Step: 1
Get Instant Access to Expert-Tailored Solutions
See step-by-step solutions with expert insights and AI powered tools for academic success
Step: 2
Step: 3
Ace Your Homework with AI
Get the answers you need in no time with our AI-driven, step-by-step assistance