

Question
I need help with this project for data management the instructions for this assignment is stated below following (research part, data collection,Analysis of data using
I need help with this project for data management the instructions for this assignment is stated below following (research part, data collection,Analysis of data using Excel and finally creating a report
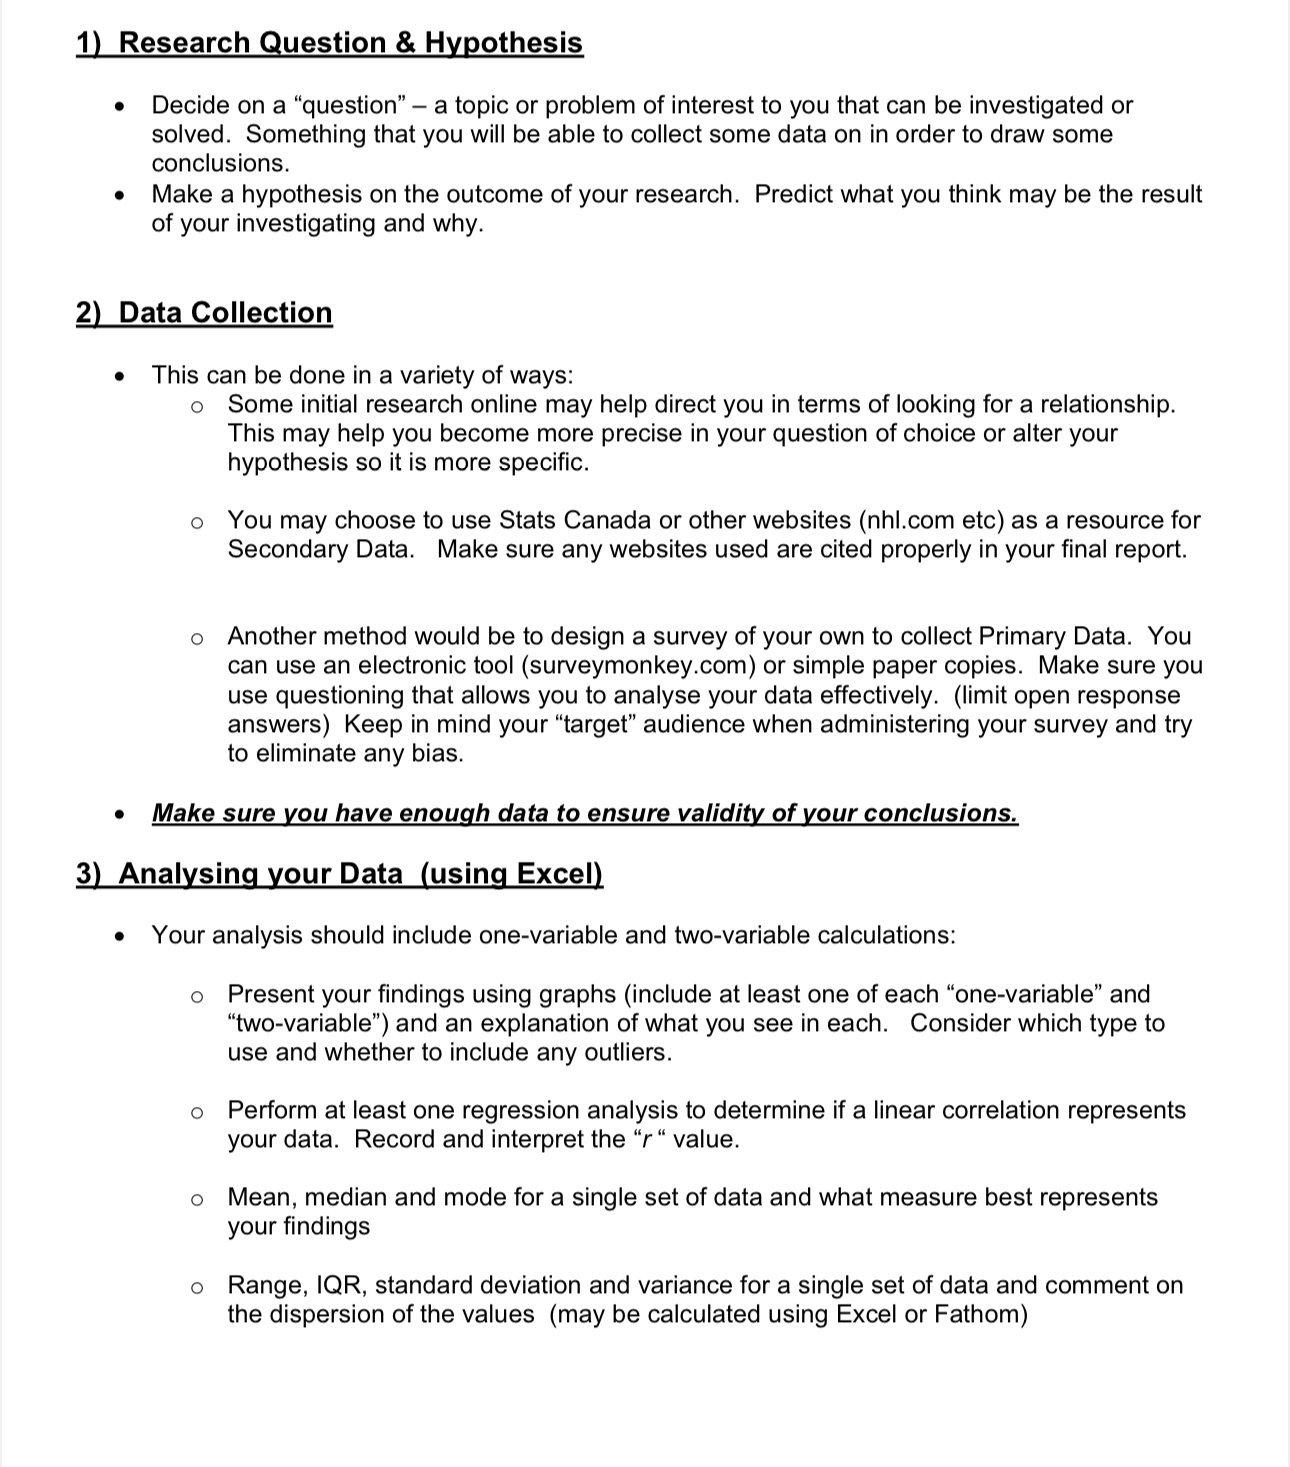
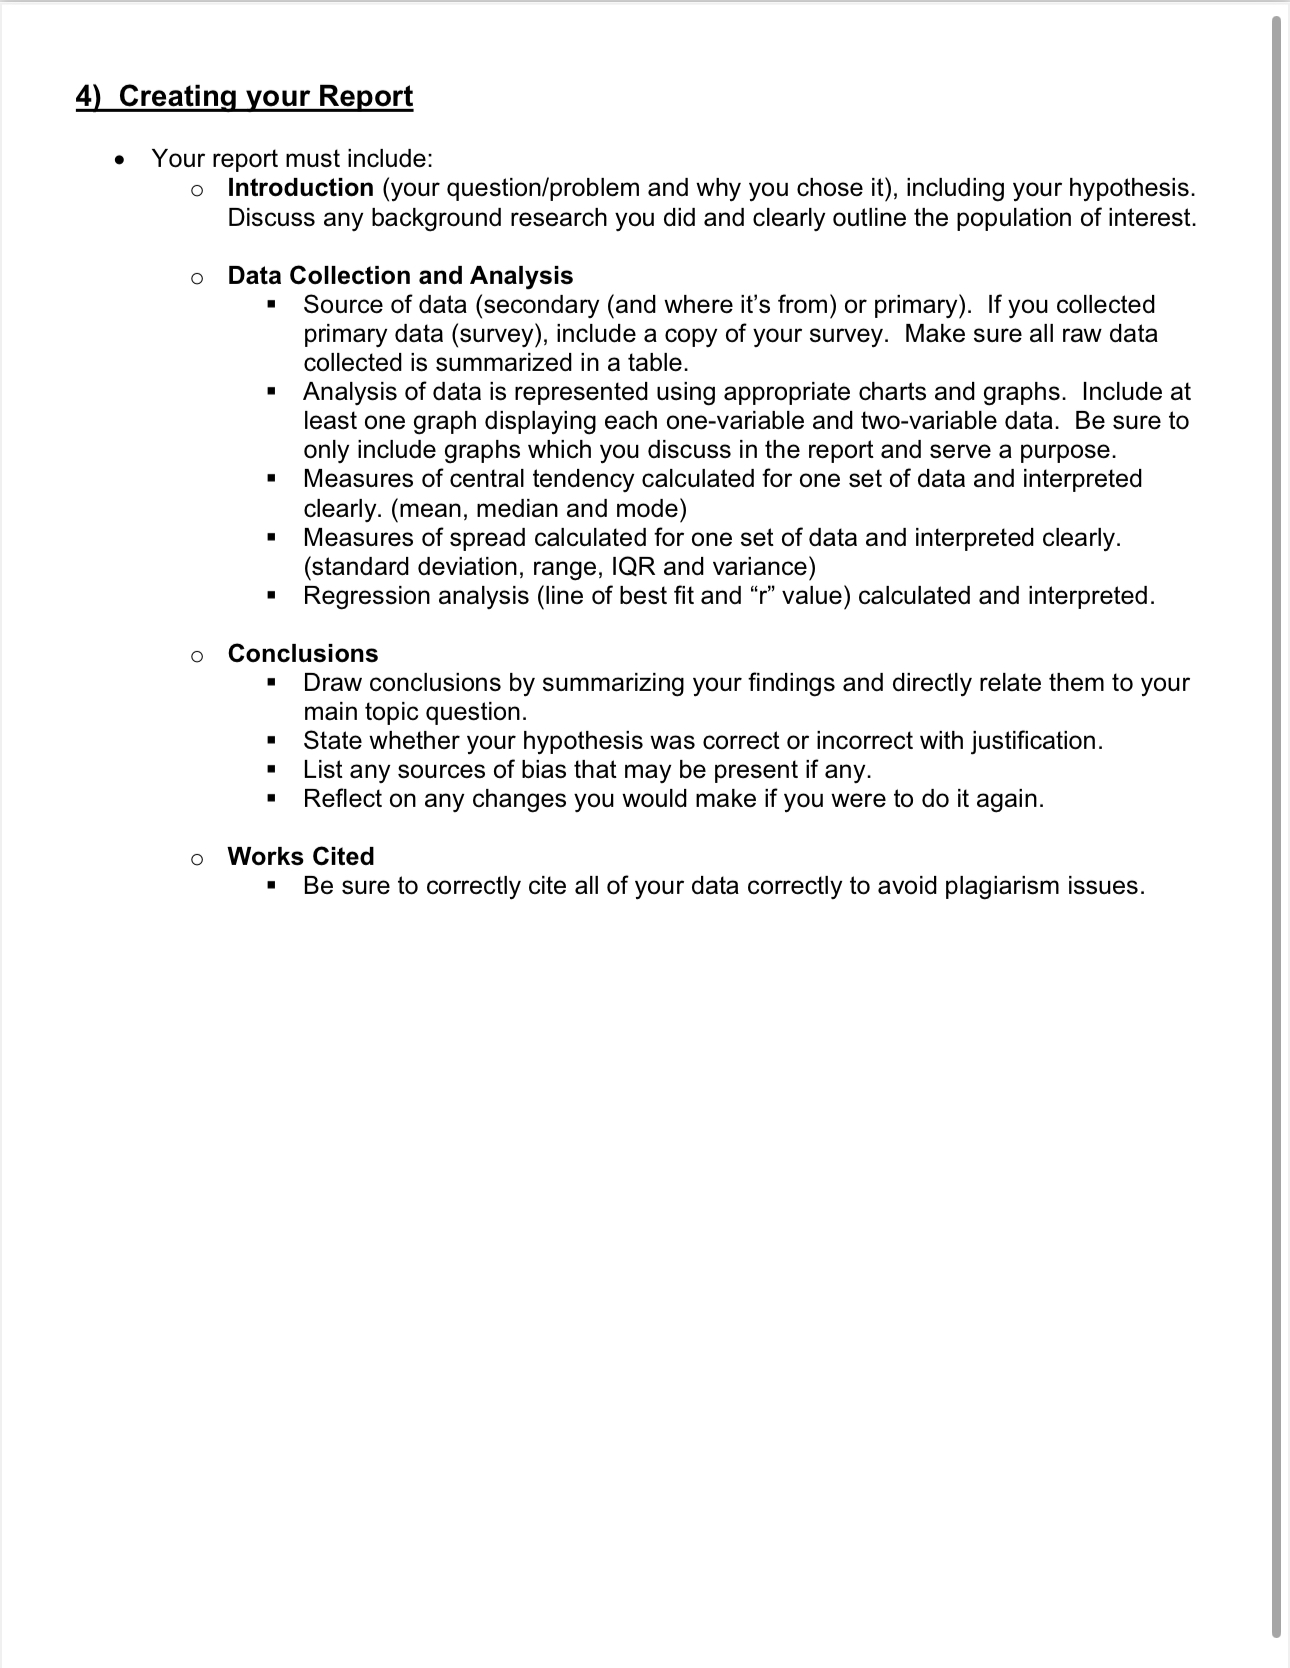
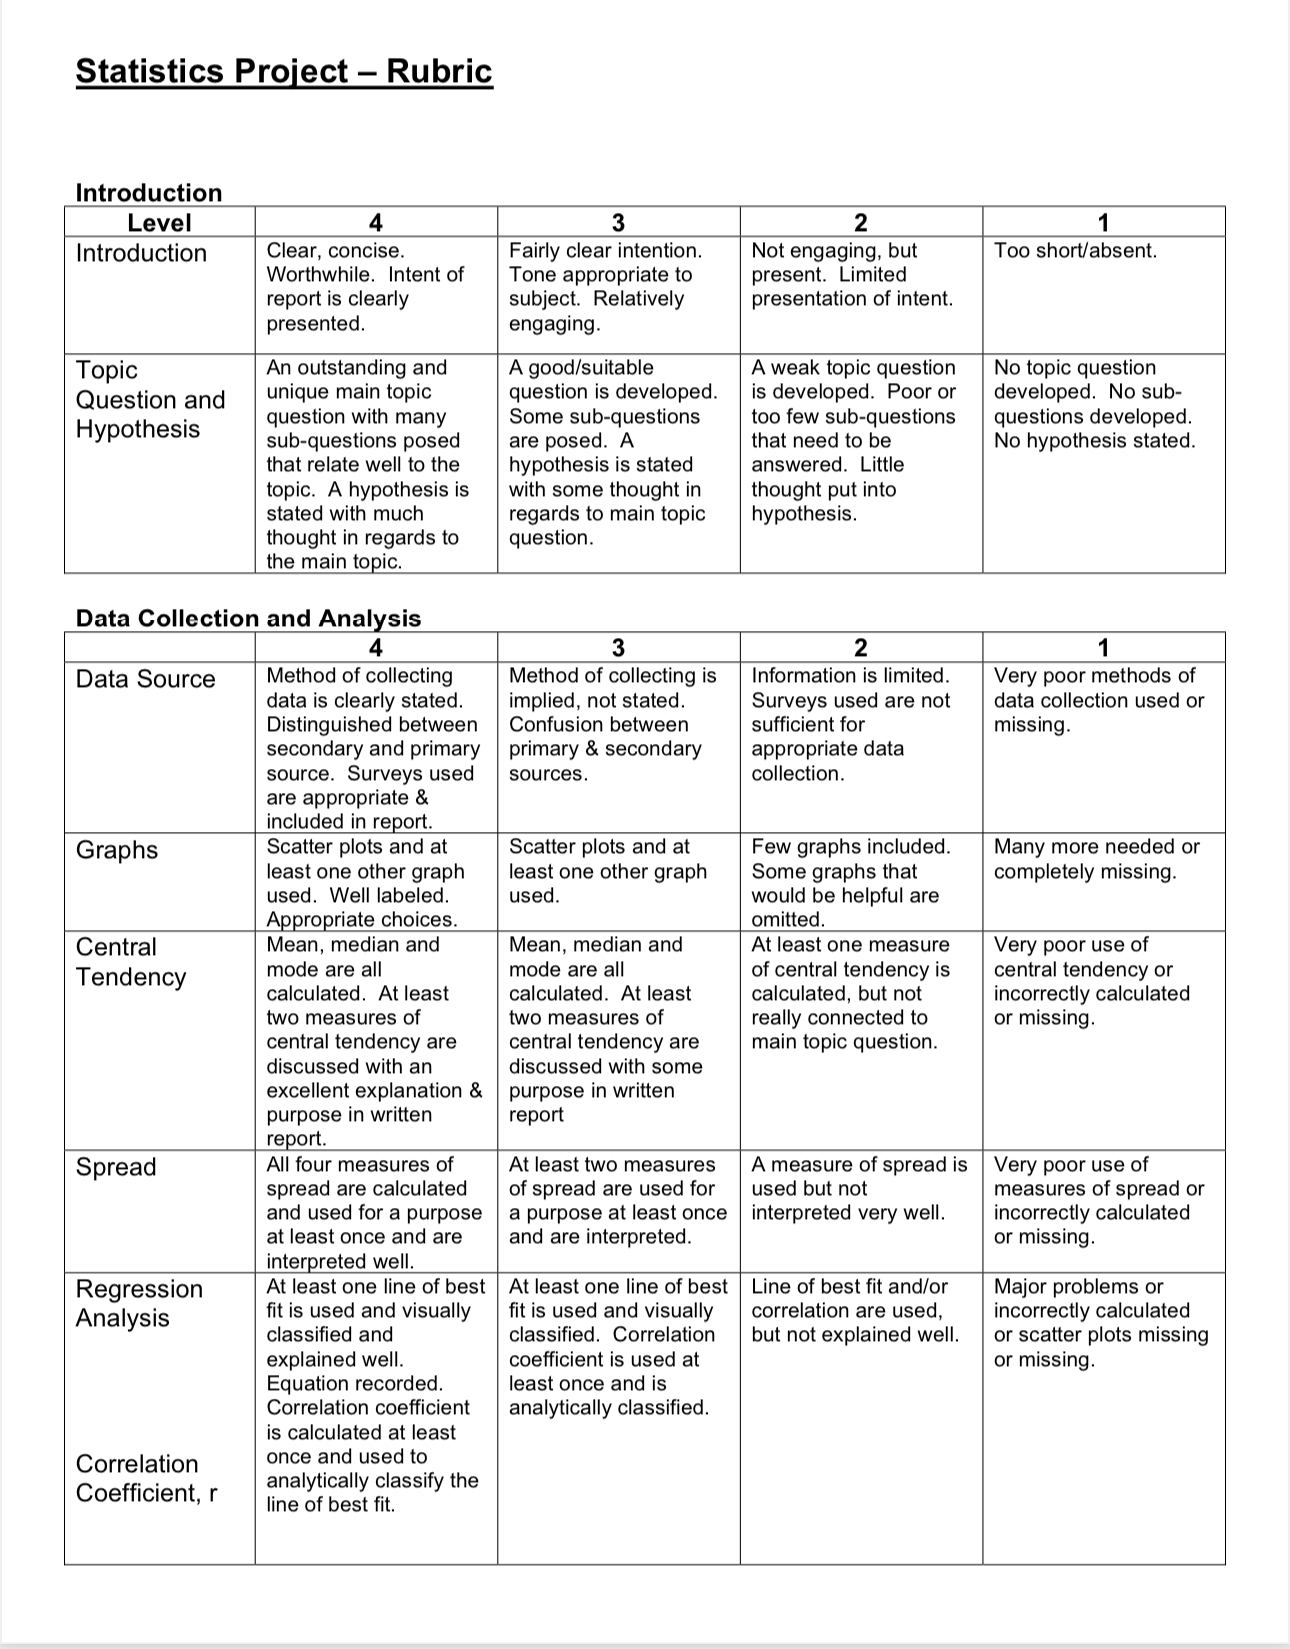
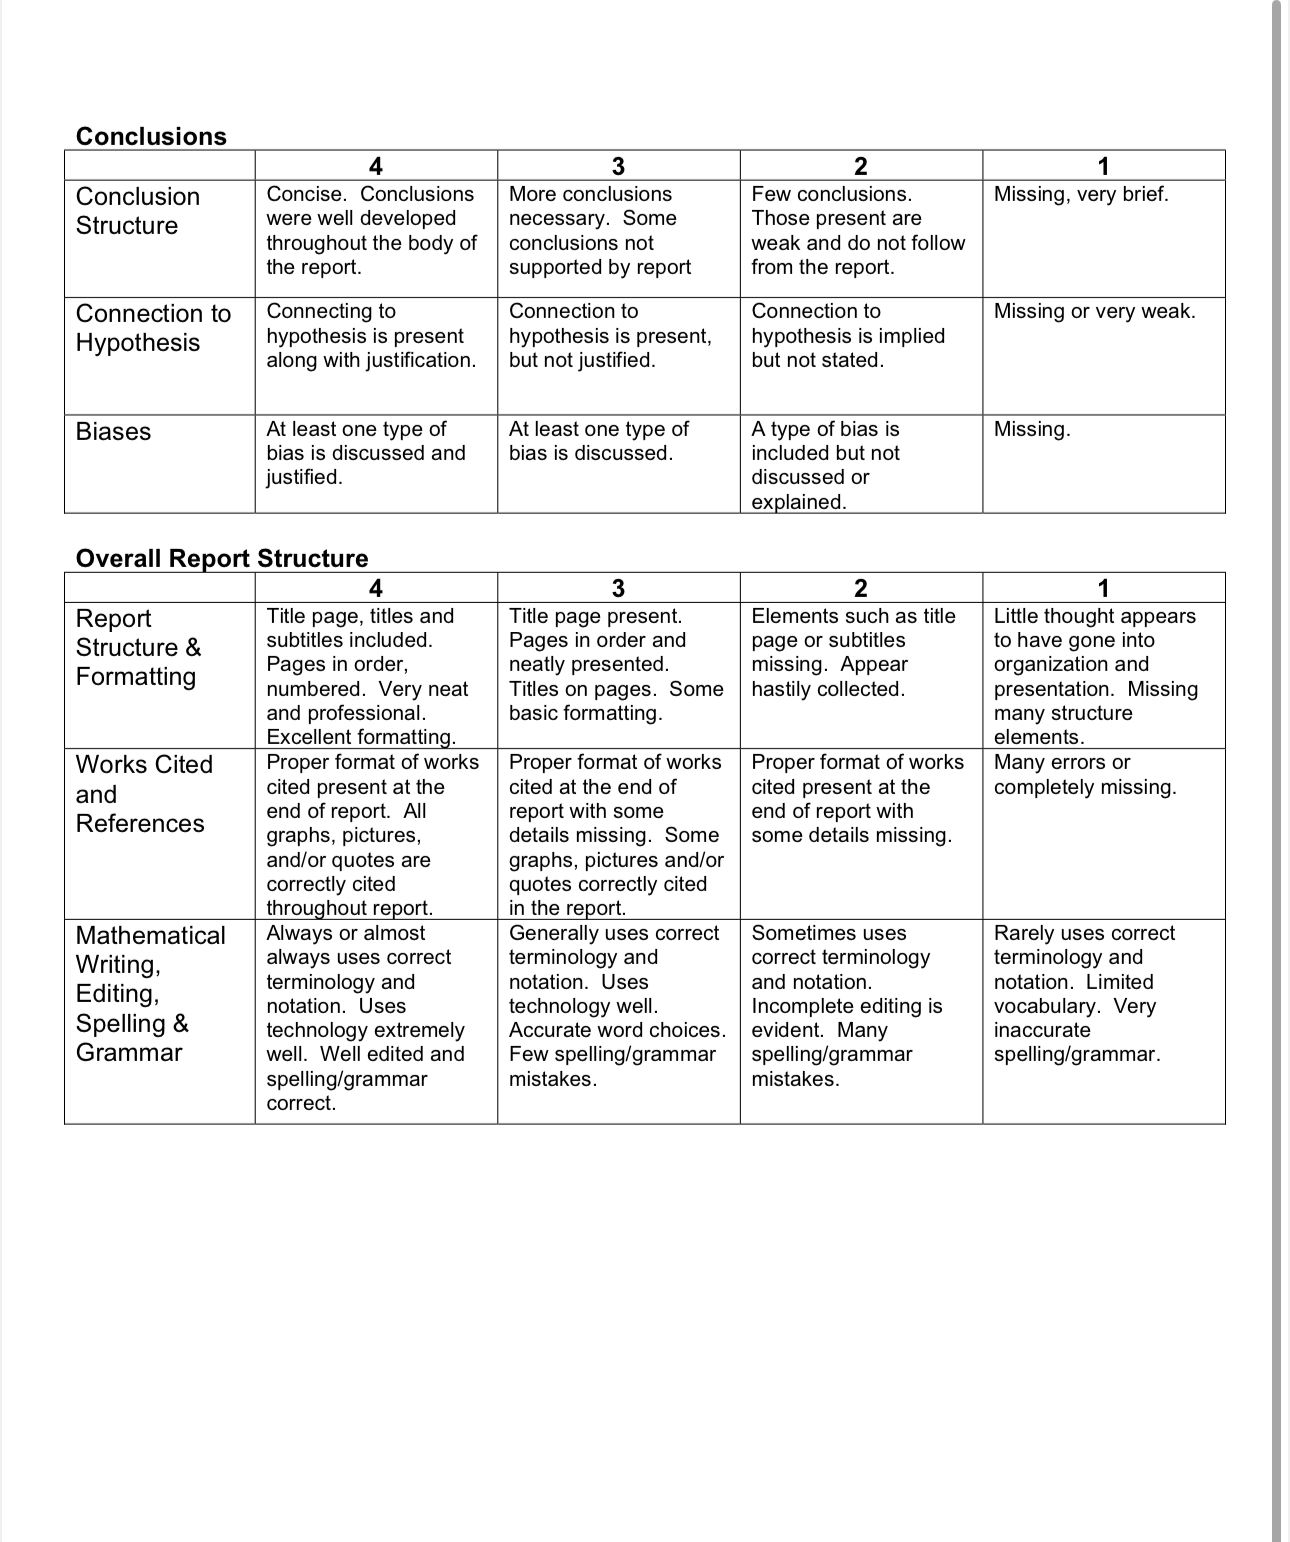 1) Research Question & Hypothesis Decide on a \"question\" a topic or problem of interest to you that can be investigated or solved. Something that you will be able to collect some data on in order to draw some conclusions. Make a hypothesis on the outcome of your research. Predict what you think may be the result of your investigating and why. 2) Data Collection e This can be done in a variety of ways: o Some initial research online may help direct you in terms of looking for a relationship. This may help you become more precise in your question of choice or alter your hypothesis so it is more specific. o You may choose to use Stats Canada or other websites (nhl.com etc) as a resource for Secondary Data. Make sure any websites used are cited properly in your final report. o Another method would be to design a survey of your own to collect Primary Data. You can use an electronic tool (surveymonkey.com) or simple paper copies. Make sure you use questioning that allows you to analyse your data effectively. (limit open response answers) Keep in mind your \"target\" audience when administering your survey and try to eliminate any bias. e Make sure you have enough data to ensure validity of your conclusions. 3) Analysing your Data (using Excel Your analysis should include one-variable and two-variable calculations: o Present your findings using graphs (include at least one of each \"one-variable\" and \"two-variable\") and an explanation of what you see in each. Consider which type to use and whether to include any outliers. o Perform at least one regression analysis to determine if a linear correlation represents your data. Record and interpret the \"r \" value. o Mean, median and mode for a single set of data and what measure best represents your findings o Range, IQR, standard deviation and variance for a single set of data and comment on the dispersion of the values (may be calculated using Excel or Fathom) 4) Creating your Report e Your report must include: o Introduction (your question/problem and why you chose it), including your hypothesis. Discuss any background research you did and clearly outline the population of interest. o Data Collection and Analysis Source of data (secondary (and where it's from) or primary). If you collected primary data (survey), include a copy of your survey. Make sure all raw data collected is summarized in a table. Analysis of data is represented using appropriate charts and graphs. Include at least one graph displaying each one-variable and two-variable data. Be sure to only include graphs which you discuss in the report and serve a purpose. Measures of central tendency calculated for one set of data and interpreted clearly. (mean, median and mode) Measures of spread calculated for one set of data and interpreted clearly. (standard deviation, range, IQR and variance) Regression analysis (line of best fit and \"r" value) calculated and interpreted. o Conclusions Draw conclusions by summarizing your findings and directly relate them to your main topic question. State whether your hypothesis was correct or incorrect with justification. List any sources of bias that may be present if any. Reflect on any changes you would make if you were to do it again. o Works Cited Be sure to correctly cite all of your data correctly to avoid plagiarism issues. Statistics Project Rubric Introduction Level 4 3 2 1 Introduction Clear, concise. Fairly clear intention. Not engaging, but Too short/absent. Worthwhile. Intent of Tone appropriate to present. Limited report is clearly subject. Relatively presentation of intent. presented. engaging. Topic An outstanding and A good/suitable A weak topic question | No topic question Question and | unique main topic question is developed. | is developed. Pooror | developed. No sub- H thesi question with many Some sub-questions too few sub-questions questions developed. ypothesis that need to be Data Collection Data Source sub-questions posed that relate well to the topic. A hypothesis is stated with much thought in regards to the main topic. and Analysis 4 Method of collecting data is clearly stated. Distinguished between secondary and primary source. Surveys used are appropriate & included in report. are posed. A hypothesis is stated with some thought in regards to main topic question. 3 Method of collecting is implied, not stated. Confusion between primary & secondary sources. answered. Little thought put into hypothesis. 2 Information is limited. Surveys used are not sufficient for appropriate data collection. No hypothesis stated. 1 Very poor methods of data collection used or missing. Graphs Scatter plots and at Scatter plots and at Few graphs included. Many more needed or least one other graph least one other graph Some graphs that completely missing. used. Well labeled. used. would be helpful are Appropriate choices. omitted. Central Mean, median and Mean, median and At least one measure Very poor use of Tendency mode are all mode are all of central tendency is central tendency or calculated. At least calculated. At least calculated, but not incorrectly calculated two measures of two measures of really connected to or missing. central tendency are central tendency are main topic question. discussed with an discussed with some excellent explanation & | purpose in written purpose in written report report. Spread All four measures of At least two measures | A measure of spread is | Very poor use of spread are calculated of spread are used for | used but not measures of spread or and used for a purpose | a purpose at least once | interpreted very well. incorrectly calculated at least once and are and are interpreted. or missing. interpreted well. Regression At least one line of best | At least one line of best | Line of best fit and/or Major problems or Analysis fit is used and visually | fitis used and visually | correlation are used, incorrectly calculated classified and classified. Correlation | but not explained well. | or scatter plots missing explained well. coefficient is used at or missing. Equation recorded. least once and is Correlation coefficient | analytically classified. is calculated at least Correlation once and used to Coefficient, r analytically classify the line of best fit. Conclusions 4 3 2 1 Conclusion Structure Concise. Conclusions were well developed throughout the body of the report. More conclusions necessary. Some conclusions not supported by report Few conclusions. Those present are weak and do not follow from the report. Missing, very brief. Connection to Connecting to Connection to Connection to Missing or very weak. Hypothesis hypothesis is present hypothesis is present, hypothesis is implied along with justification. | but not justified. but not stated. Biases At least one type of At least one type of A type of bias is Missing. bias is discussed and bias is discussed. included but not justified. discussed or explained. Overall Report Structure 4 3 2 1 Report Title page, titles and Title page present. Elements such as title Little thought appears Structure & subtitles included. Pages in order and page or subtitles to have gone into F attin Pages in order, neatly presented. missing. Appear organization and ofra 9 numbered. Very neat Titles on pages. Some | hastily collected. presentation. Missing and professional. basic formatting. many structure Excellent formatting. elements. Works Cited Proper format of works | Proper format of works | Proper format of works | Many errors or and cited present at the cited at the end of cited present at the completely missing. References end of report. All report with some end of report with graphs, pictures, and/or quotes are correctly cited throughout report. details missing. Some graphs, pictures and/or quotes correctly cited in the report. some details missing. Mathematical Writing, Editing, Spelling & Grammar Always or almost always uses correct terminology and notation. Uses technology extremely well. Well edited and spelling/grammar correct. Generally uses correct terminology and notation. Uses technology well. Accurate word choices. Few spelling/grammar mistakes. Sometimes uses correct terminology and notation. Incomplete editing is evident. Many spelling/grammar mistakes. Rarely uses correct terminology and notation. Limited vocabulary. Very inaccurate spelling/grammar
 Step by Step Solution
There are 3 Steps involved in it
Step: 1

Get Instant Access to Expert-Tailored Solutions
See step-by-step solutions with expert insights and AI powered tools for academic success
Step: 2

Step: 3
Ace Your Homework with AI
Get the answers you need in no time with our AI-driven, step-by-step assistance
Get Started
Advanced Engineering Mathematics
Authors: Erwin Kreyszig
10th edition
470458364, 470458365, 978-0470458365