
I need help with this project, please.
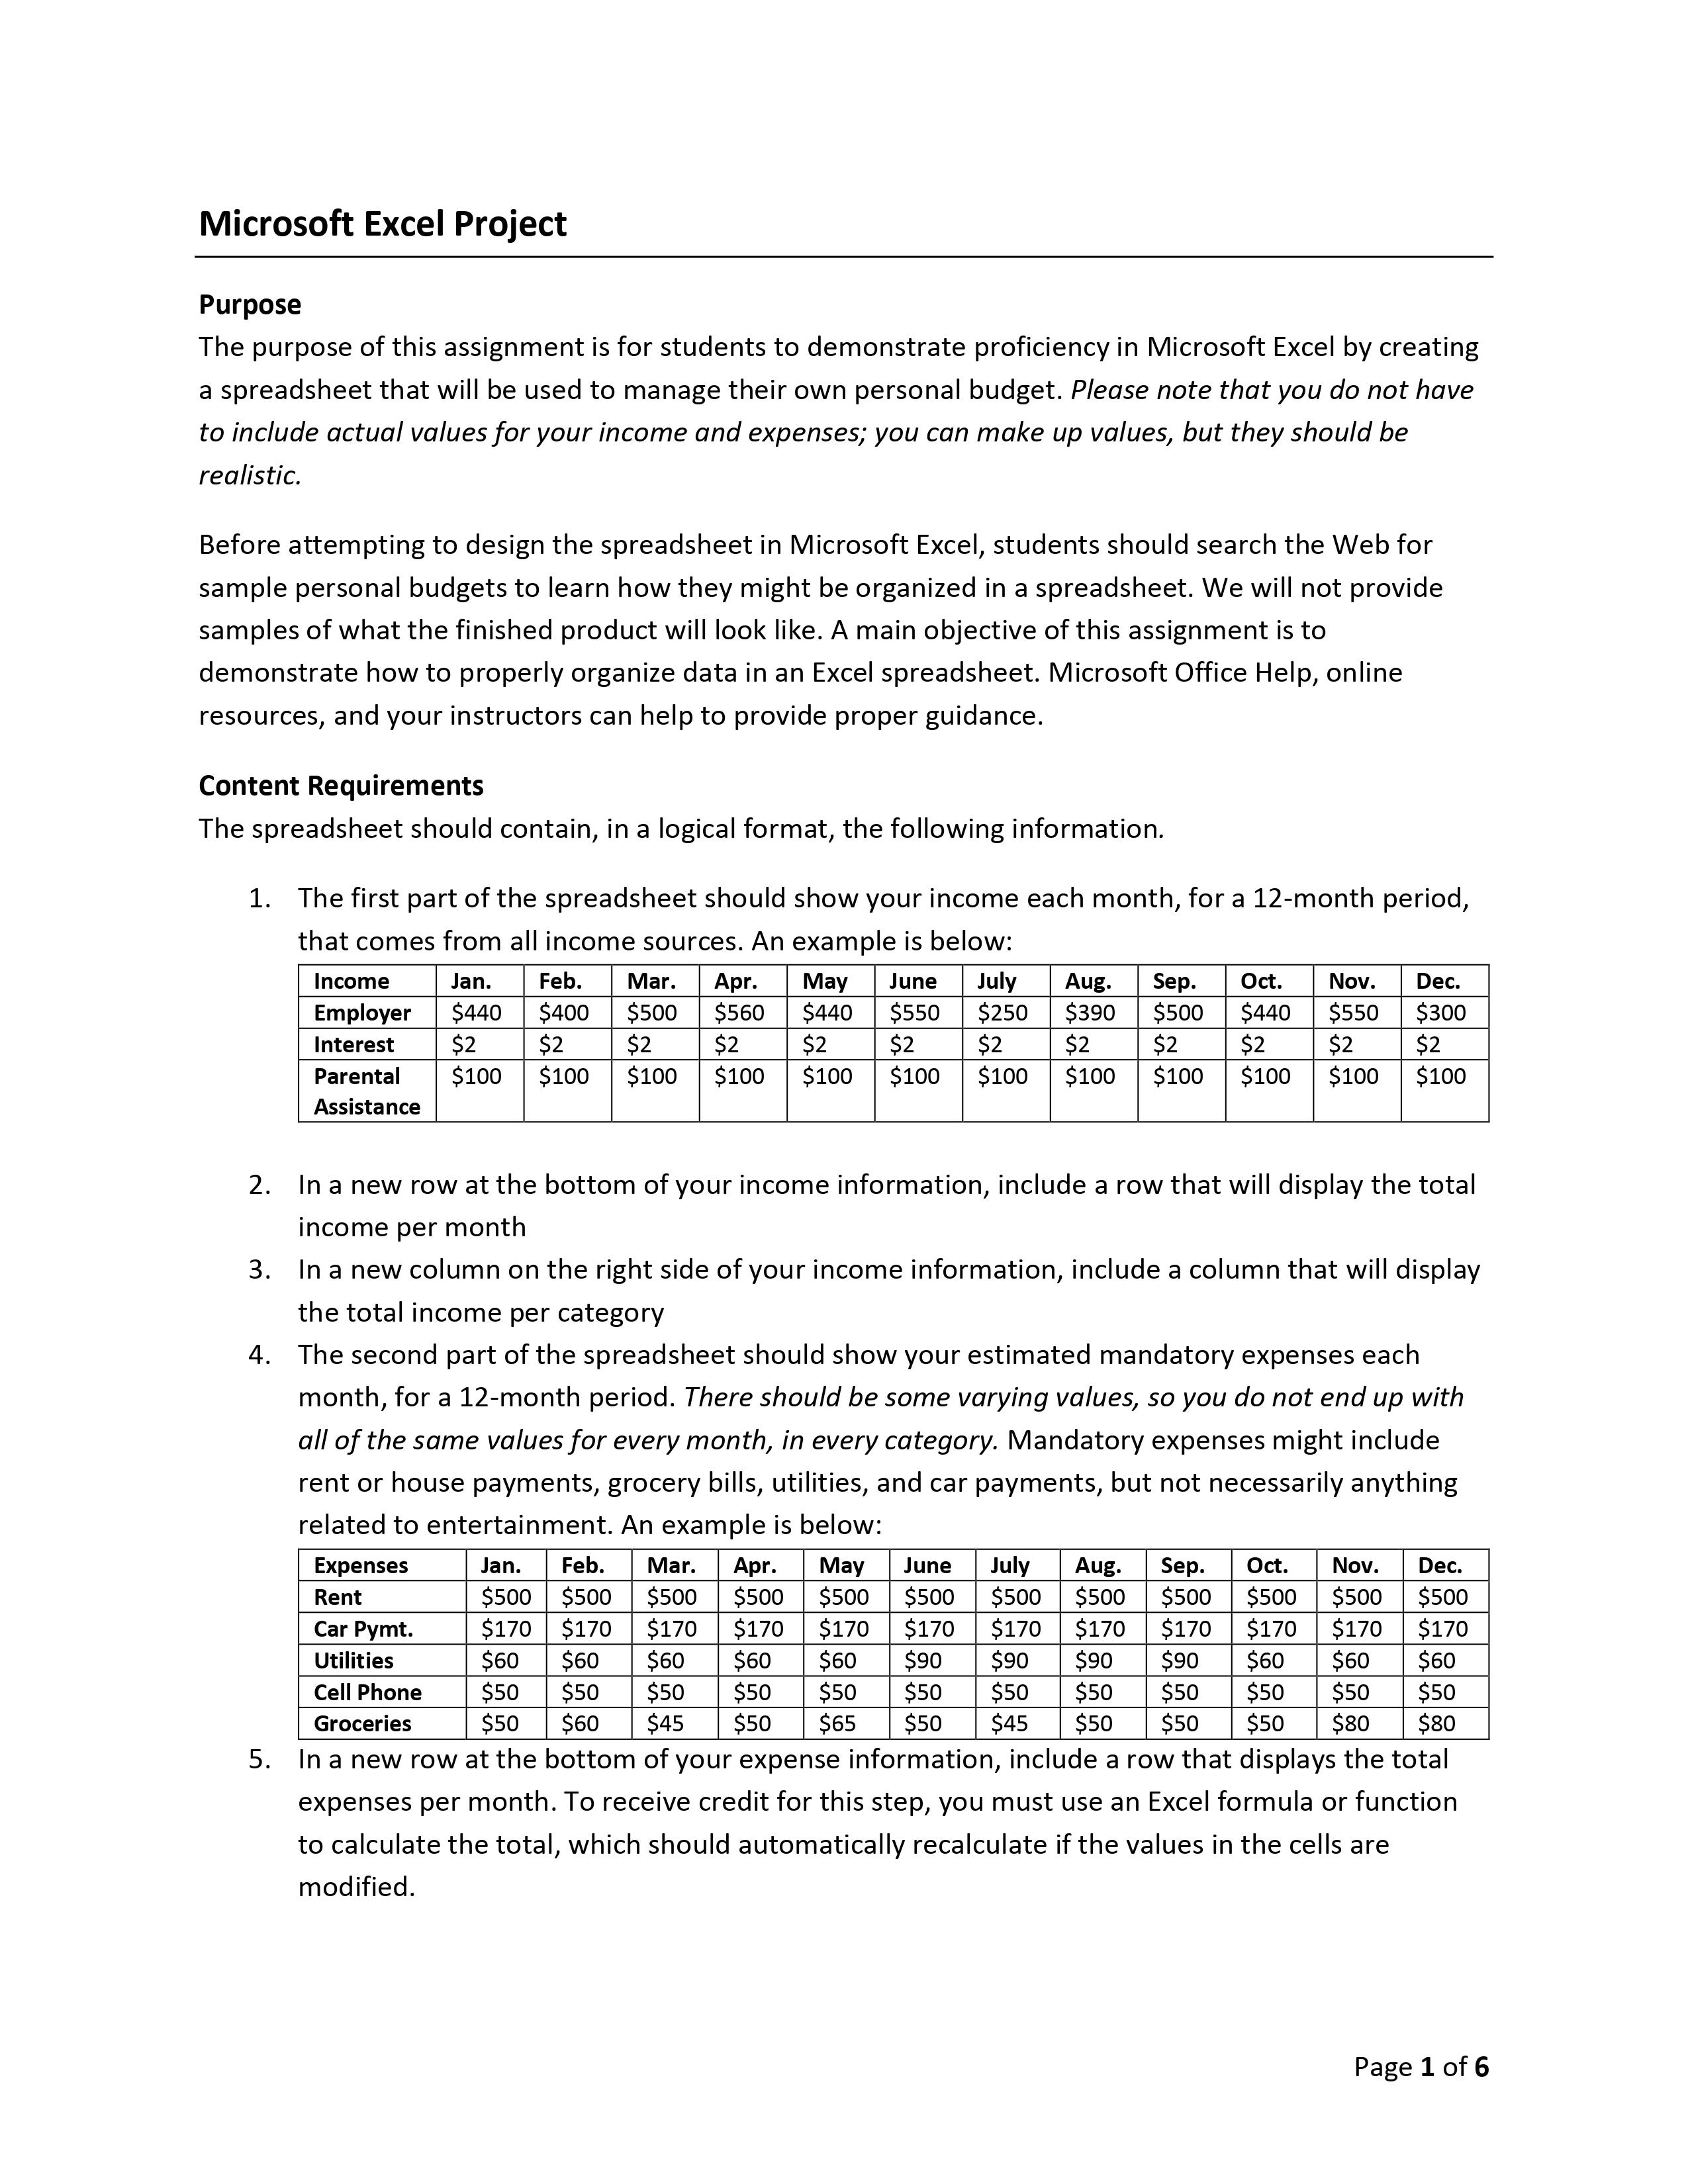
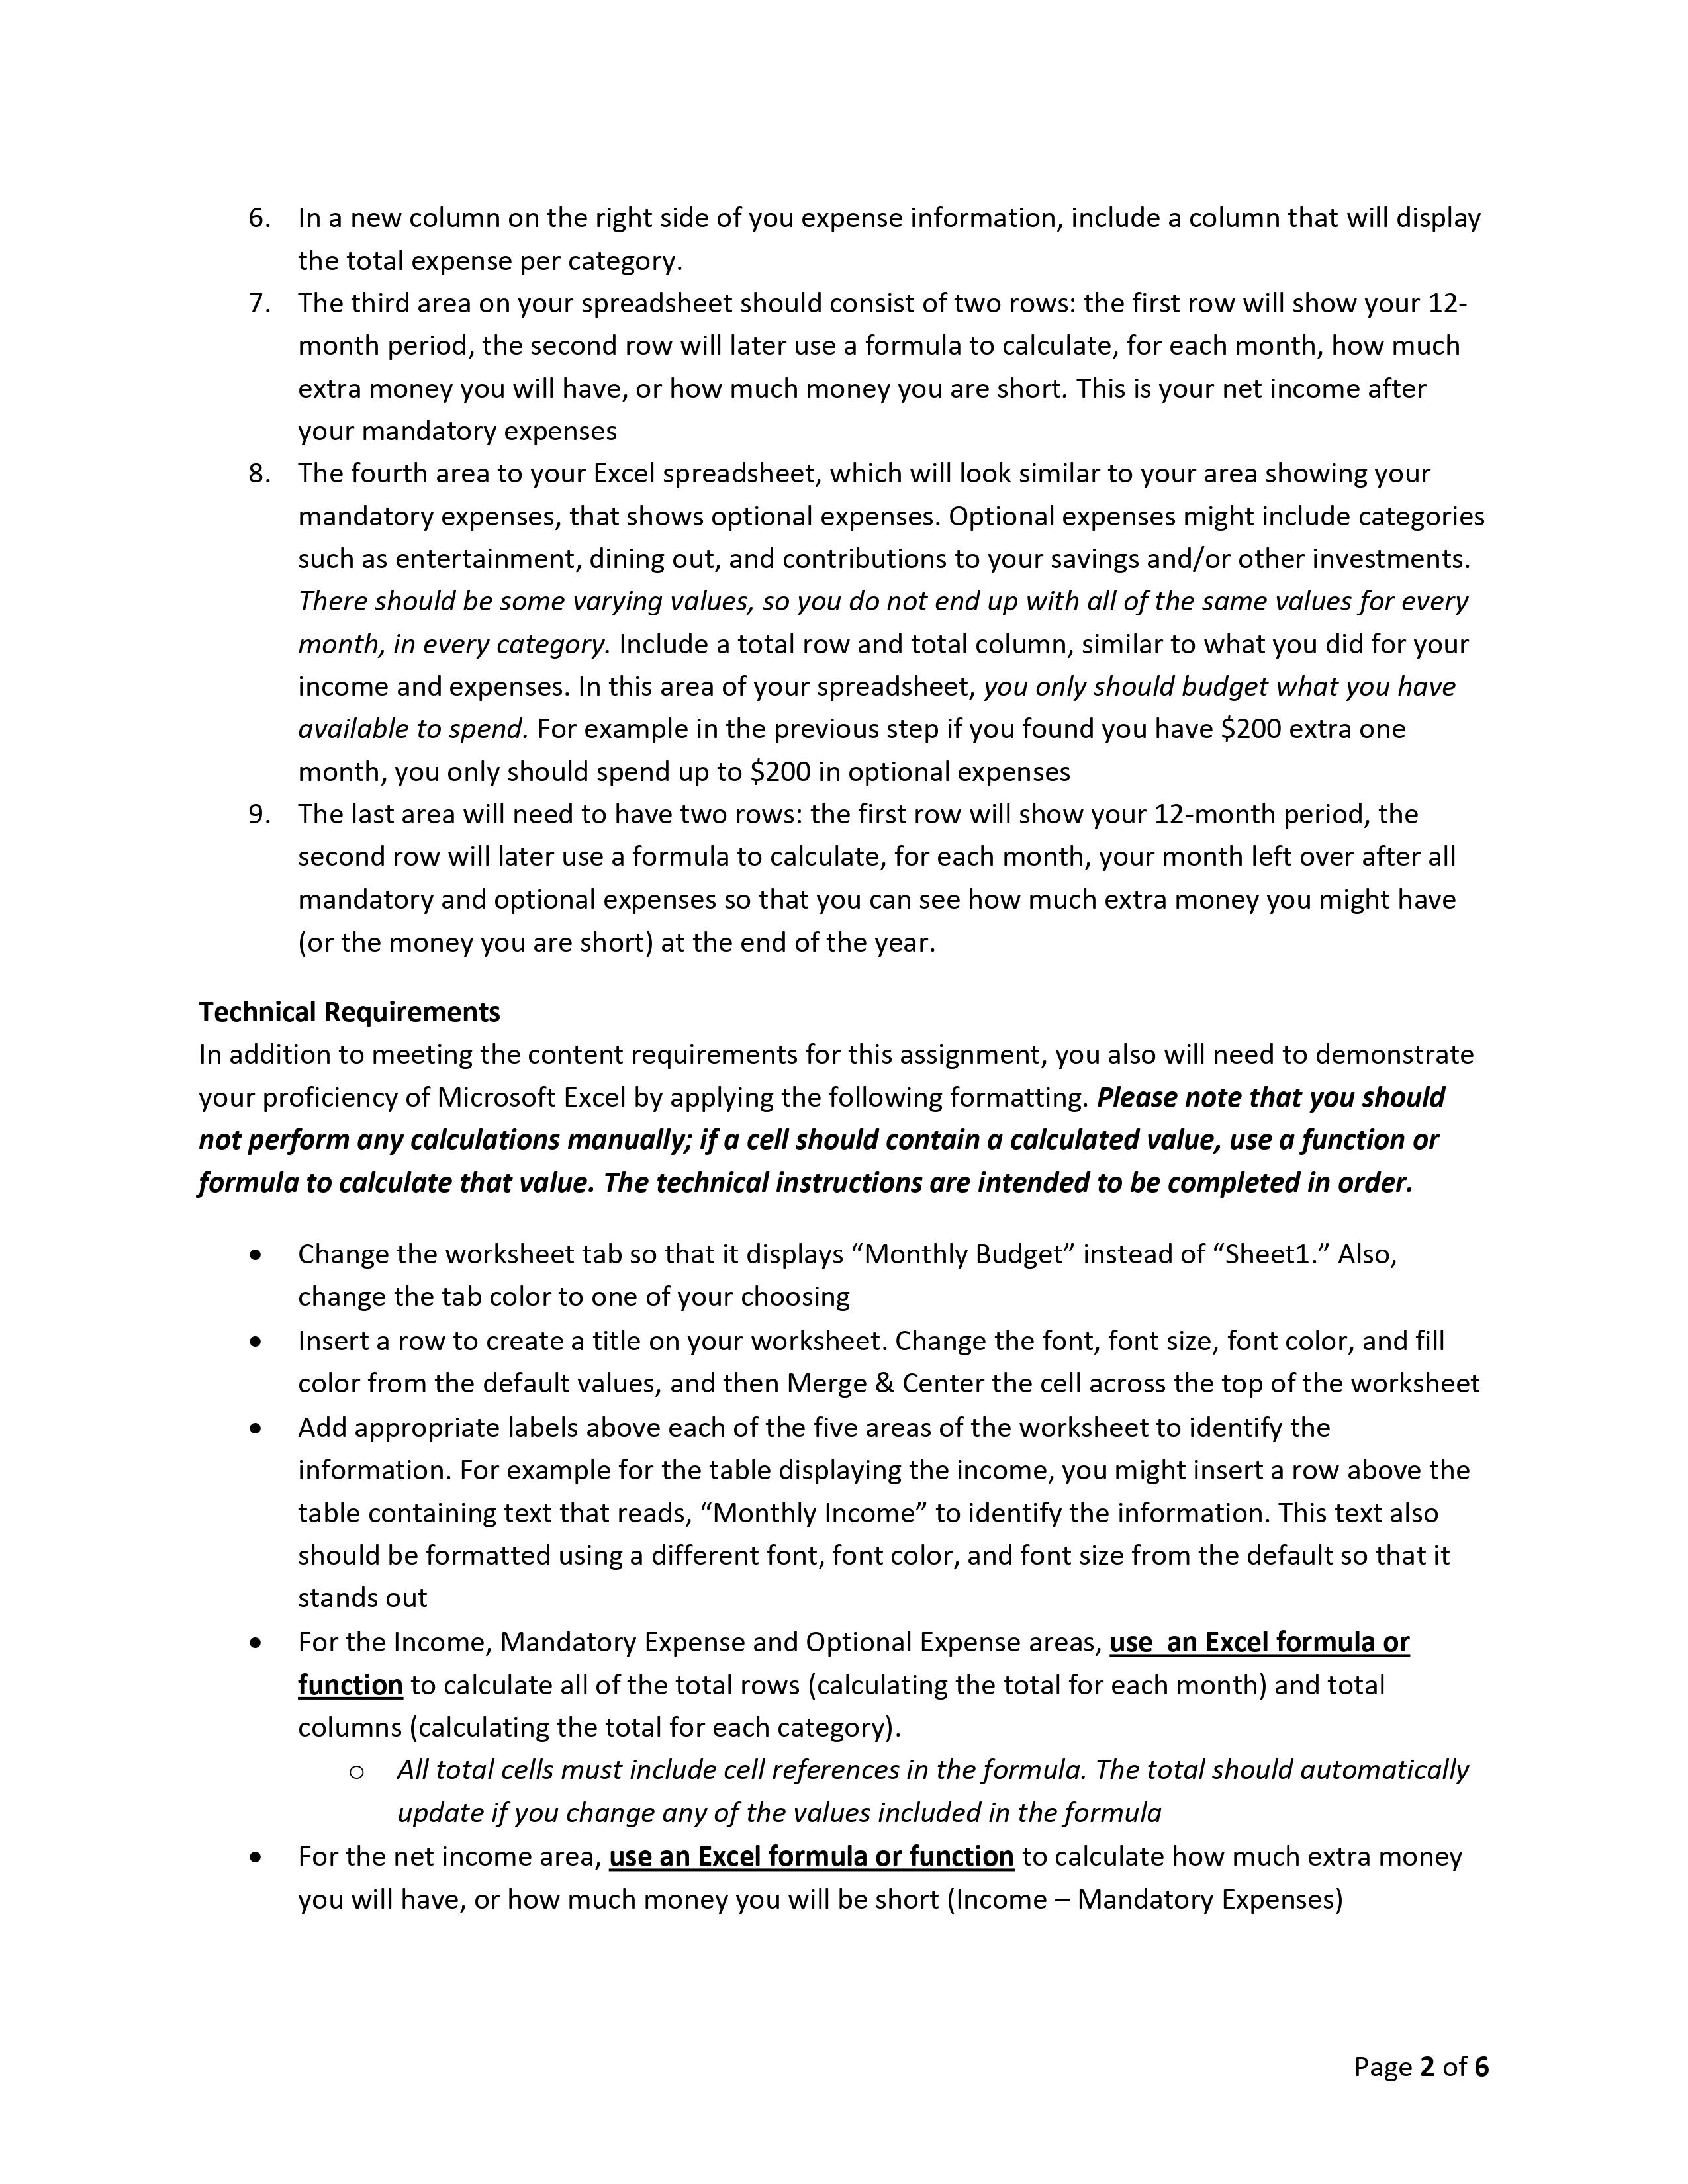
Microsoft Excel Project Purpose The purpose of this assignment is for students to demonstrate proficiency in Microsoft Excel by creating a spreadsheet that will be used to manage their own personal budget. Please note that you do not have to include actual values for your income and expenses; you can make up values, but they should be realistic. Before attempting to design the spreadsheet in Microsoft Excel, students should search the Web for sample personal budgets to learn how they might be organized in a spreadsheet. We will not provide samples of what the finished product will look like. A main objective ofthis assignment is to demonstrate how to properly organize data in an Excel spreadsheet. Microsoft Office Help, online resources, and your instructors can help to provide proper guidance. Content Requirements The spreadsheet should contain, in a logical format, the following information. 1. The first part ofthe spreadsheet should show your income each month, for a 12-month period, that comes from all income sources. An example is below: Income Jan. Feb. Dec. Employer $440 $400 $300 Interest $2 $2 $2 Parental $100 $100 $100 Assistance 2. In a new row at the bottom of your income information, include a row that will display the total income per month 3. In a new column on the right side of your income information, include a column that will display the total income per category 4. The second part of the spreadsheet should show your estimated mandatory expenses each month, for a 12-month period. There should be some varying values, so you do not end up with all ofthe same valuesfor every month, in every category. Mandatory expenses might include rent or house payments, grocery bills, utilities, and car payments, but not necessarily anything related to entertainment. An example is below: Expenses Jan. Feb. Mar. Apr. May June July Aug. Sep. Oct. Nov. Dec. Rent $500 $500 $500 $500 $500 $500 $500 $500 $500 $500 $500 $500 Car Pymt. $170 $170 $170 $170 $170 $170 Utilities $90 $90 $90 $60 $60 $60 Cellphone $50 $50 $50 $50 $50 $50 $50 $50 $50 $50 $50 $50 Groceries $50 $60 $45 $50 $65 $50 $45 $50 $50 $50 $80 $80 5. In a new row at the bottom of your expense information, include a row that displays the total expenses per month. To receive credit for this step, you must use an Excel formula or function to calculate the total, which should automatically recalculate if the values in the cells are modified. Page 1 of 6 6. In a new column on the right side of you expense information, include a column that will display the total expense per category. 7. The third area on your spreadsheet should consist of two rows: the first row will show your 12- month period, the second row will later use a formula to calculate, for each month, how much extra money you will have, or how much money you are short. This is your net income after your mandatory expenses 8. The fourth area to your Excel spreadsheet, which will look similar to your area showing your mandatory expenses, that shows optional expenses. Optional expenses might include categories such as entertainment, dining out, and contributions to your savings and/or other investments. There should be some varying values, so you do not end up with all of the same values for every month, in every category. Include a total row and total column, similar to what you did for your income and expenses. In this area of your spreadsheet, you only should budget what you have available to spend. For example in the previous step if you found you have $200 extra one month, you only should spend up to $200 in optional expenses 9. The last area will need to have two rows: the first row will show your 12-month period, the second row will later use a formula to calculate, for each month, your month left over after all mandatory and optional expenses so that you can see how much extra money you might have (or the money you are short) at the end ofthe year. Technical Requirements In addition to meeting the content requirements for this assignment, you also will need to demonstrate your proficiency of Microsoft Excel by applying the following formatting. Please note that you should not perform any calculations manually; if a cell should contain a calculated value, use a function or formula to calculate that value. The technical instructions are intended to be completed in order. 0 Change the worksheet tab so that it displays "Monthly Budget\" instead of \"Sheetl." Also, change the tab color to one of your choosing 0 Insert a row to create a title on your worksheet. Change the font, font size, font color, and fill color from the default values, and then Merge & Center the cell across the top of the worksheet 0 Add appropriate labels above each of the five areas of the worksheet to identify the information. For example for the table displaying the income, you might insert a row above the table containing text that reads, "Monthly Income\" to identify the information. This text also should be formatted using a different font, font color, and font size from the default so that it stands out 0 For the Income, Mandatory Expense and Optional Expense areas, use an Excel formula or function to calculate all of the total rows (calculating the total for each month) and total columns (calculating the total for each category). 0 All total cells must include cell references in the formula. The total should automatically update If you change any of the values included in the formula 0 For the net income area, use an Excel formula or function to calculate how much extra money you will have, or how much money you will be short (Income Mandatory Expenses) Page 2 of 6 For the final area in your spreadsheet, use an Excel formula or function to calculate how much money you will have (or if you are short) at the end of the year (Income Mandatory Expenses Optional Expenses) All Column Widths should be set to properly display all contents in the column (nothing should be cut off or displaying unnecessary symbols, and columns shouldn't be so wide that there is a lot of blank space in each cell) For all cells that contain a dollar value, apply the Accounting Number Format For the last area of your spreadsheet, apply conditional formatting to each cell in this area. You should use the Conditional Formatting feature, and not manually format each cell based on its value. 0 The font color should be green if the value in the cell is greater than zero 0 The font color should be green if the value is equal to zero 0 The font color should be red if the value in the cell is less than zero. 0 All three formats should be applied to all cells, as they should automatically Change font color if the values are modified. Create cells in your worksheet (near the table showing your mandatory monthly expenses) that use Excel functions to calculate the following using your mandatory monthly expense totals: o The total from the month where the mandatory monthly expenses are the lowest 0 The total from the month where the mandatory monthly expenses are the highest 0 The average amount of money you spend on mandatory expenses in a 12-month period In a new worksheet (not a new workbook), create two charts (both charts should display side byside on the same, new worksheet): o The first chart should be a 3-D Column Chart that shows the income you receive each month. The horizontal axis should display the Months, and the vertical axis should display the dollar values. Include an appropriate chart title and data labels. Each column in the chart should be formatted as a different color. An example is below (your chart does not need to look exactly like this; the purpose of this sample chart is to help clarify the instruction): Page 3 of 6 Monthly Income I $1,200 n $1,000 $800 0 m $600 e $400 $200 A m so 668$ro$e o geayvxovooyaaee u