I need help with this question: don't take long thank you! Attempts O l 3 I Keep the Highest3i'4 3. Changes in the money supply
I need help with this question: don't take long thank you!
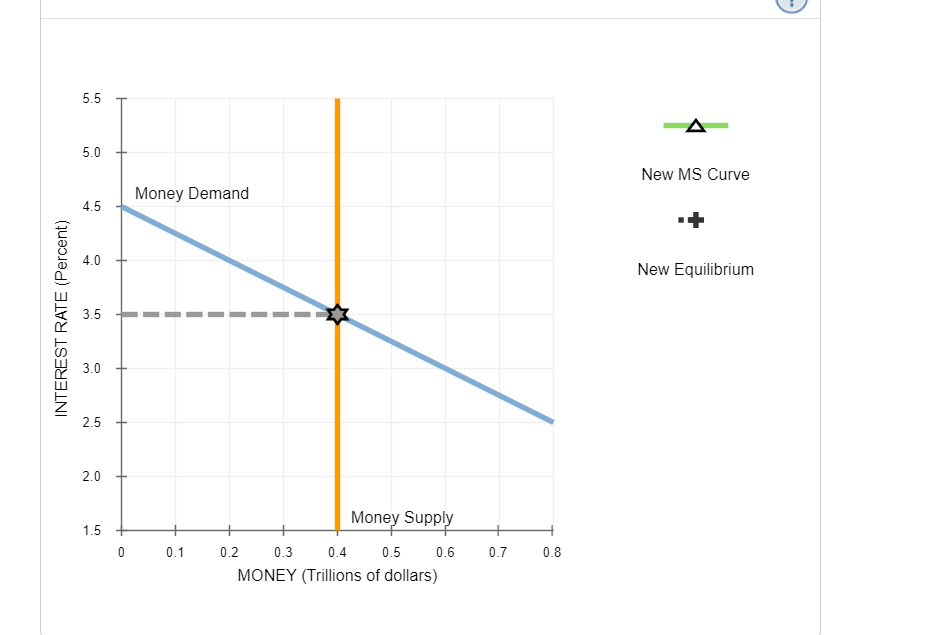
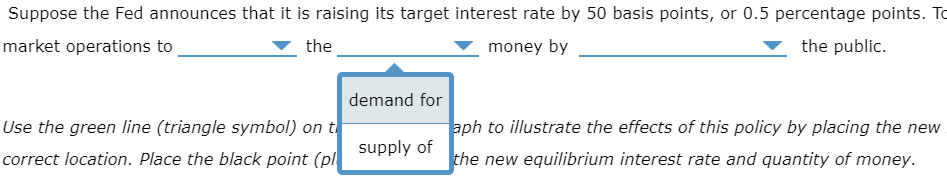
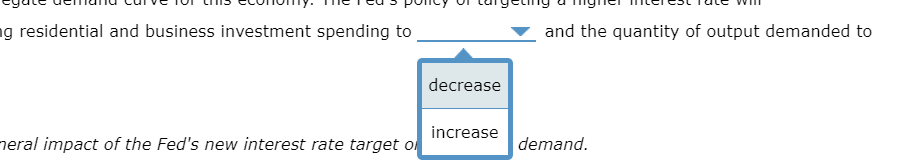
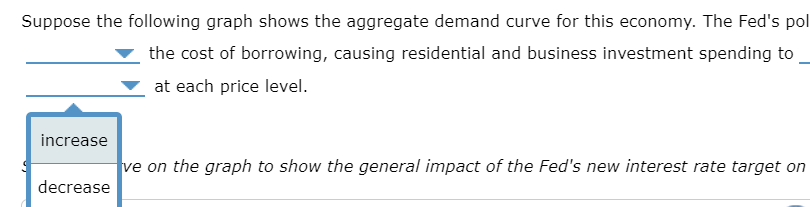
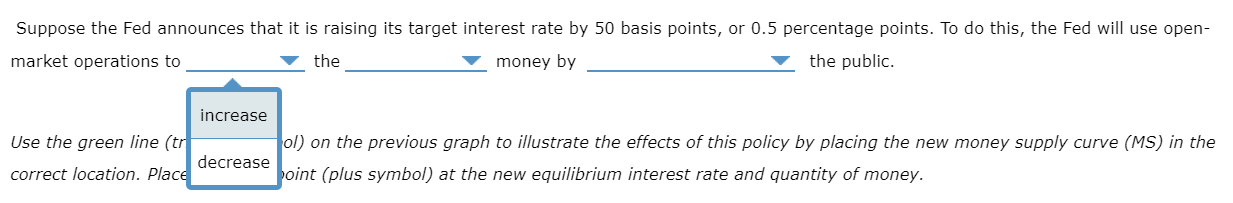
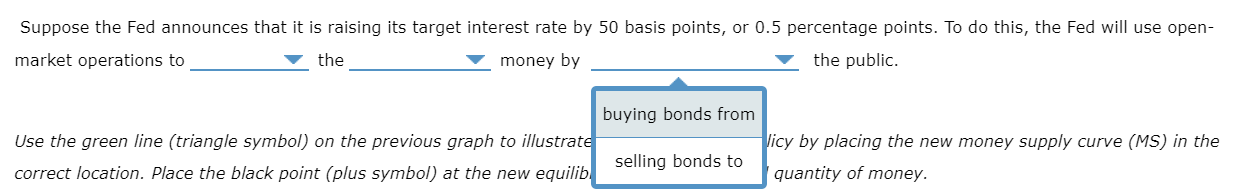
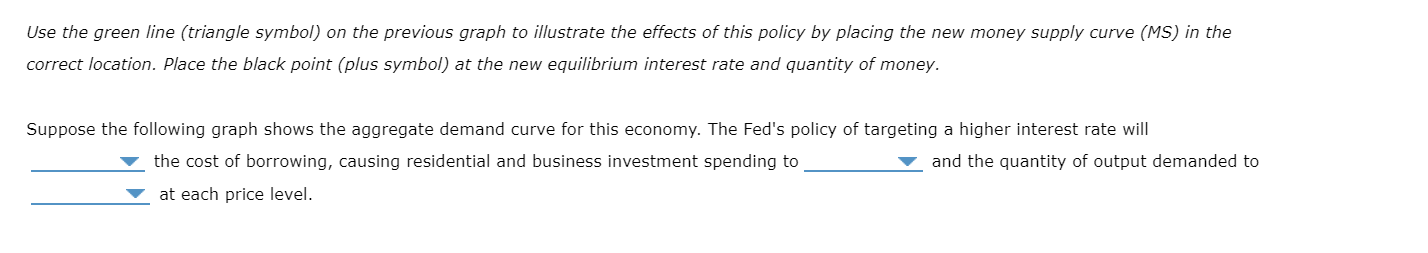
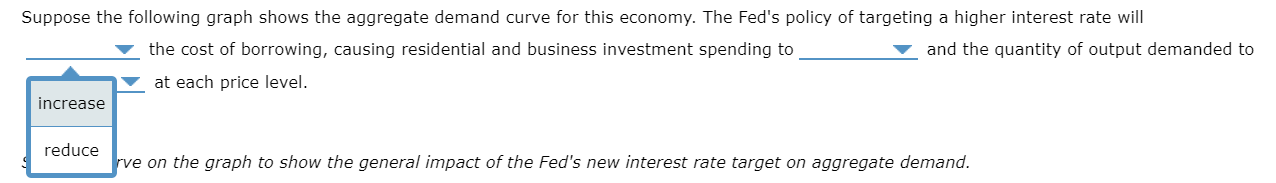
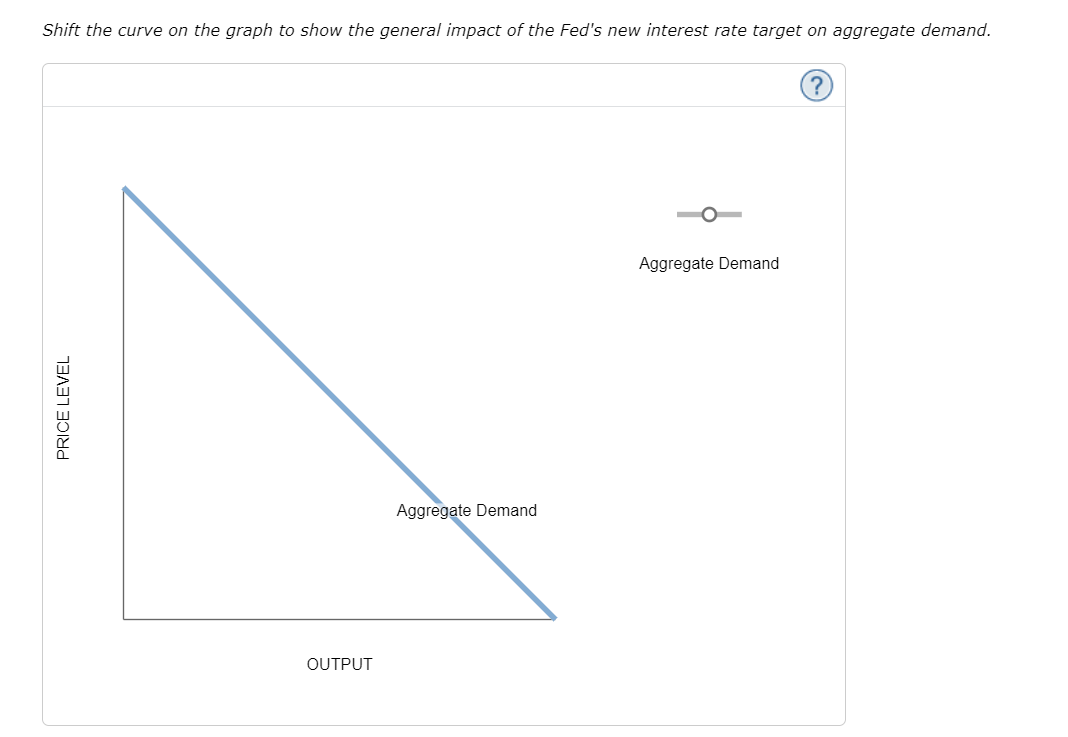
Attempts O l 3 I Keep the Highest3i'4 3. Changes in the money supply The following graph represents the money market for some hypothetical economy. This economy is similar to the United States in the sense that it has a central bank called the Fed, but a major difference is that this economy is closed (and therefore does not have any interaction with other world economies). The money market is currently in equilibrium at an interest rate of 3.5% and a quantity of money equal to $0.4 trillion, designated on the graph by the grey star symbol. 5.5 T A 5.0 New MS Curve Money Demand 4.5 4.0 New Equilibrium 3.5 INTEREST RATE (Percent) 3.0 2.5 2.0 Money Supply 1.5 0 0.1 0.2 0.3 0.4 0.5 0.6 0.7 0.8 MONEY (Trillions of dollars)Suppose the Fed announces that it is raising its target interest rate by 50 basis points, or 0.5 percentage points. To do this, the Fed will use open market operations to V the V moneyr by V the public. increase Use the green line ( t ol) on the previous graph to illustrate the effects of this policy by placing the new money supply curve (MS) in the decrease correct location. Plac. pint (plus symbol) at the new equilibrium interest rate and quantity of money. Suppose the Fed announces that it is raising its target interest rate by 50 basis points, or 0.5 percentage points. To market operations to the money by the public. demand for Use the green line (triangle symbol) on t aph to illustrate the effects of this policy by placing the new correct location. Place the black point (pl supply of the new equilibrium interest rate and quantity of money.Suppose the Fed announces that it is raising its target interest rate by 50 basis points, or 0.5 percentage points. To do this, the Fed will use open market operations to V the V money by V the public. buying bonds from Use the green line (triangle symbol) on the previous graph to illustrat. icy by placing the new money supply curve (MS) in the selling bonds to correct location. Place the black point (plus symbol) at the new eguilib quantity of money. Use the green line ( triangle symbol) on the previous graph to illustrate the effects of this policy by placing the new money supply curve (MS) in the correct location. Place the black point (plus symbol) at the new equilibrium interest rate and quantity of money. Suppose the following graph shows the aggregate demand curve for this economy. The Fed's policy of targeting a higher interest rate will T the cost of borrowing, causing residential and business investment spending to Y and the quantity of output demanded to V at each price level. Suppose the following graph shows the aggregate demand curve for this economy. The Fed's policy of targeting a higher interest rate will Y the cost of borrowing, causing residential and business investment spending to V and the quantityr of output demanded to V at each price level. increase . reduce ve on the graph to show the general impact of the Fed's new interest rate target on aggregate demand. g residential and business investment spending to and the quantity of output demanded to decrease increase heral impact of the Fed's new interest rate target of demand.Suppose the following graph shows the aggregate demand curve for this economy. The Fed's pol v the cost of borrowing, causing residential and business investment spending to _ increase V at each price level. ve on the graph to show the general impact of the Fed's new interest rate target on decrease Shift the curve on the graph to show the general impact of the Fed's new interest rate target on aggregate demand. O Aggregate Demand PRICE LEVEL Aggregate Demand OUTPUT
Step by Step Solution
There are 3 Steps involved in it
Step: 1
Get Instant Access to Expert-Tailored Solutions
See step-by-step solutions with expert insights and AI powered tools for academic success
Step: 2
Step: 3
Ace Your Homework with AI
Get the answers you need in no time with our AI-driven, step-by-step assistance