

Question
I need help with this question especialy the method and the result and discussion . can you verify my graphs to see if what i
I need help with this question especialy the method and the result and discussion . can you verify my graphs to see if what i have done is correct i used the Spearman rank instead of using the Mann) Withney spreasheet. Could you tell me what would be best to use. And if you could look at my discussion i think they link anymore to the graphs if you could have a look
Question
Methods (10 marks)
Tables 1 and 2, below, show an edited data set of some of the components of the 'organizing framework' collected at two sites in Sevilleta. Note that in each of them, 'NA' means that no data are available for that variable in the relevant year. These data are also available in spreadsheet format from the 'Assessment' section of the module website.
| Year | Precipitation/mm | Soil moisture/relative water content | Rabbit densityumber of individualshectare?1 | Coyote densityumber of individualskm?2 |
|---|---|---|---|---|
| 1989 | 106.4 | NA | NA | NA |
| 1990 | 232.4 | NA | NA | NA |
| 1991 | 334.7 | NA | NA | NA |
| 1992 | 240.8 | NA | 0.060 | 0.880 |
| 1993 | 207.4 | NA | 0.272 | 0.702 |
| 1994 | 288.1 | NA | 0.125 | 0.793 |
| 1995 | 138.8 | NA | 0.246 | 0.575 |
| 1996 | 301.9 | 0.112 | 0.104 | 0.598 |
| 1997 | 325.3 | 0.123 | 0.168 | 0.703 |
| 1998 | 225.3 | 0.114 | 0.170 | 0.758 |
| 1999 | 235.7 | 0.094 | 0.138 | 1.065 |
| 2000 | 284.4 | 0.105 | 0.085 | 0.898 |
| 2001 | 214.8 | 0.095 | 0.058 | 0.945 |
| 2002 | 228.7 | 0.096 | 0.072 | 0.738 |
| 2003 | 133.2 | 0.100 | NA | 0.543 |
| 2004 | 301.4 | 0.112 | NA | 0.303 |
| 2005 | 277.4 | 0.110 | NA | NA |
| Year | Precipitation/mm | NPP/gm?2y?1 | Arthropodsumber of individualshectare?1 | Rodentsumber of individualshectare?1 |
|---|---|---|---|---|
| 1989 | NA | NA | NA | 268 |
| 1990 | NA | NA | NA | 122 |
| 1991 | NA | NA | NA | 102 |
| 1992 | NA | NA | 1193 | 439 |
| 1993 | NA | NA | 986 | 376 |
| 1994 | NA | NA | 1061 | 195 |
| 1995 | NA | NA | 772 | 595 |
| 1996 | NA | NA | 756 | 118 |
| 1997 | NA | NA | 1811 | 551 |
| 1998 | NA | NA | 795 | 305 |
| 1999 | 199.9 | 42.86 | 747 | 361 |
| 2000 | 254.1 | 49.66 | 323 | 478 |
| 2001 | 245.8 | 67.21 | 2416 | 148 |
| 2002 | 226.1 | 83.84 | 1451 | 279 |
| 2003 | 140.6 | 27.51 | 2158 | 695 |
| 2004 | 322.6 | 84.13 | 1650 | 255 |
| 2005 | 283.7 | 72.95 | NA | 476 |
| 2006 | 345.8 | 104.46 | NA | 301 |
| 2007 | 253.1 | 153.85 | NA | 997 |
| 2008 | 272.9 | 138.84 | NA | 404 |
| 2009 | 245 | 42.14 | NA | 654 |
| 2010 | 200.9 | 72.70 | NA | 202 |
| 2011 | 152.9 | 34.56 | NA | 239 |
| 2012 | 133.5 | NA | NA | 335 |
| 2013 | 274.1 | NA | NA | 174 |
Use the data in these tables to complete the tasks and questions outlined below.
a.Summarise what variables are present in the data for each site, including the number of replicates and the duration of the studies. (Onesentence for each site)
b.Pick two of the variables in Table1 and compose a hypothesis linking them ('Hypothesis1') that you could investigate using the data in that table. Provide an explanation of the scientific basis for your choice.
c.Looking at the data in Table2, and assuming that the majority of arthropods (such as grasshoppers) in this community eat plant material and that the rodents eat seeds and arthropods, suggest another hypothesis ('Hypothesis2') about how two of these variables might be linked to each other. Provide an explanation of the scientific basis for your choice.
d.Provide an example from either table of a link between variables that may operate with a time lag. Suggest a third hypothesis (Hypothesis 3) that describes this link.
Results (15 marks)
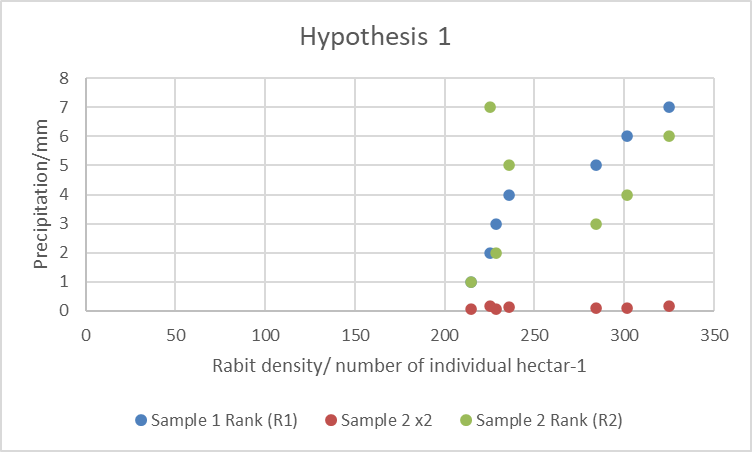
- a.Use a spreadsheet program to draw a graph that is suitable for investigating a correlation between the two variables in your Hypothesis 1. Use an appropriate statistical test to test for a correlation between these variables. Comment on whether your result is statistically significant.
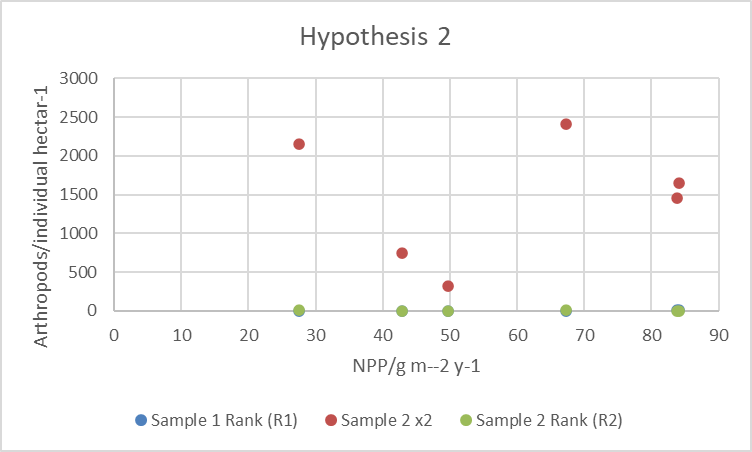
- b.Now use a spreadsheet program to draw a graph that is suitable for investigating a correlation between the two variables in your Hypothesis 2. Use an appropriate statistical test to test for a correlation between these variables. Again, comment on whether your result is statistically significant.
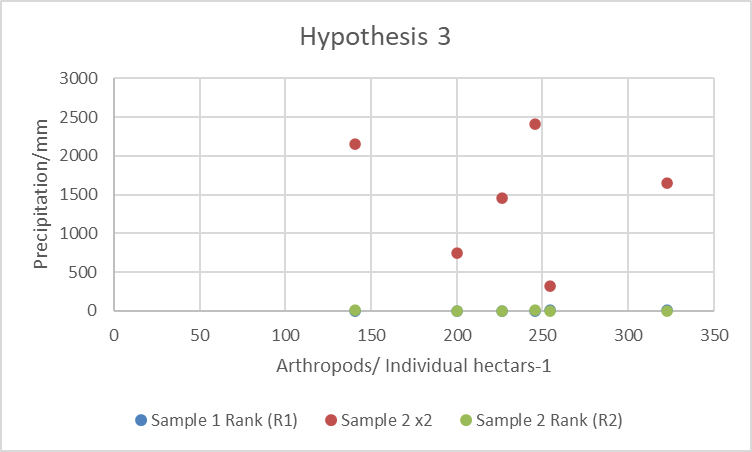
- c.Finally, use your spreadsheet software to draw a graph that is suitable for investigating the correlation between the variables in your Hypothesis 3. Use an appropriate statistical test to test for a correlation between these variables. Again, comment on whether your result is statistically significant.
Paste the results obtained in this section into your emTMA answer.
Discussion (15 marks)
For each of your three hypotheses:
explain whether your data analysis supports your hypothesis and provide a scientific explanation for your result, linking to theoretical concepts and any relevant examples from other research that you have investigated
outline alternative interpretations of the results, including how you might refine your initial hypothesis in light of your results; suggest additional investigations and experiments that would enable you to test your hypothesis further
place your results in context, with reference to other studies or sources of information.
Organise your answer as follows:
Part a) deals with Hypothesis 1
Part b) deals with Hypothesis 2
Part c) deals with Hypothesis 3.
You must include reference to research from outside the module materials in your answer.
My WORK
Method:
- Site 1: The variables are Year, Precipitation (mm), Soil moisture (relative water content), Rabbit density (number of individuals per hectare), and Coyote density (number of individuals per km^2). The study spans from 1989 to 2005, with varying numbers of replicates for each variable due to some data being unavailable in certain years.
Site 2: The variables are Year, Precipitation (mm), NPP (g m^-2 y^-1), Arthropods (number of individuals per hectare), and Rodents (number of individuals per hectare). The study spans from 1989 to 2013, with varying numbers of replicates for each variable due to some data being unavailable in certain years.
b. Hypothesis 1: There is a relationship between precipitation and rabbit density. The scientific basis for this hypothesis is that precipitation can influence the availability of food resources for rabbits, which in turn can affect their population density.
c. Hypothesis 2: There is a relationship between NPP (Net Primary Productivity) and the number of arthropods. The scientific basis for this hypothesis is that NPP represents the amount of energy available in the ecosystem, which can influence the population size of primary consumers like arthropods.
d. An example of a link between variables that may operate with a time lag could be between precipitation and NPP. Changes in precipitation may not immediately affect NPP, as plants may take time to respond to changes in water availability. Hypothesis 3 could be: Changes in precipitation will affect NPP with a time lag of one year.
Results:
Step by Step Solution
There are 3 Steps involved in it
Step: 1

Get Instant Access to Expert-Tailored Solutions
See step-by-step solutions with expert insights and AI powered tools for academic success
Step: 2

Step: 3
Ace Your Homework with AI
Get the answers you need in no time with our AI-driven, step-by-step assistance
Get Started
Calculus Early Transcendentals
Authors: William L. Briggs, Lyle Cochran, Bernard Gillett
2nd edition
321954428, 321954424, 978-0321947345