

Answered step by step
Verified Expert Solution
Question
1 Approved Answer
I need help with this question please Question 17 (1 point) ASLR1 ASLR2 AS2 AS, Price Level P. AD2 AD, 0 Q 1 Q2 Real
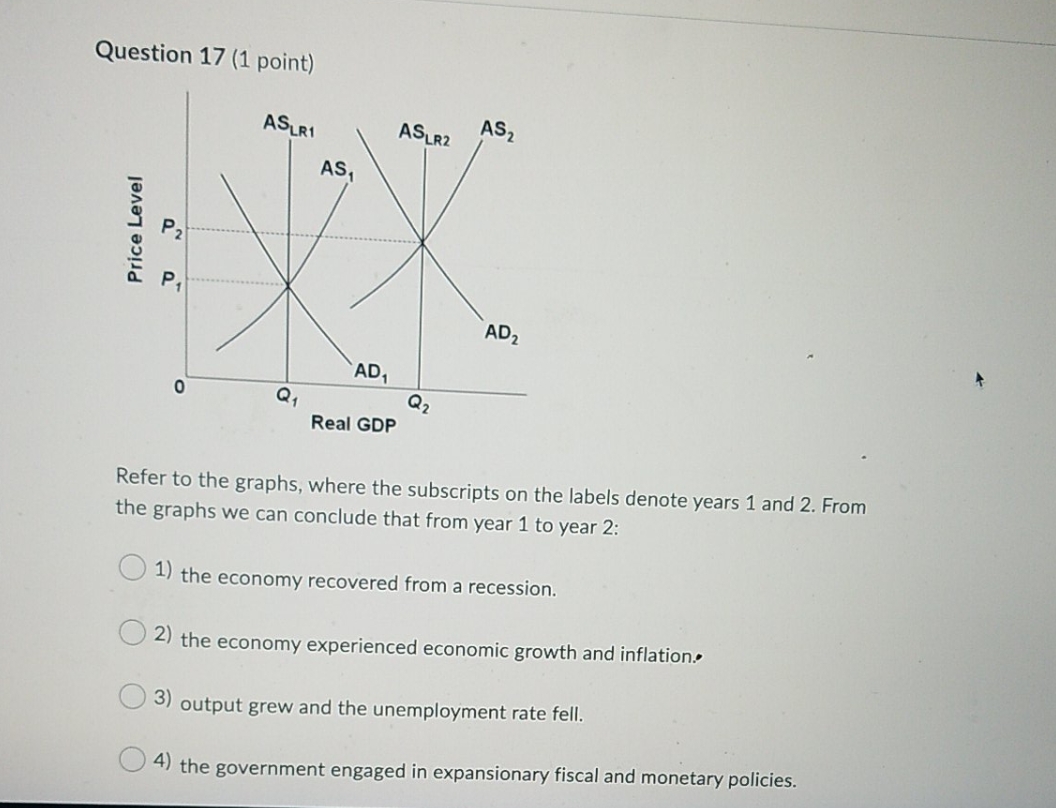
I need help with this question please

Step by Step Solution
There are 3 Steps involved in it
Step: 1

Get Instant Access to Expert-Tailored Solutions
See step-by-step solutions with expert insights and AI powered tools for academic success
Step: 2

Step: 3
Ace Your Homework with AI
Get the answers you need in no time with our AI-driven, step-by-step assistance
Get Started
Macroeconomics Policy And Practice
Authors: Frederic Mishkin
2nd Edition
0133424316, 978-0133424317