

Question
I need help with this two questions please I have the 2 histogram just need help answer the 2 questions please. Prompt In your initial
I need help with this two questions please I have the 2 histogram just need help answer the 2 questions please.
Prompt
In your initial discussion post, respond to each of the following after you download the drinking.xlsx file provided in the Data section below.
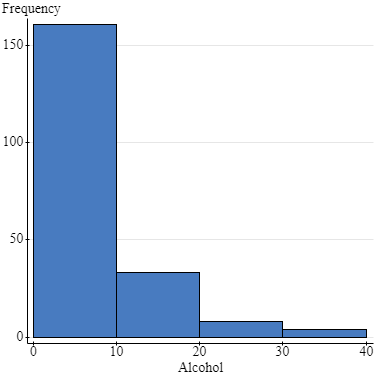
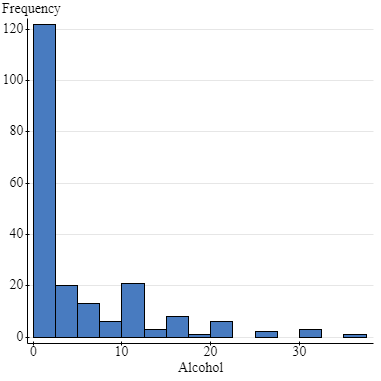
- Describe the distribution of weekly alcohol consumption using concepts from Unit 2.
- Make an appropriate graph and provide appropriate numerical summaries. To recall how to create these items, see the StatCrunch directions provided below.
- Describe the shape, center and spread using numerical measures that best describe the distribution.
- In your description, include an interval of typical values and a discussion of variability.
- Embed your StatCrunch graph in your initial post. To recall how to embed StatCrunch output, see the directions provided below.
- Do the data suggest that drinking is a problem in this university?
- Use the data to support your answer.
Step by Step Solution
There are 3 Steps involved in it
Step: 1

Get Instant Access to Expert-Tailored Solutions
See step-by-step solutions with expert insights and AI powered tools for academic success
Step: 2

Step: 3
Ace Your Homework with AI
Get the answers you need in no time with our AI-driven, step-by-step assistance
Get Started
People Centric Skills Interpersonal And Communication Skills For Auditors And Business Professionals
Authors: Goldberg
1st Edition
1118850815, 978-1118850817