Answered step by step
Verified Expert Solution
Question
1 Approved Answer
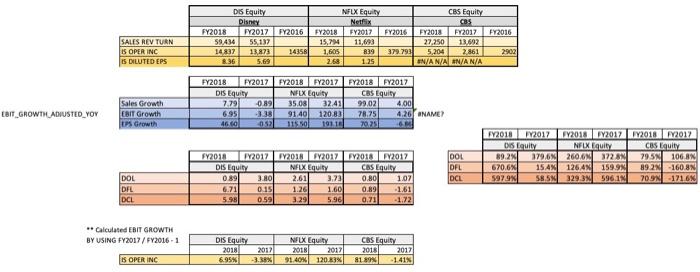
I need help worh Number 4! I have attacehd all my work for questions 1-3. I have also done the bloomberg terminal and have the
I need help worh Number 4! I have attacehd all my work for questions 1-3. I have also done the bloomberg terminal and have the values for #4; What i need help with is explaining what mh finds are and what they mean. I am really confused on the percentages i got using bloomberg. Please help me by explaining tbe findings. (the last screenshot goes with #4)
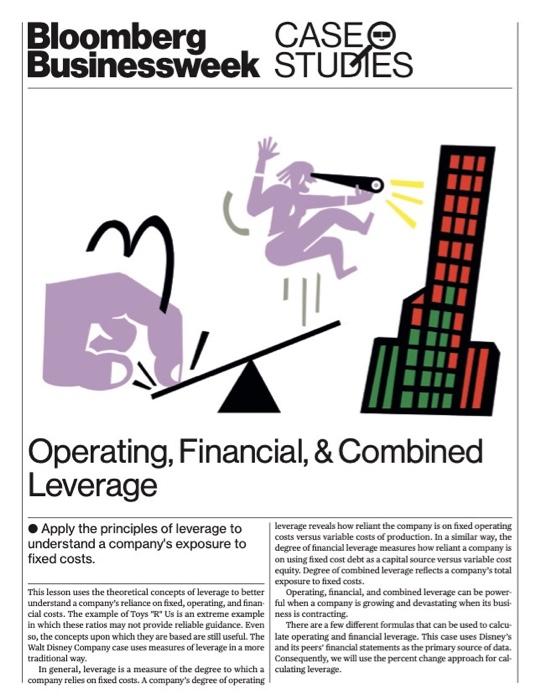
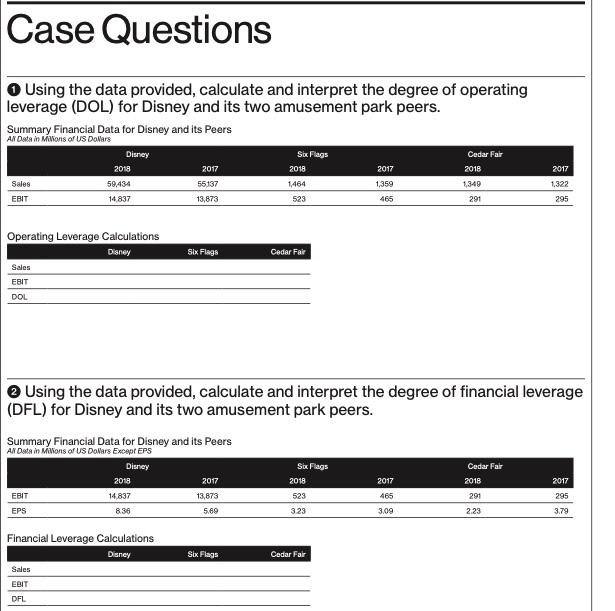
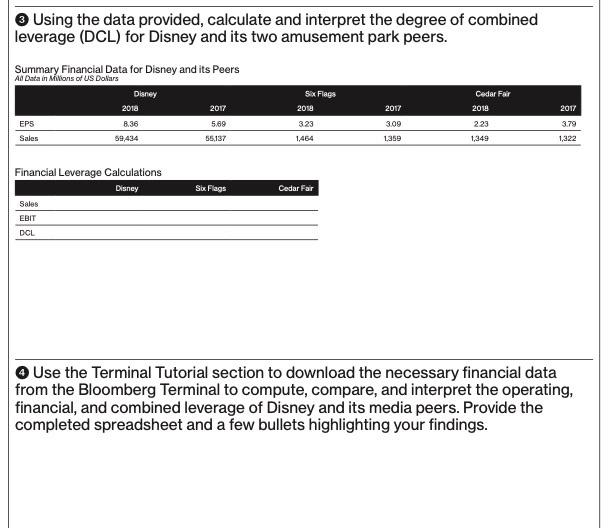
Bloomberg CASEO Businessweek STUDIES // Sa Operating, Financial, & Combined Leverage Apply the principles of leverage to leverage reveals how reliant the company is on fixed operating costs versus variable costs of production. In a similar way, the understand a company's exposure to degree of financial leverage measures how reliant a company is fixed costs. on using fixed cost debt as a capital source versus variable cost equity Degree of combined leverage reflects a company's total exposure to fixed costs. This lesson uses the theoretical concepts of leverage to better Operating, financial and combined leverage can be power understand a company's reliance on fixed, operating, and finan ful when a company is growing and devastating when its busi cial costs. The example of Toys 'R' Us is an extreme example mess is contracting in which these ratios may not provide reliable guidance. Even There are a few different formulas that can be used to calcu so, the concepts upon which they are based are still useful. The late operating and financial leverage. This case uses Disney's Walt Disney Company case uses measures of leverage in a more and its peers' financial statements as the primary source of data. traditional way. Consequently, we will use the percent change approach for cal In general, leverage is a measure of the degree to which a culating leverage. company relies on fixed costs. A company's degree of operating Case Questions Using the data provided, calculate and interpret the degree of operating leverage (DOL) for Disney and its two amusement park peers. Summary Financial Data for Disney and its Peers All Data in Millions of US Dollars Disney 2018 Sales 59.434 EBIT 14.837 2017 55137 13,873 Six Flags 2018 1,464 523 2017 1,359 Cedar Fair 2018 1,349 2017 1322 295 465 291 Six Flags Cadar Fair Operating Leverage Calculations Disney Sales EBIT DOL Using the data provided, calculate and interpret the degree of financial leverage (DFL) for Disney and its two amusement park peers. Cedar Fair Summary Financial Data for Disney and its Peers All Data in Millions of US Dollars Except EPS Disney 2018 2017 EBIT 14837 13,873 EPS 8.36 5.69 Six Flags 2018 2017 2018 2017 465 291 295 523 3.23 3.09 2.23 3.79 Six Flags Cedar Far Financial Leverage Calculations Disney Sales EBIT DFL 2017 EPS Sales EBIT Disney 2018 8.36 59,434.00 14837.00 5.69 55,137.00 13873.00 Six Flags 2018 3.23 1,464 523.00 2017 3.09 1,359 465.00 Cedar Fair 2018 2.23 1,349 291.00 2017 3.79 1,322 295.00 Sales EBIT EPS DCL Disney 7.79% 6.95% 46.92% 6.02% Six Flags 7.73% 12.47% 4.53% 0.59% Cedar Fair 2.04% -1.36% 41.16% -20.15% Disney 2018 14837.00 8.36 Six Flags 2018 523.00 3.23 2017 13873.00 5.69 EBIT EPS Cedar Fair 2018 291.00 2.23 2017 465.00 3.09 2017 295.00 3.79 Disney Cedar Fair Sales EBIT DFL Six Flags 46.92% 6.95% 6.75% 4.53% 12.47% 0.36% 41.16% -1.36% 30.36% Using the data provided, calculate and interpret the degree of combined leverage (DCL) for Disney and its two amusement park peers. Summary Financial Data for Disney and its Peers Al Data in Millions of US Dollars Disney 2018 EPS 8.36 Sales 59,434 Six Flags 2018 Cedar Fair 2018 2017 2017 2017 5.69 55,137 323 309 223 3.79 1,464 1,350 1,349 1,322 Six Flags Cedar Far Financial Leverage Calculations Disney Sales EBIT DCL Use the Terminal Tutorial section to download the necessary financial data from the Bloomberg Terminal to compute, compare, and interpret the operating, financial, and combined leverage of Disney and its media peers. Provide the completed spreadsheet and a few bullets highlighting your findings. Disney 2018 59,434.00 $ 14,837 Six Flags 2018 1,464.00 $ 523 2017 55,137.00 $ 13,873 $ Cedar Fair 2018 2017 1,349.00 $ 1,322.00 295 Sales EBIT 2017 1,359.00 $ 465 291 Disney Cedar Fair Sales EBIT DOL Six Flars 7.79% 7.73% 6.95% 12.47% 89.16% 161.44% 2.04% -1.36% -66.39% Dis Equity Disney FY2018 FY2017 59.434 55,137 14837 13,873 8.36 5.69 FY2016 FY2016 NFLX Equity CBS Equity Netfix CBS FY2018 FY2017 FY2016 FY2018 FY2017 15,7 11,693 27,250 13,692 1,605 839 379.793 5,204 2.861 2.68 1.25 EN/ANA N/A N/A SALES REV TURN IS OPER INC IS DILUTED EPS 14358 29021 FY2018 FY2017 Dis Equity 0.89 695 7.79 Sales Growth EBIT Growth LPS Growth FY2018FY2017 FY2018 FY2017 NFUX Equity CBS Equity 35.08 32.41 99.02 4.00 91.40 120.83 78.25 4.26 NAME? 115 191.18 EBIT GROWTH ADJUSTED YOY FY2018 FY2012 FY2018 2017 2013 FY2017 Dis Equity NFUXEQUIBY CBS Equity 0891 3.80 2.61 3.73 0.80 1.07 6.71 0.15 1.26 1.60 0.89 -1.61 0.59 3.29 5.96 071 -1.72 DOL DFL IDCL FY2018 2017 FY2013 12017 2018 2017 05 Louity NFLX Equity Cos Equity 89.21 179,6% 260/6N 372.8 79.SN 106.8% 670,6% 15 AX 126AN 1599N 89 2N - 160.8N 597.9 58.5M 329,3 596.1% 709 -171.6% DOL DEL DCL ** Calculated EBIT GROWTH BY USING FY2017 / FY2016-1 DIS Equity 2018 2012 6.95% -3.38% NIX Equity 2018 2017 91.40% 120.83 CBS Equity 2018 2017 81 89 -1.41% IS OPER INC Bloomberg CASEO Businessweek STUDIES // Sa Operating, Financial, & Combined Leverage Apply the principles of leverage to leverage reveals how reliant the company is on fixed operating costs versus variable costs of production. In a similar way, the understand a company's exposure to degree of financial leverage measures how reliant a company is fixed costs. on using fixed cost debt as a capital source versus variable cost equity Degree of combined leverage reflects a company's total exposure to fixed costs. This lesson uses the theoretical concepts of leverage to better Operating, financial and combined leverage can be power understand a company's reliance on fixed, operating, and finan ful when a company is growing and devastating when its busi cial costs. The example of Toys 'R' Us is an extreme example mess is contracting in which these ratios may not provide reliable guidance. Even There are a few different formulas that can be used to calcu so, the concepts upon which they are based are still useful. The late operating and financial leverage. This case uses Disney's Walt Disney Company case uses measures of leverage in a more and its peers' financial statements as the primary source of data. traditional way. Consequently, we will use the percent change approach for cal In general, leverage is a measure of the degree to which a culating leverage. company relies on fixed costs. A company's degree of operating Case Questions Using the data provided, calculate and interpret the degree of operating leverage (DOL) for Disney and its two amusement park peers. Summary Financial Data for Disney and its Peers All Data in Millions of US Dollars Disney 2018 Sales 59.434 EBIT 14.837 2017 55137 13,873 Six Flags 2018 1,464 523 2017 1,359 Cedar Fair 2018 1,349 2017 1322 295 465 291 Six Flags Cadar Fair Operating Leverage Calculations Disney Sales EBIT DOL Using the data provided, calculate and interpret the degree of financial leverage (DFL) for Disney and its two amusement park peers. Cedar Fair Summary Financial Data for Disney and its Peers All Data in Millions of US Dollars Except EPS Disney 2018 2017 EBIT 14837 13,873 EPS 8.36 5.69 Six Flags 2018 2017 2018 2017 465 291 295 523 3.23 3.09 2.23 3.79 Six Flags Cedar Far Financial Leverage Calculations Disney Sales EBIT DFL 2017 EPS Sales EBIT Disney 2018 8.36 59,434.00 14837.00 5.69 55,137.00 13873.00 Six Flags 2018 3.23 1,464 523.00 2017 3.09 1,359 465.00 Cedar Fair 2018 2.23 1,349 291.00 2017 3.79 1,322 295.00 Sales EBIT EPS DCL Disney 7.79% 6.95% 46.92% 6.02% Six Flags 7.73% 12.47% 4.53% 0.59% Cedar Fair 2.04% -1.36% 41.16% -20.15% Disney 2018 14837.00 8.36 Six Flags 2018 523.00 3.23 2017 13873.00 5.69 EBIT EPS Cedar Fair 2018 291.00 2.23 2017 465.00 3.09 2017 295.00 3.79 Disney Cedar Fair Sales EBIT DFL Six Flags 46.92% 6.95% 6.75% 4.53% 12.47% 0.36% 41.16% -1.36% 30.36% Using the data provided, calculate and interpret the degree of combined leverage (DCL) for Disney and its two amusement park peers. Summary Financial Data for Disney and its Peers Al Data in Millions of US Dollars Disney 2018 EPS 8.36 Sales 59,434 Six Flags 2018 Cedar Fair 2018 2017 2017 2017 5.69 55,137 323 309 223 3.79 1,464 1,350 1,349 1,322 Six Flags Cedar Far Financial Leverage Calculations Disney Sales EBIT DCL Use the Terminal Tutorial section to download the necessary financial data from the Bloomberg Terminal to compute, compare, and interpret the operating, financial, and combined leverage of Disney and its media peers. Provide the completed spreadsheet and a few bullets highlighting your findings. Disney 2018 59,434.00 $ 14,837 Six Flags 2018 1,464.00 $ 523 2017 55,137.00 $ 13,873 $ Cedar Fair 2018 2017 1,349.00 $ 1,322.00 295 Sales EBIT 2017 1,359.00 $ 465 291 Disney Cedar Fair Sales EBIT DOL Six Flars 7.79% 7.73% 6.95% 12.47% 89.16% 161.44% 2.04% -1.36% -66.39% Dis Equity Disney FY2018 FY2017 59.434 55,137 14837 13,873 8.36 5.69 FY2016 FY2016 NFLX Equity CBS Equity Netfix CBS FY2018 FY2017 FY2016 FY2018 FY2017 15,7 11,693 27,250 13,692 1,605 839 379.793 5,204 2.861 2.68 1.25 EN/ANA N/A N/A SALES REV TURN IS OPER INC IS DILUTED EPS 14358 29021 FY2018 FY2017 Dis Equity 0.89 695 7.79 Sales Growth EBIT Growth LPS Growth FY2018FY2017 FY2018 FY2017 NFUX Equity CBS Equity 35.08 32.41 99.02 4.00 91.40 120.83 78.25 4.26 NAME? 115 191.18 EBIT GROWTH ADJUSTED YOY FY2018 FY2012 FY2018 2017 2013 FY2017 Dis Equity NFUXEQUIBY CBS Equity 0891 3.80 2.61 3.73 0.80 1.07 6.71 0.15 1.26 1.60 0.89 -1.61 0.59 3.29 5.96 071 -1.72 DOL DFL IDCL FY2018 2017 FY2013 12017 2018 2017 05 Louity NFLX Equity Cos Equity 89.21 179,6% 260/6N 372.8 79.SN 106.8% 670,6% 15 AX 126AN 1599N 89 2N - 160.8N 597.9 58.5M 329,3 596.1% 709 -171.6% DOL DEL DCL ** Calculated EBIT GROWTH BY USING FY2017 / FY2016-1 DIS Equity 2018 2012 6.95% -3.38% NIX Equity 2018 2017 91.40% 120.83 CBS Equity 2018 2017 81 89 -1.41% IS OPER INC Again, I need help with 1 question which is ninber 4 


Step by Step Solution
There are 3 Steps involved in it
Step: 1

Get Instant Access to Expert-Tailored Solutions
See step-by-step solutions with expert insights and AI powered tools for academic success
Step: 2

Step: 3

Ace Your Homework with AI
Get the answers you need in no time with our AI-driven, step-by-step assistance
Get Started


