i need help writing the reccomended final value for Teuer Furniture using the market multiples approach. This is probably more information that you need, you do not need to compare to all the other similar companies but just a few would be helpful. Thank you!
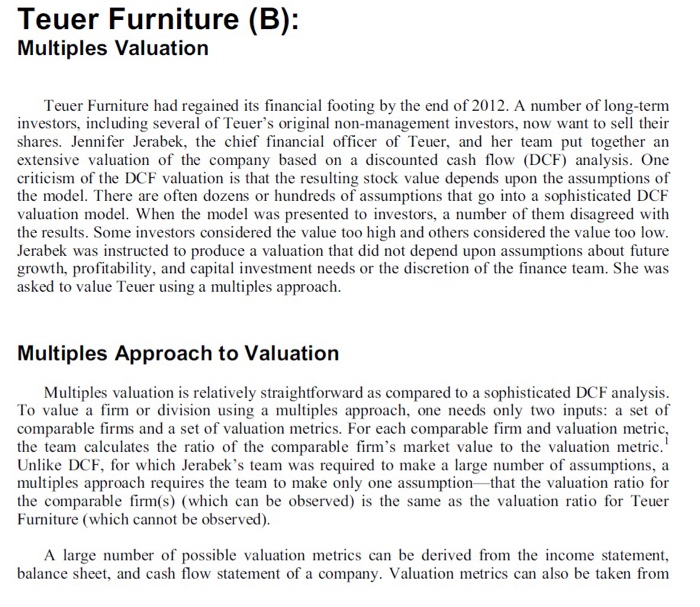
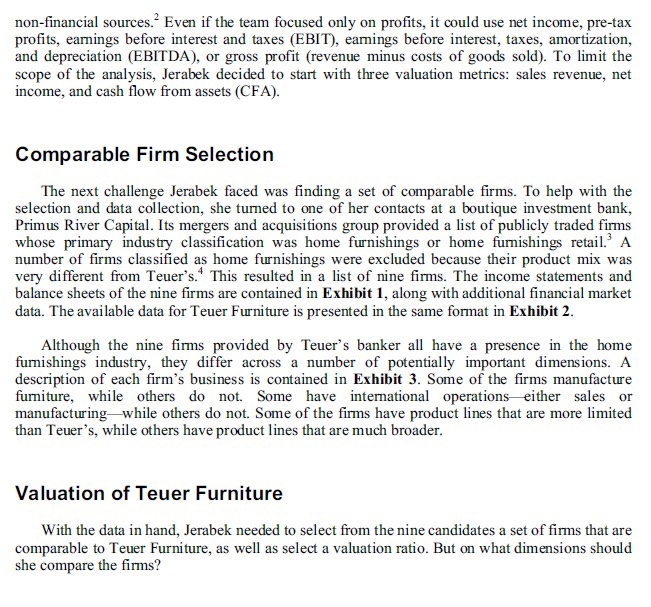
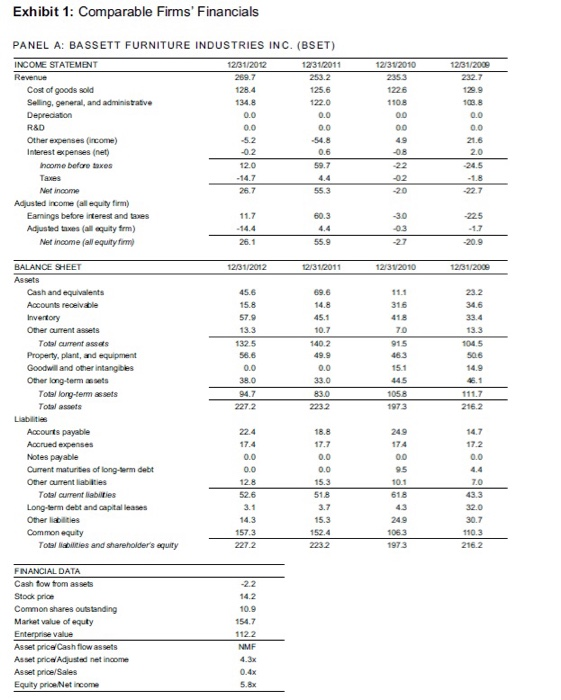
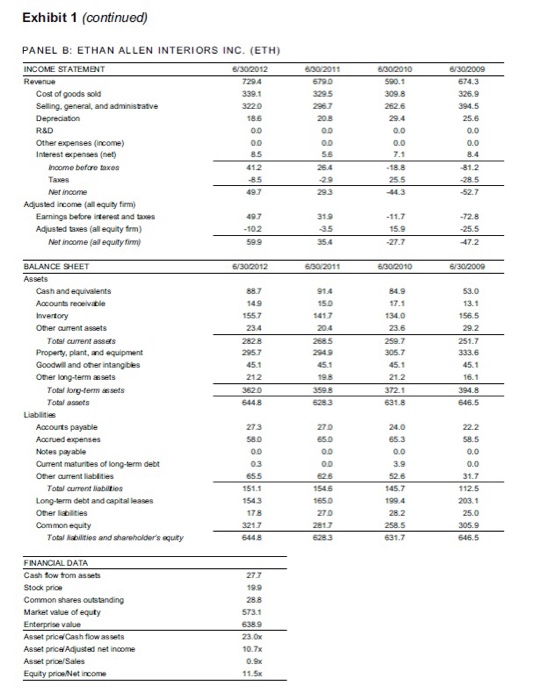
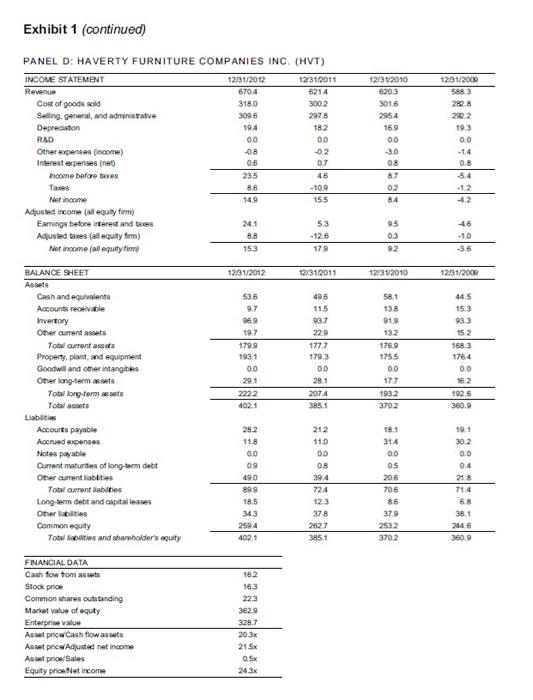
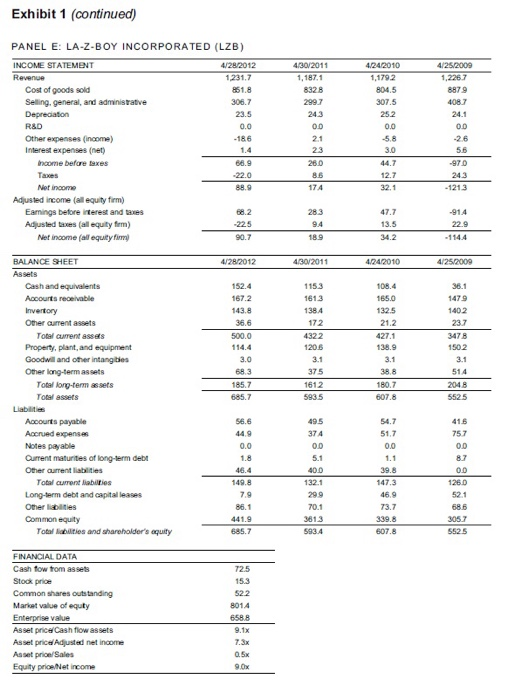
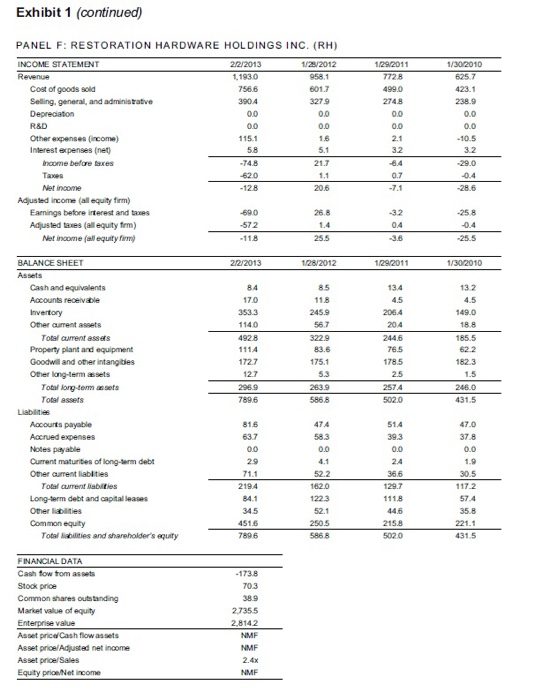
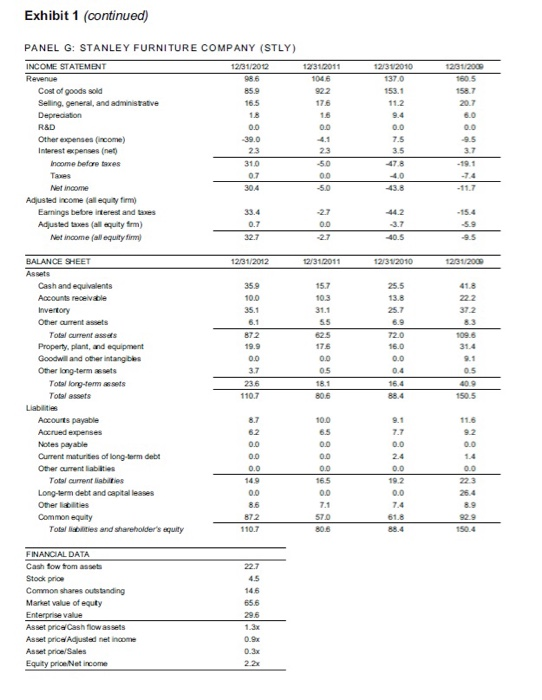
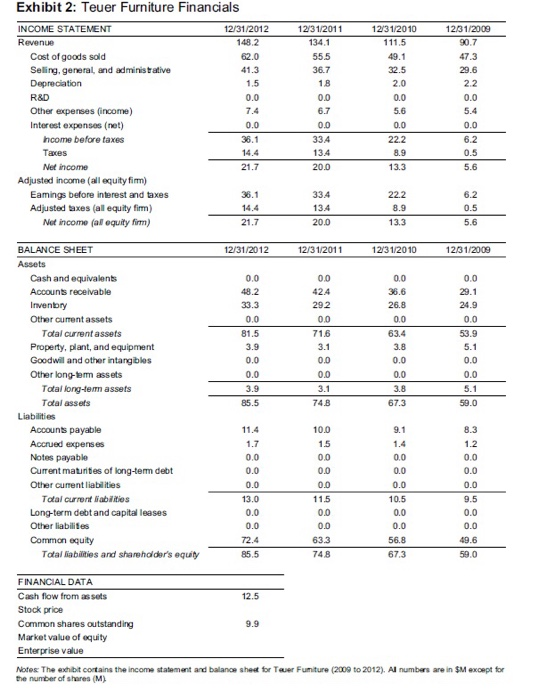
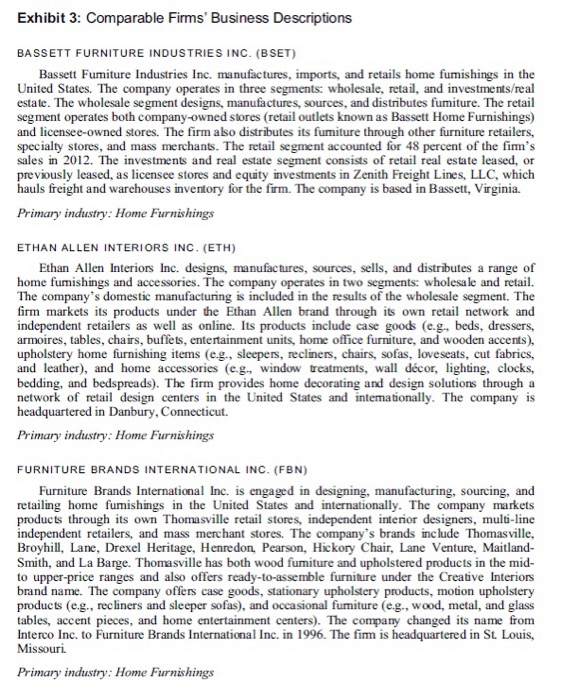
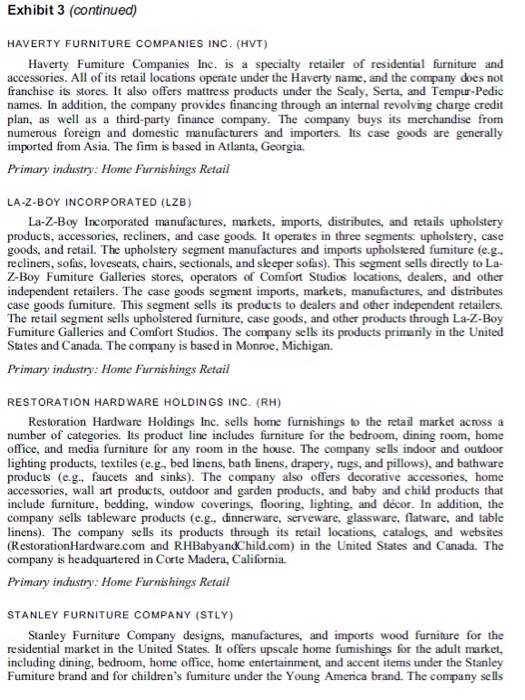
Teuer Furniture (B): Multiples Valuation Teuer Furniture had regained its financial footing by the end of 2012. A number of long-term investors, including several of Teuer's original non-management investors, now want to sell their shares. Jennifer Jerabek, the chief financial officer of Teuer, and her team put together an extensive valuation of the company based on a discounted cash flow (DCF) analysis. One criticism of the DCF valuation is that the resulting stock value depends upon the assumptions of the model. There are often dozens or hundreds of assumptions that go into a sophisticated DCF valuation model. When the model was presented to investors, a number of them disagreed with the results. Some investors considered the value too high and others considered the value too low. Jerabek was instructed to produce a valuation that did not depend upon assumptions about future growth, profitability, and capital investment needs or the discretion of the finance team. She was asked to value Teuer using a multiples approach. Multiples Approach to Valuation Multiples valuation is relatively straightforward as compared to a sophisticated DCF analysis. To value a firm or division using a multiples approach, one needs only two inputs: a set of comparable firms and a set of valuation metrics. For each comparable firm and valuation metric, the team calculates the ratio of the comparable firm's market value to the valuation metric.' Unlike DCF, for which Jerabek's team was required to make a large number of assumptions, a multiples approach requires the team to make only one assumption--that the valuation ratio for the comparable firm(s) (which can be observed) is the same as the valuation ratio for Teuer Furniture (which cannot be observed). A large number of possible valuation metrics can be derived from the income statement, balance sheet, and cash flow statement of a company. Valuation metrics can also be taken from non-financial sources. Even if the team focused only on profits, it could use net income, pre-tax profits, earnings before interest and taxes (EBIT), earnings before interest, taxes, amortization, and depreciation (EBITDA), or gross profit (revenue minus costs of goods sold). To limit the scope of the analysis, Jerabek decided to start with three valuation metrics: sales revenue, net income, and cash flow from assets (CFA). Comparable Firm Selection The next challenge Jerabek faced was finding a set of comparable firms. To help with the selection and data collection, she tumed to one of her contacts at a boutique investment bank, Primus River Capital. Its mergers and acquisitions group provided a list of publicly traded firms whose primary industry classification was home furnishings or home furishings retail. A number of firms classified as home furnishings were excluded because their product mix was very different from Teuer's. This resulted in a list of nine firms. The income statements and balance sheets of the nine firms are contained in Exhibit 1, along with additional financial market data. The available data for Teuer Furniture is presented in the same format in Exhibit 2. Although the nine firms provided by Teuer's banker all have a presence in the home furnishings industry, they differ across a number of potentially important dimensions. A description of each firm's business is contained in Exhibit 3. Some of the firms manufacture furniture, while others do not. Some have interational operations either sales or manufacturing while others do not. Some of the firms have product lines that are more limited than Teuer's, while others have product lines that are much broader. Valuation of Teuer Furniture With the data in hand, Jerabek needed to select from the nine candidates a set of firms that are comparable to Teuer Furniture, as well as select a valuation ratio. But on what dimensions should she compare the firms? Exhibit 1: Comparable Firms' Financials PANEL A: BASSETT FURNITURE INDUSTRIES INC. (BSET) INCOME STATEMENT 12/31/2012 12/31/2011 Revenue 269.7 253.2 Cost of goods sold 128.4 125.6 Seling, general, and administrative 134.8 122.0 Depreciation 0.0 0.0 R&D 0.0 00 Other expenses (income) -5.2 -54.8 Interest expenses (net) -0.2 Income before taxes 120 59.7 Taxes -14.7 Net income 26.7 55.3 Adjusted income (all equity firm) Earnings before interest and taxes 11.7 60.3 Adjusted taxes (all equity frm) 4.4 Net Income (all equity firmy 26.1 55.9 12/3V2010 2353 1226 1108 00 00 12/31/2009 232.7 12.9 103.8 0.0 00 21.6 2.0 -24.5 -1.8 -22.7 0.6 -0.B -22 -02 -20 -3.0 03 -22.5 -1.7 -20.9 12/31/2012 12/31/2011 12/3V2010 12/31/2009 BALANCE SHEET Assets Cash and equivalents Accounts receivable Invertory Other current assets Total current assets Property, plant, and equipment Goodwill and other intangibles Other long-term assets Total long-term sets Total assets Liabilities Accounts payable Accrued expenses Notes payable Current maturities of long-term debt Other current liabilities Total current liabilties Long-term debt and capital leases Other lates Common equity Totables and shareholder's quity 45.6 15.8 57.9 13.3 132.5 58.6 0.0 38.0 94.7 227.2 69.6 14.8 45.1 10.7 140.2 49.9 0.0 33.0 83.0 2232 11.1 316 418 70 915 463 15.1 445 105.8 23.2 34.6 33.4 13.3 1045 50.6 14.9 46.1 111.7 216.2 1973 14.7 17.2 0.0 22.4 17.4 0.0 0.0 12.8 52.6 3.1 14.3 1573 18.8 17.7 0.0 0.0 15.3 518 3.7 15.3 152.4 223.2 249 174 0.0 95 10.1 618 7.0 43.3 32.0 30.7 110.3 216.2 249 1063 2272 1973 FINANCIAL DATA Cash fow from assets Stock price Common shares outstanding Market value of equity Enterprise value Asset price Cash flow assets Asset price Adjusted net income Asset price/Sales Equity prionNet income -2.2 14.2 10.9 154.7 112.2 NMF 0.4x 5.8x Exhibit 1 (continued) 6/30/2011 6790 3295 PANEL B: ETHAN ALLEN INTERIORS INC. (ETH) INCOME STATEMENT 6/30/2012 Revenue 7294 Cost of goods sold 339.1 Selling general, and administrative 3220 Depreciation 186 R&D 00 Other expenses (income) 0.0 Interest expenses (net) 8.5 Income before taxes 412 85 Net income 497 Adjusted income (all equity firm) Earnings before interest and are 49.7 Adjusted taxes (all equity firm) -102 Net income (all equity fimm 599 205 OD OD 55 26.4 6/30/2010 590.1 309.8 2626 29.4 0.0 0.0 7.1 -18.8 25.5 6/30/2009 674.3 3269 394.5 25.6 0.0 0.0 8.4 81.2 -28.5 -52.7 319 35 35.4 15.9 -27.7 -72.8 -25.5 472 6/30/2012 6/30/2011 5/30/2010 6/30/2009 BALANCE SHEET Assets Cash and equivalents Accounts receive Invertory Other current assets Total current assets Property, plant, and equipment Goodwill and other intangibles Other long-term assets Total long-term assets Total assets Liabilities Accounts payable Accrued expenses Notes payable Current maturities of long-term debt Other current liabilities Total current liabilities Long-term debt and capital leases Other lilities Common equity Total Habilities and shareholder's quity 887 149 1557 234 2828 2957 45.1 212 3620 5448 91.4 150 1417 20.4 2685 2049 45.1 198 3598 84.9 17.1 134.0 23.6 259.7 305.7 45.1 212 372.1 531.8 53.0 13.1 156.5 29.2 251.7 333.6 45.1 16.1 394.8 646.5 270 650 OD OD 24.0 65.3 0.0 3.9 273 580 0.0 03 655 151.1 1543 178 3217 6448 22.2 58.5 0.0 0.0 31.7 112.5 2031 25.0 305.9 646.5 526 145.7 199.4 1545 1650 270 282 2585 6283 631.7 FINANCIAL DATA Cash fow from assets Stock price Common shares outstanding Market value of equly Enterprise value Asset price/Cash flow assets Asset price Adjusted net income Asset price/Sales Equity priceNet income 277 19.9 28.8 573.1 638.9 23.0x 10.7x 0.9 Exhibit 1 (continued) PANEL C: FURNITURE BRANDS INTERNATIONAL INC. (FBN) INCOME STATEMENT 12/29/2012 12/31/2011 Revenue 1,072.3 1.107.7 Cost of goods sold 827.3 837.1 Selling, general, and administrative 2528 270.9 Depreciation 18.9 21.9 R&D 0.0 0.0 Other expenses (income) 16.6 20.8 Interest expenses (net) 5.7 3.6 Income before taxes 49.0 46.6 Taxes -1.8 -2.8 Net Income 47.3 43.8 Adjusted income (all equity firm) Earnings before interest and tres -43.0 Adjusted taxes (all equity firm) -1.6 -2.6 Net Income (al equity in 41.8 -40.4 12/312010 1,1599 879.2 2852 23.9 0.0 16.5 3.2 12/31/2000 1.224.4 986.2 3228 20.7 0.0 65.8 5.3 - 176.5 -67.8 -108.7 -39.0 448 -8.3 -36.4 -171.1 -65.7 -105.4 12/29/2012 12/31/2011 12/312010 12/31/2009 11.9 125.7 244.3 11.3 393.2 103.4 76.1 45.7 225.2 618.4 25.4 1080 2282 9.5 371.0 115.8 77.5 50.2 243.5 614.5 520 114.5 249.7 11.2 427.4 1249 86.5 376 249.0 676.4 83.9 184.5 226.1 9.3 503.7 134.4 87.6 254.4 758.1 BALANCE SHEET Assets Cash and equivalents Accounts receivable Invertory Other current Total current ass Property, plant, and equipment Goodwill and other intangibles Oher long-term assets Total long-term assets Totales Liabilities Accounts payable Accrued expenses Notes payable Current maturites of long-term debt Other current liabilities Total current liabilities Long-term debt and capital leases Other pilties Common equity Total abilities and shareholder's equity FINANCIAL DATA Cash fow from assets Stock prio Common shares outstanding Market value of equly Enterprise value Asset price Cash flow assets Asset price Adjusted net income Asset price/Sales Equity price.Net income 113.6 58.7 0.0 0.0 0.0 172.3 105.0 286.3 54.8 618.4 85.6 53.6 0.0 0.0 0.0 1392 77.0 266.1 132.3 6145 79.9 61.2 0.0 0.0 00 141.1 77.0 198.8 2906 676.4 83.8 75.9 0.0 17.0 0.0 176.8 78.0 240.6 262.8 758.1 -5.8 74 8.0 59.7 152.8 NMF NMF 0.1% NMF Exhibit 1 (continued) 12/31/2009 588.3 PANEL D: HAVERTY FURNITURE COMPANIES INC. (HVT) INCOME STATEMENT 12/31/2012 12/31/2011 Revenue 6704 6214 Cost of goods sold 3180 3002 Seling, general, and administrative 3096 2978 Depreciation 194 182 R&D 0.0 00 Other expenses (income) -08 -0.2 Interest expenses (net) 0.6 07 Income before taxes 235 45 Taes -10.9 Net income 155 Adjusted income (all equity firm) Earnings before interest and taxes 5.3 Adjusted taxes (all equity firm) 8.8 -12.6 Net Income (all equity fim 153 179 12/312010 6203 3016 2954 16.9 0.0 30 0.8 8.7 02 84 29.2 19.3 0.0 0.8 -5.4 86 149 42 46 9.5 0.3 -10 -3.6 12/31/2012 12/31/2011 12/312010 12/31/2009 53.6 9.7 96.9 19.7 179.9 193.1 0.0 29.1 2222 402.1 49.6 115 937 229 1777 179.3 00 28.1 58.1 13.8 91.9 13.2 176.9 175.5 0.0 17.7 44.5 15.3 93.3 15.2 168.3 1764 2074 BALANCE SHEET Assets Cash and equivalents Accounts receivable Inventory Other current assets Total current assets Property, plant, and equipment Goodwill and other intangibles Other long-term assets Total long-term assets Total assets Liabilities Accounts payable Accrued expenses Notes payable Current maturities of long-term debt Other current liabilities Total current liabilities Long-term debt and capital leases Other listes Common equity Total liabilities and shareholder's quity 1932 16.2 192.6 360. 385.1 3702 19.1 30.2 0.0 11.8 0.0 0.9 49.0 89.9 18.5 343 2594 402.1 212 110 OD 0.8 394 724 123 378 2627 385.1 314 0.0 0.5 206 706 8.6 379 2532 3702 218 71.4 6.8 38.1 214,6 360.9 FINANCIAL DATA Cash fow from assets Stock price Common shares outstanding Market value of equly Enterprise value Asset pricel Cash flow assets Asset price Adjusted net income Asset prica/Sales Equity priceNet income 16.2 16.3 22.3 3629 328.7 20.3x 21.5% 0.5x 24.3x Exhibit 1 (continued) PANEL E: LA-Z-BOY INCORPORATED (LZB) INCOME STATEMENT 4/28/2012 Revenue 1.231.7 Cost of goods sold 851.8 Selling, general, and administrative 306.7 Depreciation 23.5 R&D 0.0 Other expenses (income) -186 Interest expenses (net) Income before taxes 68.9 Taxes -22.0 Not income 88.9 Adjusted income (all equity firm) Earnings before interest and taxes 68.2 Adjusted taxes (all equity firm) -225 Net income (all equity 90.7 4/30/2011 1,187.1 8328 2997 24.3 00 21 23 260 8.6 174 4.24 2010 1,1792 804.5 307.5 252 0.0 5.8 3.0 44.7 12.7 32.1 4/25/2009 1,2267 8879 408.7 24.1 OD -26 5.6 -970 24.3 - 1213 283 9.4 18.9 47.7 13.5 34.2 -914 22.9 -114.4 4/28/2012 4/30/2011 424/2010 4/25/2009 BALANCE SHEET Assets Cash and equivalents Accounts receivable Invertory Other current assets Total current assets Property, plant, and equipment Goodwill and other intangibles Other long-term assets Total long-term assets Total assets Liabiti Accounts payable Accrued expenses Notes payable Current maturites of long-term debt Other current liabilities Total current liabilis Long-term debt and opital leases Other liabilities Common equity Total liabilitles and shareholder's aquity 152.4 167.2 143.8 36.6 500.0 114.4 3.0 68.3 185.7 685.7 1153 1613 1384 172 4322 120.6 3.1 375 1612 5935 108.4 165.0 132.5 21.2 427.1 138.9 3.1 38.8 180.7 607.8 36.1 1479 1402 237 3478 150.2 3.1 514 2048 5525 56.6 44.9 0.0 1.8 46.4 149.8 7.9 86.1 441.9 685.7 49.5 374 OD 5.1 400 132.1 299 70.1 3813 593.4 54.7 51.7 0.0 1.1 39.8 147.3 46.9 73.7 339.8 607.8 41.6 757 OD 8.7 0.0 1260 52.1 68.6 305.7 5525 FINANCIAL DATA Cash fow from assets Stock price Common shares outstanding Market value of equity Enterprise value Asset price Cash flow assets Asset price Adjusted net income Asset prio/Sales Equity priceNet income 72.5 15.3 522 8014 658.8 9.1x 7. 3x 0.5% 9.Ox 12/31/2011 1046 922 17.6 12/312010 1370 153.1 11.2 Exhibit 1 (continued) PANEL G: STANLEY FURNITURE COMPANY (STLY) INCOME STATEMENT 12/31/2012 Revenue 986 Cost of goods sold 85.9 Selling general, and administrative 16.5 Depreciation R&D 0.0 Other expenses (income) -39.0 Interest expenses (net) 23 Income before taxes 310 Tas 0.7 Net income 304 Adjusted income (all equity firm) Earnings before interest and the Adjusted to all equity firm) 0.7 Net income (all equity 32.7 0.0 7.5 3.5 0.0 4.1 23 -50 00 -5.0 1231/2009 160.5 158.7 20.7 6.0 0.0 -9.5 3.7 - 19.1 -74 - 11.7 40 -2.7 0.0 -2.7 3.7 40.5 -9.5 12/31/2012 12/31/2011 12/31/2010 1231/2000 25.5 13.8 25.7 35.9 10.0 35.1 6.1 872 19.9 0.0 3.7 23.6 110.7 15.7 10.3 31.1 5.5 62.5 176 0.0 0.5 18.1 806 41.8 222 372 8.3 109.6 31.4 BALANCE SHEET Assets Cash and equivalents Accounts receivable Invertory Other current assets Total current assos Property, plant, and equipment Goodwill and other intangibles Other long-term assets Total long-termes Total assets Liabilities Accounts payable Accrued expenses Notes payable Current matures of long-term debt Other current liabilities Total current liabilities Long-term debt and capital leases Other cities Common equity Totalities and shareholder's equity 72.0 16.0 0.0 0.4 OS 16.4 88.4 1505 8.7 62 0.0 0.0 10.0 6.5 0.0 11.6 9.2 7.7 0.0 0.0 19.2 0.0 223 149 0.0 8.6 872 110.7 16.5 0.0 7.1 570 80.6 61.8 88.4 150.4 FINANCIAL DATA Cash fow from assets Stock price Common shares outstanding Market value of equly Enterprise value Asset price/Cash flow assets Asset price Adjusted net income Asset price/Sales Equity priceNet income 22.7 4.5 146 65.6 29,6 1.3 0.9x 0.3x 2. 2x Exhibit 2: Teuer Furniture Financials INCOME STATEMENT 12/31/2012 Revenue 148.2 Cost of goods sold 62.0 Seling, general, and administrative 41.3 Depreciation 1.5 R&D 0.0 Other expenses (income) 7.4 Interest expenses (net) 0.0 income before taxes 38.1 Taxes 14,4 Net income 21.7 Adjusted income (all equity firm) Eamings before interest and taxes 36.1 Adjusted taxes (all equity firm) 14.4 Not income (all equity firm) 21.7 12/31/2011 134 1 55.5 36.7 1.8 0.0 6.7 0.0 334 13.4 20.0 12/31/2010 111,5 49.1 32.5 2.0 0.0 5.6 0.0 22.2 8.9 13.3 12/31/2009 90.7 47.3 29.6 2.2 0.0 5.4 0.0 6.2 0.5 5.6 33.4 13.4 20.0 22.2 8.9 13.3 6.2 0.5 5.6 12/31/2012 12/31/2011 12/31/2010 12/31/2009 0.0 48.2 33.3 0.0 81.5 3.9 0.0 0.0 3.9 85.5 BALANCE SHEET Assets Cash and equivalents Accounts receivable Inventory Other current assets Total current assets Property, plant, and equipment Goodwill and other intangibles Other long-term assets Total long-term assets Total assets Liabilities Accounts payable Accrued expenses Notes payable Current maturities of long-term debt Other current liabilities Total current abilities Long-term debt and capital cases Other liabilites Common equity Total liabilities and shareholder's equity 0.0 42.4 292 0.0 71.6 3.1 0.0 0.0 3.1 74.B 0.0 36.6 26.8 0.0 63.4 3.8 0.0 0.0 29.1 24.9 0.0 53.9 5.1 0.0 0.0 5.1 59.0 0.0 3.8 67.3 11.4 10.0 15 0.0 0.0 0.0 13.0 0.0 0.0 72.4 85.5 0.0 0.0 0.0 11.5 0.0 0.0 63.3 748 1.4 0.0 0.0 0.0 10.5 0.0 0.0 8.3 1.2 0.0 0.0 0.0 9.5 0.0 0.0 49.6 59.0 56.8 67.3 FINANCIAL DATA Cash flow from assets 12.5 Stock price Common shares outstanding Market value of equity Enterprise value Notes: The exhibit contains the income statement and balance sheet for Teuer Furniture (2009 to 2012). Al numbers are in $M except for the number of shares (M) 9.9 Exhibit 3: Comparable Firms' Business Descriptions BASSETT FURNITURE INDUSTRIES INC. (BSET) Bassett Fumiture Industries Inc. manufactures, imports, and retails home fumishings in the United States. The company operates in three segments: wholesale, retail, and investments/real estate. The wholesale segment designs, manufactures, sources, and distributes fumiture. The retail segment operates both company-owned stores (retail outlets known as Bassett Home Furnishings) and licensee-owned stores. The firm also distributes its fumiture through other furniture retailers, specialty stores, and mass merchants. The retail segment accounted for 48 percent of the fim's sales in 2012. The investments and real estate segment consists of retail real estate leased, or previously leased, as licensee stores and equity investments in Zenith Freight Lines, LLC, which hauls freight and warehouses inventory for the firm. The company is based in Bassett, Virginia. Primary industry: Home Furnishings ETHAN ALLEN INTERIORS INC. (ETH) Ethan Allen Interiors Inc. designs, manufactures, sources, sells, and distributes a range of home fumishings and accessories. The company operates in two segments: wholesale and retail. The company's domestic manufacturing is included in the results of the wholesale segment. The firm markets its products under the Ethan Allen brand through its own retail network and independent retailers as well as online. Its products include case goods (e.g., beds, dressers, armoires, tables, chairs, buffets, entertainment units, home office furniture, and wooden accents), upholstery home furnishing items (e.g., sleepers, recliners, chairs, sofas, loveseats, cut fabrics, and leather), and home accessories (eg, window treatments, wall decor, lighting, clocks, bedding, and bedspreads). The firm provides home decorating and design solutions through a network of retail design centers in the United States and intemationally. The company is headquartered in Danbury, Connecticut. Primary industry: Home Furnishings FURNITURE BRANDS INTERNATIONAL INC. (FBN) Furniture Brands International Inc. is engaged in designing, manufacturing, sourcing, and retailing home fumishings in the United States and internationally. The company markets products through its own Thomasville retail stores, independent interior designers, multi-line independent retailers, and mass merchant stores. The company's brands include Thomasville, Broyhill, Lane, Drexel Heritage, Henredon, Pearson, Hickory Chair, Lane Venture, Maitland- Smith, and La Barge. Thomasville has both wood fumiture and upholstered products in the mid- to upper-price ranges and also offers ready-to-assemble furniture under the Creative Interiors brand name. The company offers case goods, stationary upholstery products, motion upholstery products (e.g., recliners and sleeper sofas), and occasional fumiture (eg., wood, metal, and glass tables, accent pieces, and home entertainment centers). The company changed its name from Interco Inc. to Furniture Brands International Inc. in 1996. The fim is headquartered in St. Louis, Missouri. Primary industry: Home Furnishings Exhibit 3 (continued) HAVERTY FURNITURE COMPANIES INC. (HVT) Haverty Fumiture Companies Inc. is a specialty retailer of residential furniture and accessories. All of its retail locations operate under the Haverty name, and the company does not franchise its stores. It also offers mattress products under the Sealy, Serta, and Tempur-Pedic names. In addition, the company provides financing through an internal revolving charge credit plan, as well as a third-party finance company. The company buys its merchandise from numerous foreign and domestic manufacturers and importers. Its case goods are generally imported from Asia. The fim is based in Atlanta, Georgia. Primary industry: Home Furnishings Retail LA-Z-BOY INCORPORATED (LZB) La-Z-Boy Incorporated manufactures, markets, imports, distributes, and retails upholstery products, accessories, recliners, and case goods. It operates in three segments upholstery, case goods, and retail. The upholstery segment manufactures and imports upholstered fumiture (e.g., recliners, sofas, loveseats, chairs, sectionals, and sleeper sofas). This segment sells directly to La- Z-Boy Fumiture Galleries stores, operators of Comfort Studios locations, dealers, and other independent retailers. The case goods segment imports, markets, manufactures, and distributes case goods fumiture. This segment sells its products to dealers and other independent retailers. The retail segment sells upholstered furniture, case goods, and other products through La-z-Boy Fumiture Galleries and Comfort Studios. The company sells its products primarily in the United States and Canada. The company is based in Monroe, Michigan. Primary industry: Home Furnishings Retail RESTORATION HARDWARE HOLDINGS INC. (RH) Restoration Hardware Holdings Inc. sells home furnishings to the retail market across a number of categories. Its product line includes furniture for the bedroom, dining room, home office, and media furniture for any room in the house. The company sells indoor and outdoor lighting products, textiles (e.g., bed linens, bath linens, drapery, rugs, and pillows), and bathware products (e.g., faucets and sinks). The company also offers decorative accessories, home accessories, wall art products, outdoor and garden products, and baby and child products that include furniture, bedding, window coverings, flooring, lighting, and dcor. In addition, the company sells tableware products (e.g., dinnerware, serveware, glassware, flatware, and table linens). The company sells its products through its retail locations, catalogs, and websites (Restoration Hardware.com and RHBabyandChild.com) in the United States and Canada. The company is headquartered in Corte Madera, California. Primary industry: Home Furnishings Retail STANLEY FURNITURE COMPANY (STLY) Stanley Furniture Company designs, manufactures, and imports wood furniture for the residential market in the United States. It offers upscale home fumishings for the adult market, including dining, bedroom, home office, home entertainment, and accent items under the Stanley Fumiture brand and for children's fumiture under the Young America brand. The company sells Teuer Furniture (B): Multiples Valuation Teuer Furniture had regained its financial footing by the end of 2012. A number of long-term investors, including several of Teuer's original non-management investors, now want to sell their shares. Jennifer Jerabek, the chief financial officer of Teuer, and her team put together an extensive valuation of the company based on a discounted cash flow (DCF) analysis. One criticism of the DCF valuation is that the resulting stock value depends upon the assumptions of the model. There are often dozens or hundreds of assumptions that go into a sophisticated DCF valuation model. When the model was presented to investors, a number of them disagreed with the results. Some investors considered the value too high and others considered the value too low. Jerabek was instructed to produce a valuation that did not depend upon assumptions about future growth, profitability, and capital investment needs or the discretion of the finance team. She was asked to value Teuer using a multiples approach. Multiples Approach to Valuation Multiples valuation is relatively straightforward as compared to a sophisticated DCF analysis. To value a firm or division using a multiples approach, one needs only two inputs: a set of comparable firms and a set of valuation metrics. For each comparable firm and valuation metric, the team calculates the ratio of the comparable firm's market value to the valuation metric.' Unlike DCF, for which Jerabek's team was required to make a large number of assumptions, a multiples approach requires the team to make only one assumption--that the valuation ratio for the comparable firm(s) (which can be observed) is the same as the valuation ratio for Teuer Furniture (which cannot be observed). A large number of possible valuation metrics can be derived from the income statement, balance sheet, and cash flow statement of a company. Valuation metrics can also be taken from non-financial sources. Even if the team focused only on profits, it could use net income, pre-tax profits, earnings before interest and taxes (EBIT), earnings before interest, taxes, amortization, and depreciation (EBITDA), or gross profit (revenue minus costs of goods sold). To limit the scope of the analysis, Jerabek decided to start with three valuation metrics: sales revenue, net income, and cash flow from assets (CFA). Comparable Firm Selection The next challenge Jerabek faced was finding a set of comparable firms. To help with the selection and data collection, she tumed to one of her contacts at a boutique investment bank, Primus River Capital. Its mergers and acquisitions group provided a list of publicly traded firms whose primary industry classification was home furnishings or home furishings retail. A number of firms classified as home furnishings were excluded because their product mix was very different from Teuer's. This resulted in a list of nine firms. The income statements and balance sheets of the nine firms are contained in Exhibit 1, along with additional financial market data. The available data for Teuer Furniture is presented in the same format in Exhibit 2. Although the nine firms provided by Teuer's banker all have a presence in the home furnishings industry, they differ across a number of potentially important dimensions. A description of each firm's business is contained in Exhibit 3. Some of the firms manufacture furniture, while others do not. Some have interational operations either sales or manufacturing while others do not. Some of the firms have product lines that are more limited than Teuer's, while others have product lines that are much broader. Valuation of Teuer Furniture With the data in hand, Jerabek needed to select from the nine candidates a set of firms that are comparable to Teuer Furniture, as well as select a valuation ratio. But on what dimensions should she compare the firms? Exhibit 1: Comparable Firms' Financials PANEL A: BASSETT FURNITURE INDUSTRIES INC. (BSET) INCOME STATEMENT 12/31/2012 12/31/2011 Revenue 269.7 253.2 Cost of goods sold 128.4 125.6 Seling, general, and administrative 134.8 122.0 Depreciation 0.0 0.0 R&D 0.0 00 Other expenses (income) -5.2 -54.8 Interest expenses (net) -0.2 Income before taxes 120 59.7 Taxes -14.7 Net income 26.7 55.3 Adjusted income (all equity firm) Earnings before interest and taxes 11.7 60.3 Adjusted taxes (all equity frm) 4.4 Net Income (all equity firmy 26.1 55.9 12/3V2010 2353 1226 1108 00 00 12/31/2009 232.7 12.9 103.8 0.0 00 21.6 2.0 -24.5 -1.8 -22.7 0.6 -0.B -22 -02 -20 -3.0 03 -22.5 -1.7 -20.9 12/31/2012 12/31/2011 12/3V2010 12/31/2009 BALANCE SHEET Assets Cash and equivalents Accounts receivable Invertory Other current assets Total current assets Property, plant, and equipment Goodwill and other intangibles Other long-term assets Total long-term sets Total assets Liabilities Accounts payable Accrued expenses Notes payable Current maturities of long-term debt Other current liabilities Total current liabilties Long-term debt and capital leases Other lates Common equity Totables and shareholder's quity 45.6 15.8 57.9 13.3 132.5 58.6 0.0 38.0 94.7 227.2 69.6 14.8 45.1 10.7 140.2 49.9 0.0 33.0 83.0 2232 11.1 316 418 70 915 463 15.1 445 105.8 23.2 34.6 33.4 13.3 1045 50.6 14.9 46.1 111.7 216.2 1973 14.7 17.2 0.0 22.4 17.4 0.0 0.0 12.8 52.6 3.1 14.3 1573 18.8 17.7 0.0 0.0 15.3 518 3.7 15.3 152.4 223.2 249 174 0.0 95 10.1 618 7.0 43.3 32.0 30.7 110.3 216.2 249 1063 2272 1973 FINANCIAL DATA Cash fow from assets Stock price Common shares outstanding Market value of equity Enterprise value Asset price Cash flow assets Asset price Adjusted net income Asset price/Sales Equity prionNet income -2.2 14.2 10.9 154.7 112.2 NMF 0.4x 5.8x Exhibit 1 (continued) 6/30/2011 6790 3295 PANEL B: ETHAN ALLEN INTERIORS INC. (ETH) INCOME STATEMENT 6/30/2012 Revenue 7294 Cost of goods sold 339.1 Selling general, and administrative 3220 Depreciation 186 R&D 00 Other expenses (income) 0.0 Interest expenses (net) 8.5 Income before taxes 412 85 Net income 497 Adjusted income (all equity firm) Earnings before interest and are 49.7 Adjusted taxes (all equity firm) -102 Net income (all equity fimm 599 205 OD OD 55 26.4 6/30/2010 590.1 309.8 2626 29.4 0.0 0.0 7.1 -18.8 25.5 6/30/2009 674.3 3269 394.5 25.6 0.0 0.0 8.4 81.2 -28.5 -52.7 319 35 35.4 15.9 -27.7 -72.8 -25.5 472 6/30/2012 6/30/2011 5/30/2010 6/30/2009 BALANCE SHEET Assets Cash and equivalents Accounts receive Invertory Other current assets Total current assets Property, plant, and equipment Goodwill and other intangibles Other long-term assets Total long-term assets Total assets Liabilities Accounts payable Accrued expenses Notes payable Current maturities of long-term debt Other current liabilities Total current liabilities Long-term debt and capital leases Other lilities Common equity Total Habilities and shareholder's quity 887 149 1557 234 2828 2957 45.1 212 3620 5448 91.4 150 1417 20.4 2685 2049 45.1 198 3598 84.9 17.1 134.0 23.6 259.7 305.7 45.1 212 372.1 531.8 53.0 13.1 156.5 29.2 251.7 333.6 45.1 16.1 394.8 646.5 270 650 OD OD 24.0 65.3 0.0 3.9 273 580 0.0 03 655 151.1 1543 178 3217 6448 22.2 58.5 0.0 0.0 31.7 112.5 2031 25.0 305.9 646.5 526 145.7 199.4 1545 1650 270 282 2585 6283 631.7 FINANCIAL DATA Cash fow from assets Stock price Common shares outstanding Market value of equly Enterprise value Asset price/Cash flow assets Asset price Adjusted net income Asset price/Sales Equity priceNet income 277 19.9 28.8 573.1 638.9 23.0x 10.7x 0.9 Exhibit 1 (continued) PANEL C: FURNITURE BRANDS INTERNATIONAL INC. (FBN) INCOME STATEMENT 12/29/2012 12/31/2011 Revenue 1,072.3 1.107.7 Cost of goods sold 827.3 837.1 Selling, general, and administrative 2528 270.9 Depreciation 18.9 21.9 R&D 0.0 0.0 Other expenses (income) 16.6 20.8 Interest expenses (net) 5.7 3.6 Income before taxes 49.0 46.6 Taxes -1.8 -2.8 Net Income 47.3 43.8 Adjusted income (all equity firm) Earnings before interest and tres -43.0 Adjusted taxes (all equity firm) -1.6 -2.6 Net Income (al equity in 41.8 -40.4 12/312010 1,1599 879.2 2852 23.9 0.0 16.5 3.2 12/31/2000 1.224.4 986.2 3228 20.7 0.0 65.8 5.3 - 176.5 -67.8 -108.7 -39.0 448 -8.3 -36.4 -171.1 -65.7 -105.4 12/29/2012 12/31/2011 12/312010 12/31/2009 11.9 125.7 244.3 11.3 393.2 103.4 76.1 45.7 225.2 618.4 25.4 1080 2282 9.5 371.0 115.8 77.5 50.2 243.5 614.5 520 114.5 249.7 11.2 427.4 1249 86.5 376 249.0 676.4 83.9 184.5 226.1 9.3 503.7 134.4 87.6 254.4 758.1 BALANCE SHEET Assets Cash and equivalents Accounts receivable Invertory Other current Total current ass Property, plant, and equipment Goodwill and other intangibles Oher long-term assets Total long-term assets Totales Liabilities Accounts payable Accrued expenses Notes payable Current maturites of long-term debt Other current liabilities Total current liabilities Long-term debt and capital leases Other pilties Common equity Total abilities and shareholder's equity FINANCIAL DATA Cash fow from assets Stock prio Common shares outstanding Market value of equly Enterprise value Asset price Cash flow assets Asset price Adjusted net income Asset price/Sales Equity price.Net income 113.6 58.7 0.0 0.0 0.0 172.3 105.0 286.3 54.8 618.4 85.6 53.6 0.0 0.0 0.0 1392 77.0 266.1 132.3 6145 79.9 61.2 0.0 0.0 00 141.1 77.0 198.8 2906 676.4 83.8 75.9 0.0 17.0 0.0 176.8 78.0 240.6 262.8 758.1 -5.8 74 8.0 59.7 152.8 NMF NMF 0.1% NMF Exhibit 1 (continued) 12/31/2009 588.3 PANEL D: HAVERTY FURNITURE COMPANIES INC. (HVT) INCOME STATEMENT 12/31/2012 12/31/2011 Revenue 6704 6214 Cost of goods sold 3180 3002 Seling, general, and administrative 3096 2978 Depreciation 194 182 R&D 0.0 00 Other expenses (income) -08 -0.2 Interest expenses (net) 0.6 07 Income before taxes 235 45 Taes -10.9 Net income 155 Adjusted income (all equity firm) Earnings before interest and taxes 5.3 Adjusted taxes (all equity firm) 8.8 -12.6 Net Income (all equity fim 153 179 12/312010 6203 3016 2954 16.9 0.0 30 0.8 8.7 02 84 29.2 19.3 0.0 0.8 -5.4 86 149 42 46 9.5 0.3 -10 -3.6 12/31/2012 12/31/2011 12/312010 12/31/2009 53.6 9.7 96.9 19.7 179.9 193.1 0.0 29.1 2222 402.1 49.6 115 937 229 1777 179.3 00 28.1 58.1 13.8 91.9 13.2 176.9 175.5 0.0 17.7 44.5 15.3 93.3 15.2 168.3 1764 2074 BALANCE SHEET Assets Cash and equivalents Accounts receivable Inventory Other current assets Total current assets Property, plant, and equipment Goodwill and other intangibles Other long-term assets Total long-term assets Total assets Liabilities Accounts payable Accrued expenses Notes payable Current maturities of long-term debt Other current liabilities Total current liabilities Long-term debt and capital leases Other listes Common equity Total liabilities and shareholder's quity 1932 16.2 192.6 360. 385.1 3702 19.1 30.2 0.0 11.8 0.0 0.9 49.0 89.9 18.5 343 2594 402.1 212 110 OD 0.8 394 724 123 378 2627 385.1 314 0.0 0.5 206 706 8.6 379 2532 3702 218 71.4 6.8 38.1 214,6 360.9 FINANCIAL DATA Cash fow from assets Stock price Common shares outstanding Market value of equly Enterprise value Asset pricel Cash flow assets Asset price Adjusted net income Asset prica/Sales Equity priceNet income 16.2 16.3 22.3 3629 328.7 20.3x 21.5% 0.5x 24.3x Exhibit 1 (continued) PANEL E: LA-Z-BOY INCORPORATED (LZB) INCOME STATEMENT 4/28/2012 Revenue 1.231.7 Cost of goods sold 851.8 Selling, general, and administrative 306.7 Depreciation 23.5 R&D 0.0 Other expenses (income) -186 Interest expenses (net) Income before taxes 68.9 Taxes -22.0 Not income 88.9 Adjusted income (all equity firm) Earnings before interest and taxes 68.2 Adjusted taxes (all equity firm) -225 Net income (all equity 90.7 4/30/2011 1,187.1 8328 2997 24.3 00 21 23 260 8.6 174 4.24 2010 1,1792 804.5 307.5 252 0.0 5.8 3.0 44.7 12.7 32.1 4/25/2009 1,2267 8879 408.7 24.1 OD -26 5.6 -970 24.3 - 1213 283 9.4 18.9 47.7 13.5 34.2 -914 22.9 -114.4 4/28/2012 4/30/2011 424/2010 4/25/2009 BALANCE SHEET Assets Cash and equivalents Accounts receivable Invertory Other current assets Total current assets Property, plant, and equipment Goodwill and other intangibles Other long-term assets Total long-term assets Total assets Liabiti Accounts payable Accrued expenses Notes payable Current maturites of long-term debt Other current liabilities Total current liabilis Long-term debt and opital leases Other liabilities Common equity Total liabilitles and shareholder's aquity 152.4 167.2 143.8 36.6 500.0 114.4 3.0 68.3 185.7 685.7 1153 1613 1384 172 4322 120.6 3.1 375 1612 5935 108.4 165.0 132.5 21.2 427.1 138.9 3.1 38.8 180.7 607.8 36.1 1479 1402 237 3478 150.2 3.1 514 2048 5525 56.6 44.9 0.0 1.8 46.4 149.8 7.9 86.1 441.9 685.7 49.5 374 OD 5.1 400 132.1 299 70.1 3813 593.4 54.7 51.7 0.0 1.1 39.8 147.3 46.9 73.7 339.8 607.8 41.6 757 OD 8.7 0.0 1260 52.1 68.6 305.7 5525 FINANCIAL DATA Cash fow from assets Stock price Common shares outstanding Market value of equity Enterprise value Asset price Cash flow assets Asset price Adjusted net income Asset prio/Sales Equity priceNet income 72.5 15.3 522 8014 658.8 9.1x 7. 3x 0.5% 9.Ox 12/31/2011 1046 922 17.6 12/312010 1370 153.1 11.2 Exhibit 1 (continued) PANEL G: STANLEY FURNITURE COMPANY (STLY) INCOME STATEMENT 12/31/2012 Revenue 986 Cost of goods sold 85.9 Selling general, and administrative 16.5 Depreciation R&D 0.0 Other expenses (income) -39.0 Interest expenses (net) 23 Income before taxes 310 Tas 0.7 Net income 304 Adjusted income (all equity firm) Earnings before interest and the Adjusted to all equity firm) 0.7 Net income (all equity 32.7 0.0 7.5 3.5 0.0 4.1 23 -50 00 -5.0 1231/2009 160.5 158.7 20.7 6.0 0.0 -9.5 3.7 - 19.1 -74 - 11.7 40 -2.7 0.0 -2.7 3.7 40.5 -9.5 12/31/2012 12/31/2011 12/31/2010 1231/2000 25.5 13.8 25.7 35.9 10.0 35.1 6.1 872 19.9 0.0 3.7 23.6 110.7 15.7 10.3 31.1 5.5 62.5 176 0.0 0.5 18.1 806 41.8 222 372 8.3 109.6 31.4 BALANCE SHEET Assets Cash and equivalents Accounts receivable Invertory Other current assets Total current assos Property, plant, and equipment Goodwill and other intangibles Other long-term assets Total long-termes Total assets Liabilities Accounts payable Accrued expenses Notes payable Current matures of long-term debt Other current liabilities Total current liabilities Long-term debt and capital leases Other cities Common equity Totalities and shareholder's equity 72.0 16.0 0.0 0.4 OS 16.4 88.4 1505 8.7 62 0.0 0.0 10.0 6.5 0.0 11.6 9.2 7.7 0.0 0.0 19.2 0.0 223 149 0.0 8.6 872 110.7 16.5 0.0 7.1 570 80.6 61.8 88.4 150.4 FINANCIAL DATA Cash fow from assets Stock price Common shares outstanding Market value of equly Enterprise value Asset price/Cash flow assets Asset price Adjusted net income Asset price/Sales Equity priceNet income 22.7 4.5 146 65.6 29,6 1.3 0.9x 0.3x 2. 2x Exhibit 2: Teuer Furniture Financials INCOME STATEMENT 12/31/2012 Revenue 148.2 Cost of goods sold 62.0 Seling, general, and administrative 41.3 Depreciation 1.5 R&D 0.0 Other expenses (income) 7.4 Interest expenses (net) 0.0 income before taxes 38.1 Taxes 14,4 Net income 21.7 Adjusted income (all equity firm) Eamings before interest and taxes 36.1 Adjusted taxes (all equity firm) 14.4 Not income (all equity firm) 21.7 12/31/2011 134 1 55.5 36.7 1.8 0.0 6.7 0.0 334 13.4 20.0 12/31/2010 111,5 49.1 32.5 2.0 0.0 5.6 0.0 22.2 8.9 13.3 12/31/2009 90.7 47.3 29.6 2.2 0.0 5.4 0.0 6.2 0.5 5.6 33.4 13.4 20.0 22.2 8.9 13.3 6.2 0.5 5.6 12/31/2012 12/31/2011 12/31/2010 12/31/2009 0.0 48.2 33.3 0.0 81.5 3.9 0.0 0.0 3.9 85.5 BALANCE SHEET Assets Cash and equivalents Accounts receivable Inventory Other current assets Total current assets Property, plant, and equipment Goodwill and other intangibles Other long-term assets Total long-term assets Total assets Liabilities Accounts payable Accrued expenses Notes payable Current maturities of long-term debt Other current liabilities Total current abilities Long-term debt and capital cases Other liabilites Common equity Total liabilities and shareholder's equity 0.0 42.4 292 0.0 71.6 3.1 0.0 0.0 3.1 74.B 0.0 36.6 26.8 0.0 63.4 3.8 0.0 0.0 29.1 24.9 0.0 53.9 5.1 0.0 0.0 5.1 59.0 0.0 3.8 67.3 11.4 10.0 15 0.0 0.0 0.0 13.0 0.0 0.0 72.4 85.5 0.0 0.0 0.0 11.5 0.0 0.0 63.3 748 1.4 0.0 0.0 0.0 10.5 0.0 0.0 8.3 1.2 0.0 0.0 0.0 9.5 0.0 0.0 49.6 59.0 56.8 67.3 FINANCIAL DATA Cash flow from assets 12.5 Stock price Common shares outstanding Market value of equity Enterprise value Notes: The exhibit contains the income statement and balance sheet for Teuer Furniture (2009 to 2012). Al numbers are in $M except for the number of shares (M) 9.9 Exhibit 3: Comparable Firms' Business Descriptions BASSETT FURNITURE INDUSTRIES INC. (BSET) Bassett Fumiture Industries Inc. manufactures, imports, and retails home fumishings in the United States. The company operates in three segments: wholesale, retail, and investments/real estate. The wholesale segment designs, manufactures, sources, and distributes fumiture. The retail segment operates both company-owned stores (retail outlets known as Bassett Home Furnishings) and licensee-owned stores. The firm also distributes its fumiture through other furniture retailers, specialty stores, and mass merchants. The retail segment accounted for 48 percent of the fim's sales in 2012. The investments and real estate segment consists of retail real estate leased, or previously leased, as licensee stores and equity investments in Zenith Freight Lines, LLC, which hauls freight and warehouses inventory for the firm. The company is based in Bassett, Virginia. Primary industry: Home Furnishings ETHAN ALLEN INTERIORS INC. (ETH) Ethan Allen Interiors Inc. designs, manufactures, sources, sells, and distributes a range of home fumishings and accessories. The company operates in two segments: wholesale and retail. The company's domestic manufacturing is included in the results of the wholesale segment. The firm markets its products under the Ethan Allen brand through its own retail network and independent retailers as well as online. Its products include case goods (e.g., beds, dressers, armoires, tables, chairs, buffets, entertainment units, home office furniture, and wooden accents), upholstery home furnishing items (e.g., sleepers, recliners, chairs, sofas, loveseats, cut fabrics, and leather), and home accessories (eg, window treatments, wall decor, lighting, clocks, bedding, and bedspreads). The firm provides home decorating and design solutions through a network of retail design centers in the United States and intemationally. The company is headquartered in Danbury, Connecticut. Primary industry: Home Furnishings FURNITURE BRANDS INTERNATIONAL INC. (FBN) Furniture Brands International Inc. is engaged in designing, manufacturing, sourcing, and retailing home fumishings in the United States and internationally. The company markets products through its own Thomasville retail stores, independent interior designers, multi-line independent retailers, and mass merchant stores. The company's brands include Thomasville, Broyhill, Lane, Drexel Heritage, Henredon, Pearson, Hickory Chair, Lane Venture, Maitland- Smith, and La Barge. Thomasville has both wood fumiture and upholstered products in the mid- to upper-price ranges and also offers ready-to-assemble furniture under the Creative Interiors brand name. The company offers case goods, stationary upholstery products, motion upholstery products (e.g., recliners and sleeper sofas), and occasional fumiture (eg., wood, metal, and glass tables, accent pieces, and home entertainment centers). The company changed its name from Interco Inc. to Furniture Brands International Inc. in 1996. The fim is headquartered in St. Louis, Missouri. Primary industry: Home Furnishings Exhibit 3 (continued) HAVERTY FURNITURE COMPANIES INC. (HVT) Haverty Fumiture Companies Inc. is a specialty retailer of residential furniture and accessories. All of its retail locations operate under the Haverty name, and the company does not franchise its stores. It also offers mattress products under the Sealy, Serta, and Tempur-Pedic names. In addition, the company provides financing through an internal revolving charge credit plan, as well as a third-party finance company. The company buys its merchandise from numerous foreign and domestic manufacturers and importers. Its case goods are generally imported from Asia. The fim is based in Atlanta, Georgia. Primary industry: Home Furnishings Retail LA-Z-BOY INCORPORATED (LZB) La-Z-Boy Incorporated manufactures, markets, imports, distributes, and retails upholstery products, accessories, recliners, and case goods. It operates in three segments upholstery, case goods, and retail. The upholstery segment manufactures and imports upholstered fumiture (e.g., recliners, sofas, loveseats, chairs, sectionals, and sleeper sofas). This segment sells directly to La- Z-Boy Fumiture Galleries stores, operators of Comfort Studios locations, dealers, and other independent retailers. The case goods segment imports, markets, manufactures, and distributes case goods fumiture. This segment sells its products to dealers and other independent retailers. The retail segment sells upholstered furniture, case goods, and other products through La-z-Boy Fumiture Galleries and Comfort Studios. The company sells its products primarily in the United States and Canada. The company is based in Monroe, Michigan. Primary industry: Home Furnishings Retail RESTORATION HARDWARE HOLDINGS INC. (RH) Restoration Hardware Holdings Inc. sells home furnishings to the retail market across a number of categories. Its product line includes furniture for the bedroom, dining room, home office, and media furniture for any room in the house. The company sells indoor and outdoor lighting products, textiles (e.g., bed linens, bath linens, drapery, rugs, and pillows), and bathware products (e.g., faucets and sinks). The company also offers decorative accessories, home accessories, wall art products, outdoor and garden products, and baby and child products that include furniture, bedding, window coverings, flooring, lighting, and dcor. In addition, the company sells tableware products (e.g., dinnerware, serveware, glassware, flatware, and table linens). The company sells its products through its retail locations, catalogs, and websites (Restoration Hardware.com and RHBabyandChild.com) in the United States and Canada. The company is headquartered in Corte Madera, California. Primary industry: Home Furnishings Retail STANLEY FURNITURE COMPANY (STLY) Stanley Furniture Company designs, manufactures, and imports wood furniture for the residential market in the United States. It offers upscale home fumishings for the adult market, including dining, bedroom, home office, home entertainment, and accent items under the Stanley Fumiture brand and for children's fumiture under the Young America brand. The company sells