

Answered step by step
Verified Expert Solution
Question
1 Approved Answer
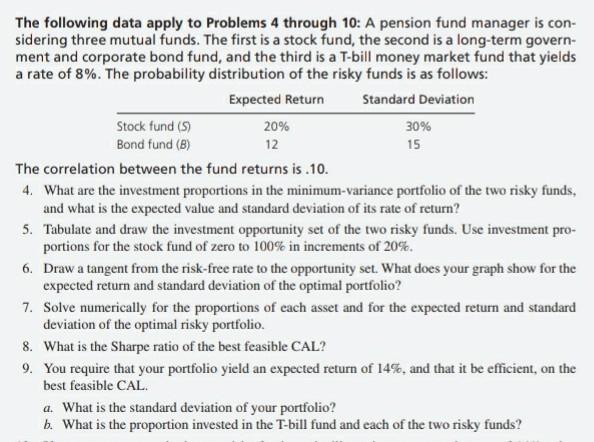
*** I need just question 7 , 8 ,9 *** thank you very much The following data apply to Problems 4 through 10: A pension
*** I need just question 7 , 8 ,9 ***
thank you very much
The following data apply to Problems 4 through 10: A pension fund manager is con- sidering three mutual funds. The first is a stock fund, the second is a long-term govern- ment and corporate bond fund, and the third is a T-bill money market fund that yields a rate of 8%. The probability distribution of the risky funds is as follows: Expected Return Standard Deviation 20% 30% Stock fund (S) Bond fund (B) 12 15 The correlation between the fund returns is 10. 4. What are the investment proportions in the minimum-variance portfolio of the two risky funds, and what is the expected value and standard deviation of its rate of return? 5. Tabulate and draw the investment opportunity set of the two risky funds. Use investment pro- portions for the stock fund of zero to 100% in increments of 20%. 6. Draw a tangent from the risk-free rate to the opportunity set. What does your graph show for the expected return and standard deviation of the optimal portfolio? 7. Solve numerically for the proportions of each asset and for the expected return and standard deviation of the optimal risky portfolio. 8. What is the Sharpe ratio of the best feasible CAL? 9. You require that your portfolio yield an expected return of 14%, and that it be efficient, on the best feasible CAL. a. What is the standard deviation of your portfolio? b. What is the proportion invested in the T-bill fund and each of the two risky fundsStep by Step Solution
There are 3 Steps involved in it
Step: 1

Get Instant Access to Expert-Tailored Solutions
See step-by-step solutions with expert insights and AI powered tools for academic success
Step: 2

Step: 3
Ace Your Homework with AI
Get the answers you need in no time with our AI-driven, step-by-step assistance
Get Started
Have More Money Now A Commonsense Approach To Financial Management
Authors: John Layfield
1st Edition
0743466330,1416595775