 I need python code and figures generated for the simulated situation. And I need short step-by-step comments because I will make a presentation. Note: This course is called Random Signals and Noise. It is taught in the electrical engineering department but is mostly based on probability and statistics. If it's not enough, I'll edit the question again. If necessary, you can use libraries such as numpy, matplotlib, seaborn, but do not use advanced libraries. In fact, a simple and clear solution is enough for me.
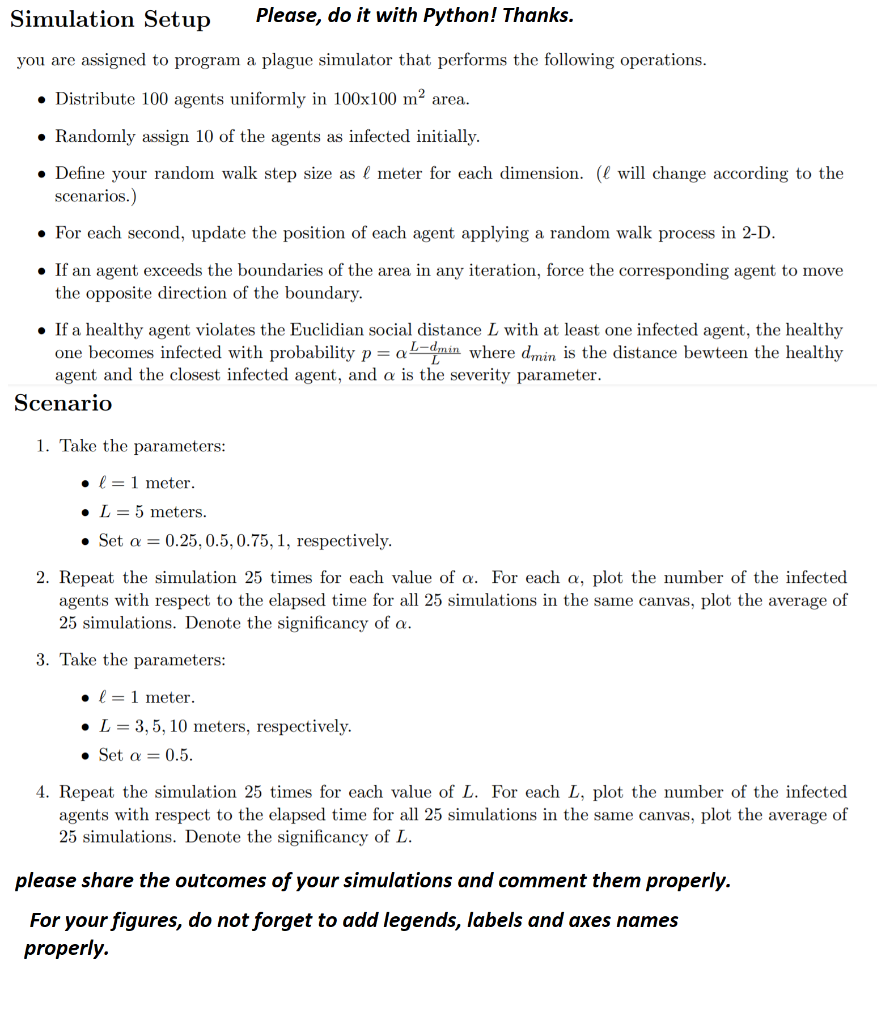
Simulation Setup Please, do it with Python! Thanks. you are assigned to program a plague simulator that performs the following operations. Distribute 100 agents uniformly in 100x100 m2 area. Randomly assign 10 of the agents as infected initially. Define your random walk step size as l meter for each dimension. (l will change according to the scenarios.) . For each second, update the position of each agent applying a random walk process in 2-D. If an agent exceeds the boundaries of the area in any iteration, force the corresponding agent to move the opposite direction of the boundary. If a healthy agent violates the Euclidian social distance L with at least one infected agent, the healthy one becomes infected with probability p= a L-dmin where dmin is the distance bewteen the healthy agent and the closest infected agent, and a is the severity parameter. Scenario 1. Take the parameters: l= 1 meter. L= 5 meters. Set a = 0.25, 0.5, 0.75, 1, respectively. 2. Repeat the simulation 25 times for each value of a. For each a, plot the number of the infected agents with respect to the elapsed time for all 25 simulations in the same canvas, plot the average of 25 simulations. Denote the significancy of a. 3. Take the parameters: l=1 meter. L = 3, 5, 10 meters, respectively. Set a=0.5. 4. Repeat the simulation 25 times for each value of L. For each L, plot the number of the infected agents with respect to the elapsed time for all 25 simulations in the same canvas, plot the average of 25 simulations. Denote the significancy of L. please share the outcomes of your simulations and comment them properly. For your figures, do not forget to add legends, labels and axes names properly. Simulation Setup Please, do it with Python! Thanks. you are assigned to program a plague simulator that performs the following operations. Distribute 100 agents uniformly in 100x100 m2 area. Randomly assign 10 of the agents as infected initially. Define your random walk step size as l meter for each dimension. (l will change according to the scenarios.) . For each second, update the position of each agent applying a random walk process in 2-D. If an agent exceeds the boundaries of the area in any iteration, force the corresponding agent to move the opposite direction of the boundary. If a healthy agent violates the Euclidian social distance L with at least one infected agent, the healthy one becomes infected with probability p= a L-dmin where dmin is the distance bewteen the healthy agent and the closest infected agent, and a is the severity parameter. Scenario 1. Take the parameters: l= 1 meter. L= 5 meters. Set a = 0.25, 0.5, 0.75, 1, respectively. 2. Repeat the simulation 25 times for each value of a. For each a, plot the number of the infected agents with respect to the elapsed time for all 25 simulations in the same canvas, plot the average of 25 simulations. Denote the significancy of a. 3. Take the parameters: l=1 meter. L = 3, 5, 10 meters, respectively. Set a=0.5. 4. Repeat the simulation 25 times for each value of L. For each L, plot the number of the infected agents with respect to the elapsed time for all 25 simulations in the same canvas, plot the average of 25 simulations. Denote the significancy of L. please share the outcomes of your simulations and comment them properly. For your figures, do not forget to add legends, labels and axes names properly
 I need python code and figures generated for the simulated situation. And I need short step-by-step comments because I will make a presentation. Note: This course is called Random Signals and Noise. It is taught in the electrical engineering department but is mostly based on probability and statistics. If it's not enough, I'll edit the question again. If necessary, you can use libraries such as numpy, matplotlib, seaborn, but do not use advanced libraries. In fact, a simple and clear solution is enough for me.


