Answered step by step
Verified Expert Solution
Question
1 Approved Answer
I need solution of point no 7,8,11 for investment banks(HSBC AND CITI BANK, 5 YEARS DATA) for accounting project I posted some examples of one
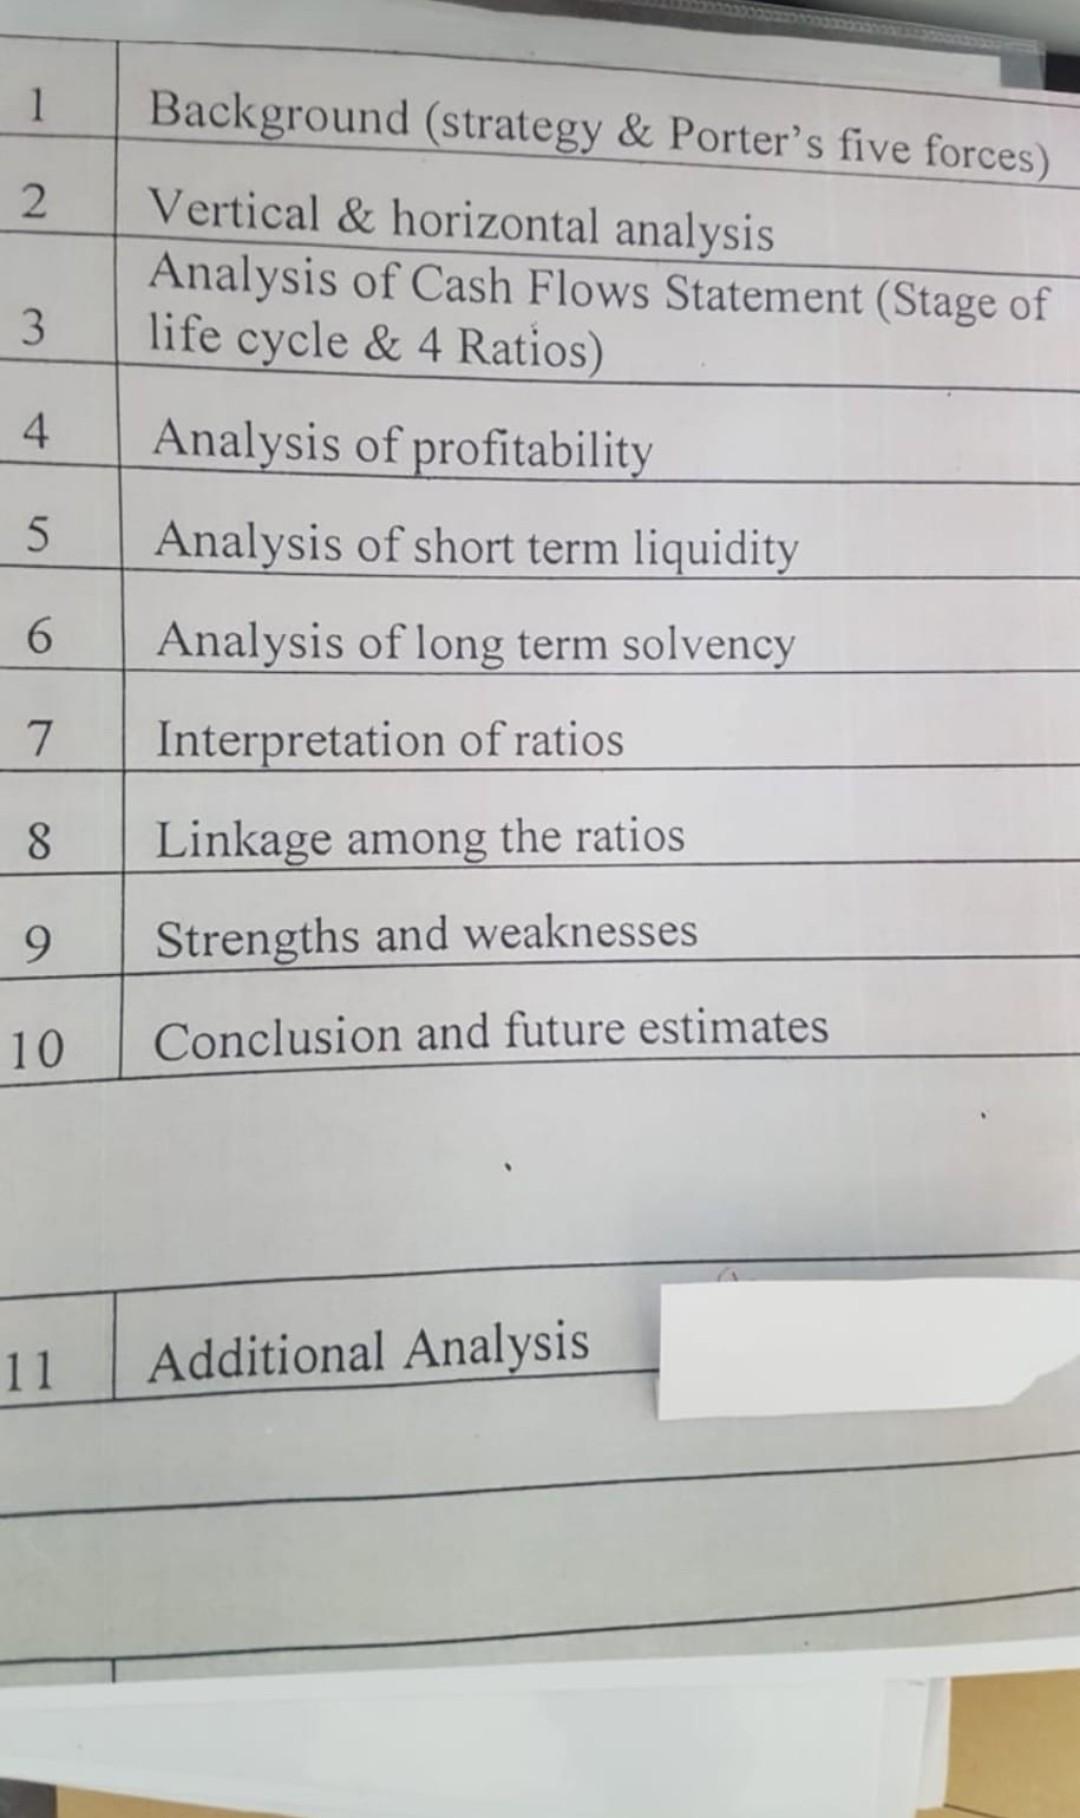
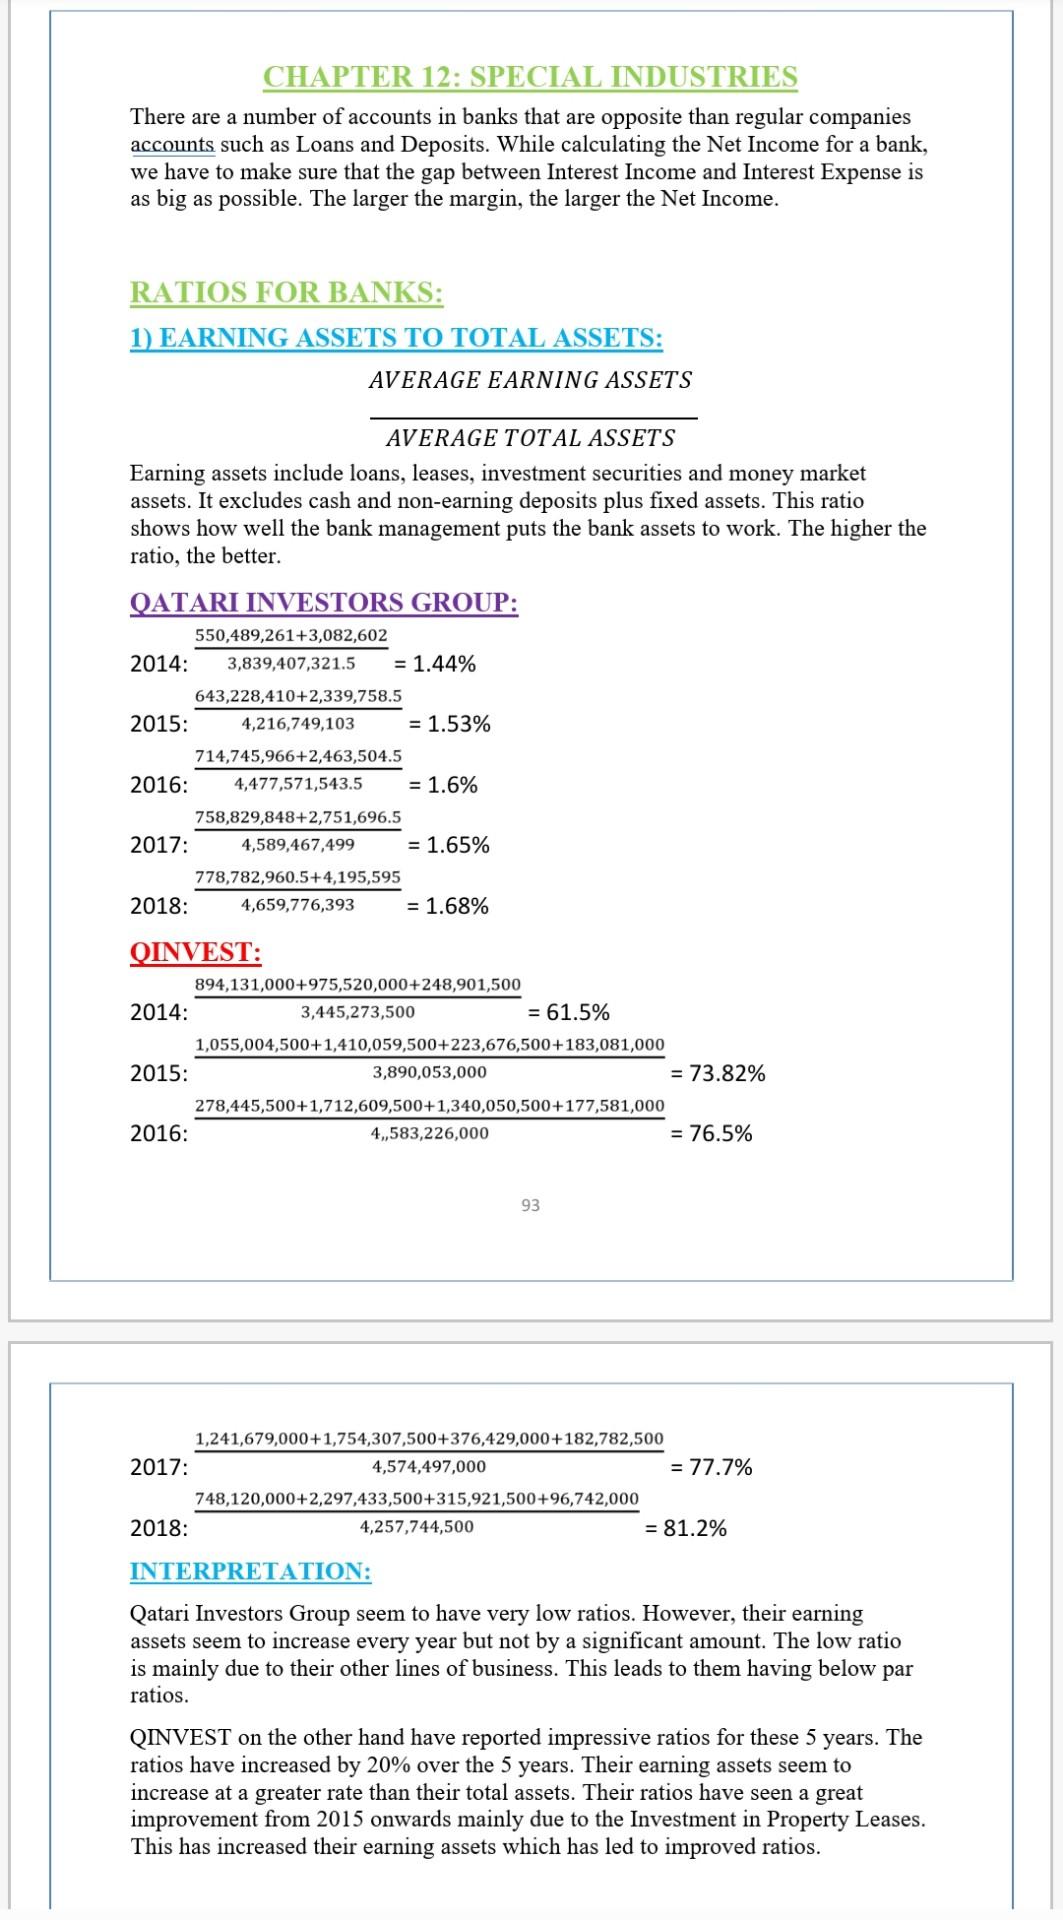
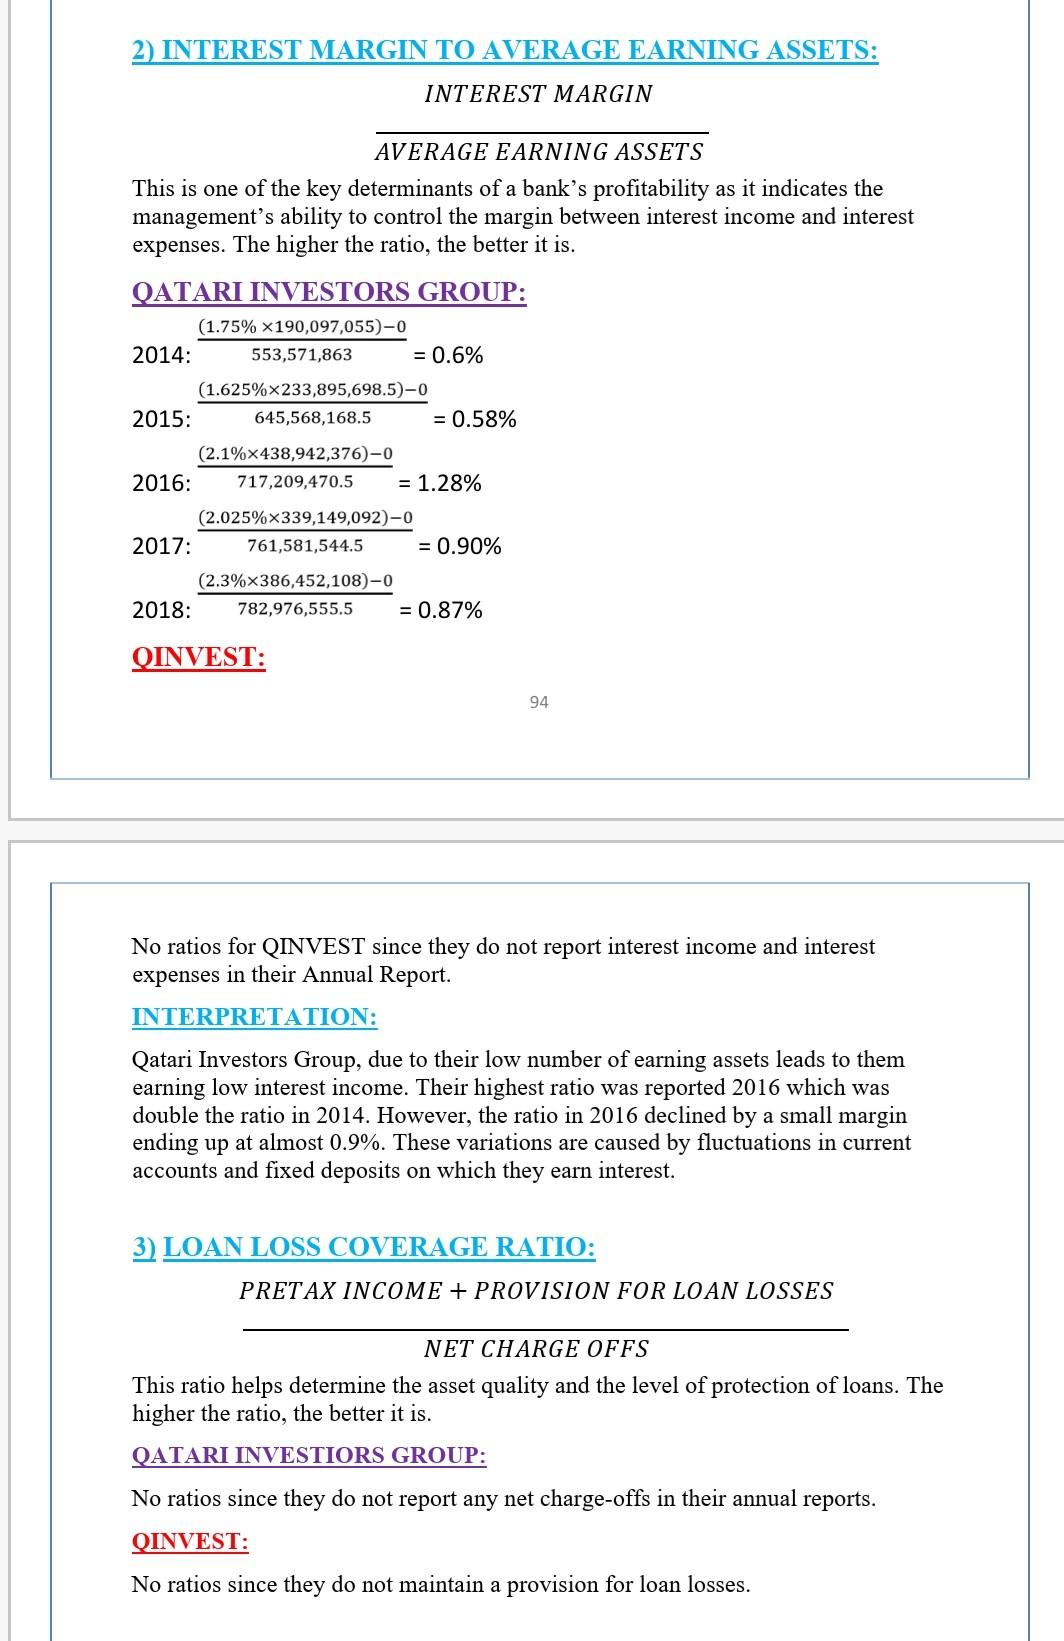
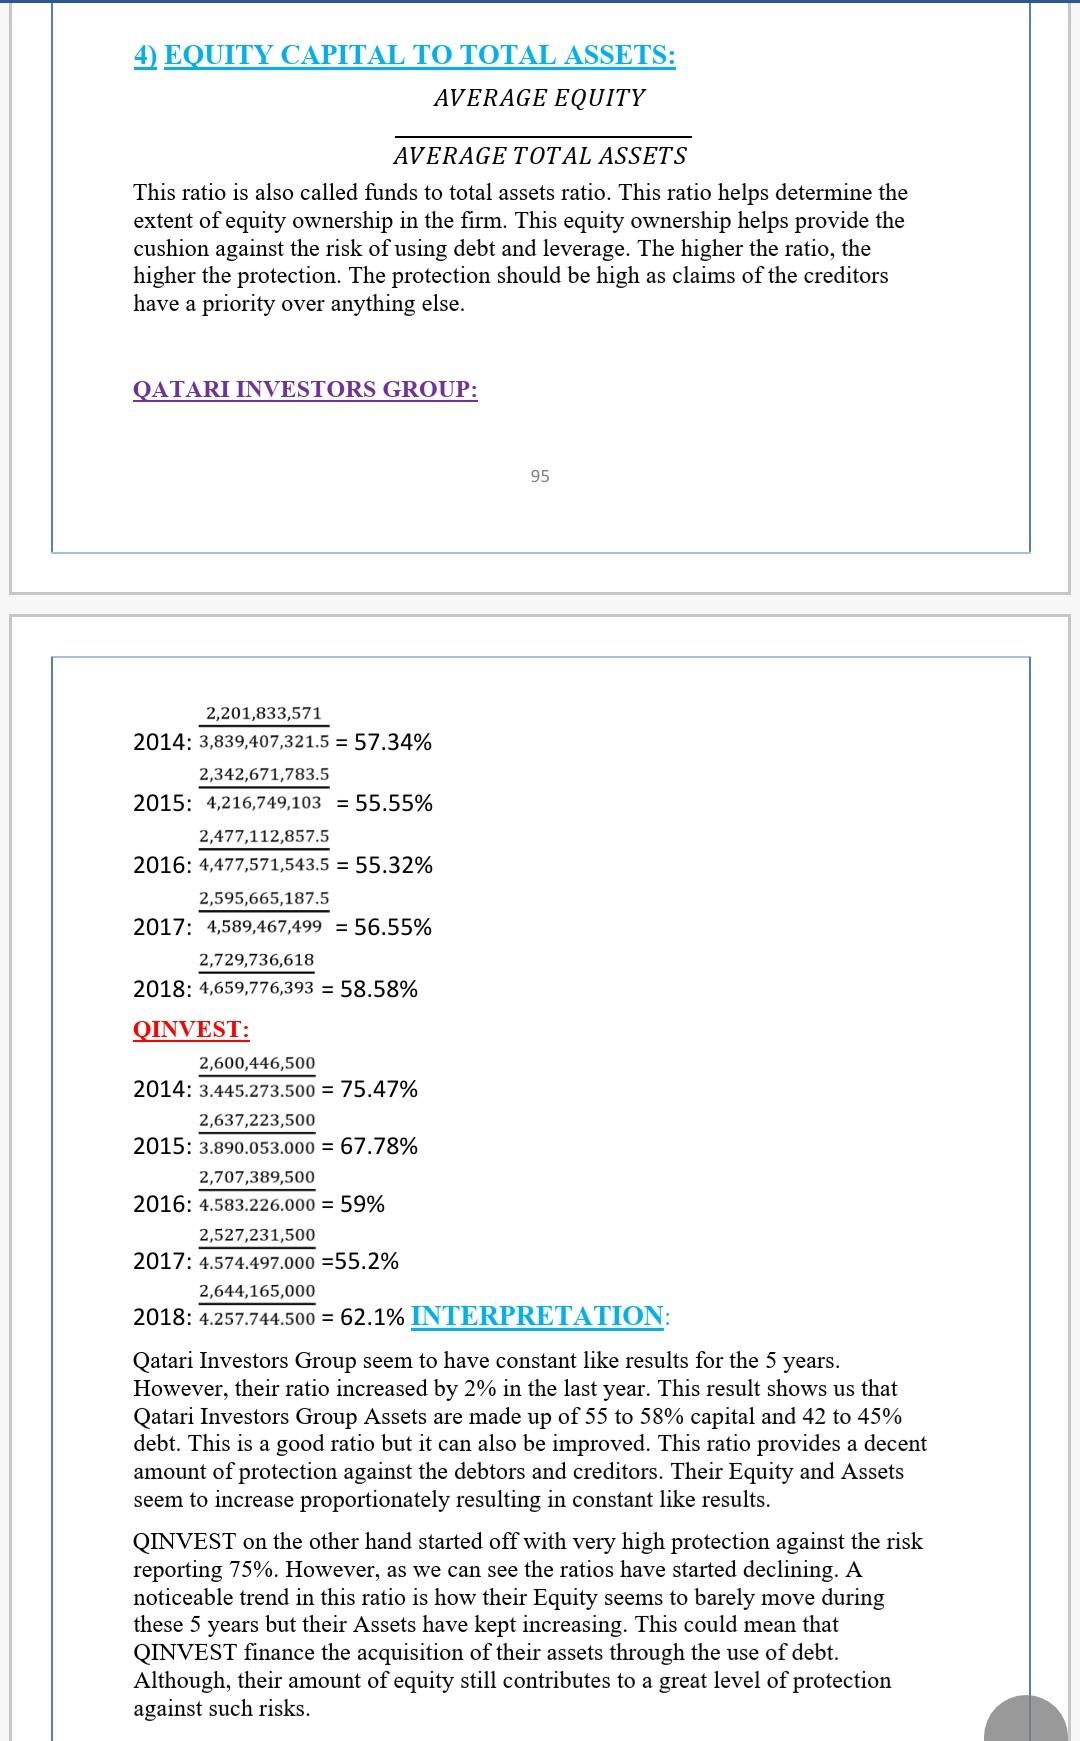
I need solution of point no 7,8,11 for investment banks(HSBC AND CITI BANK, 5 YEARS DATA) for accounting project I posted some examples of one bank I needed same for HSBC AND CITI BANK point no 7,8,11. Plzz needed urgently
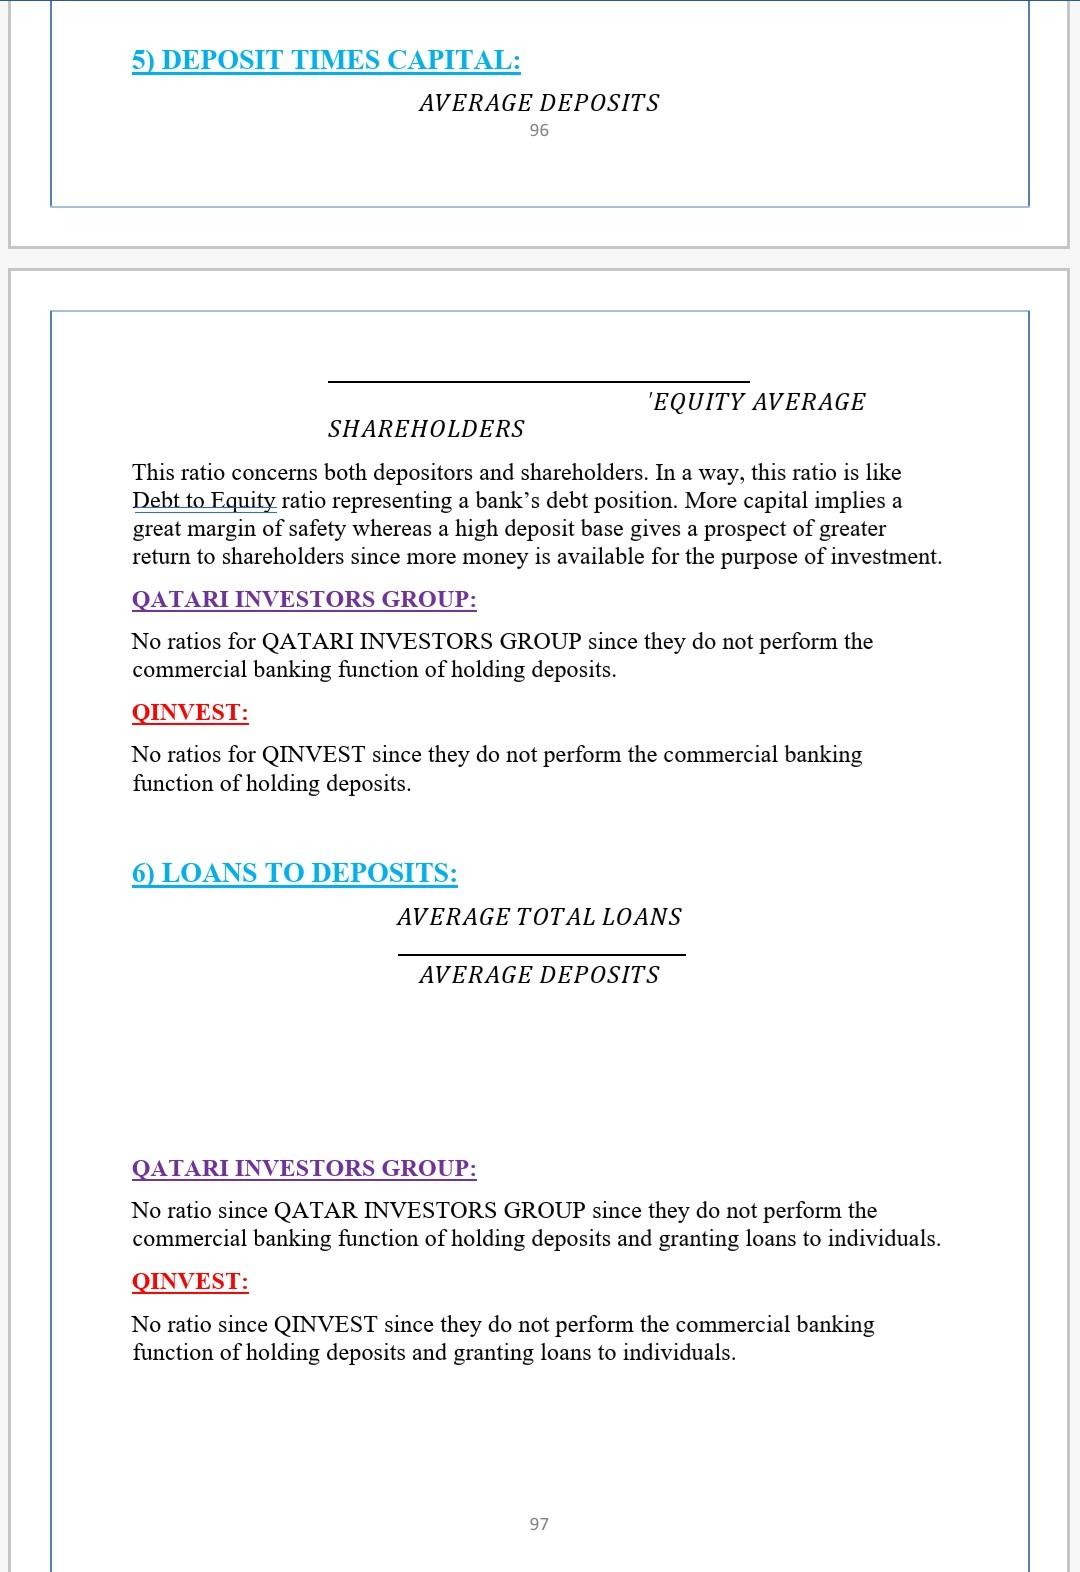
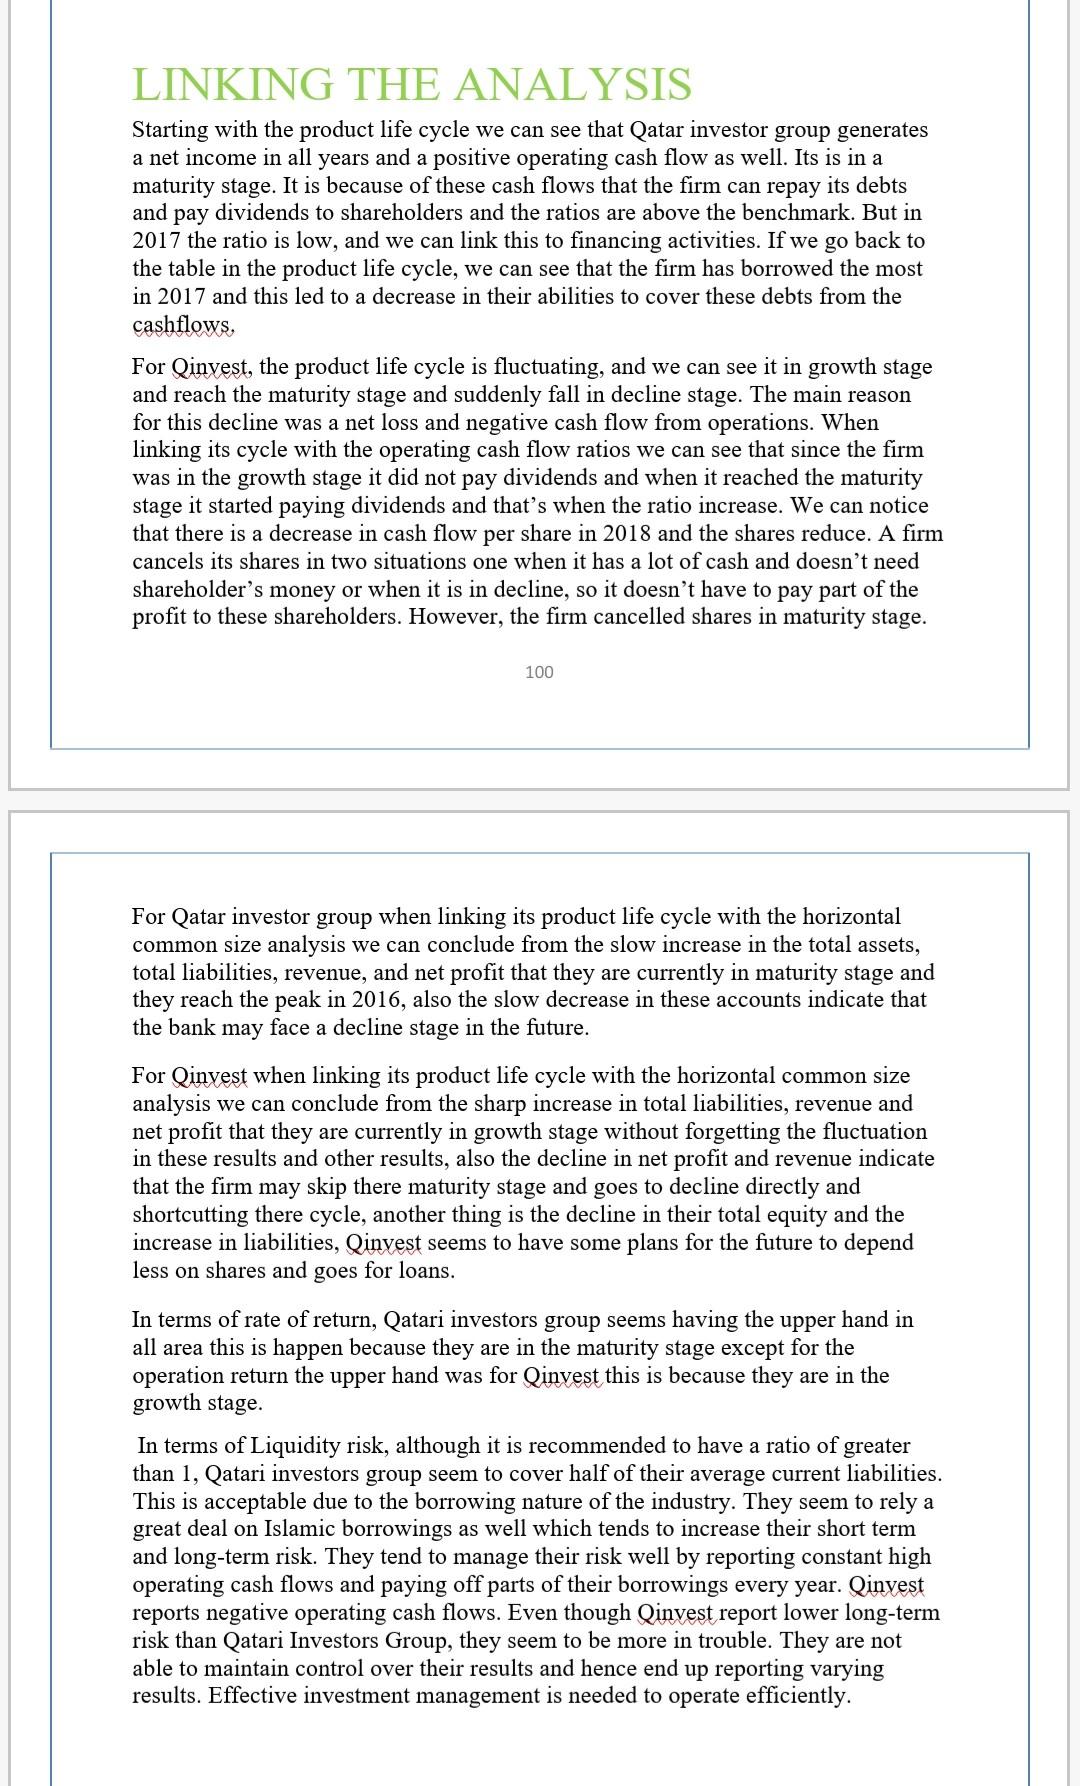
1 2 Background (strategy & Porter's five forces) Vertical & horizontal analysis Analysis of Cash Flows Statement (Stage of life cycle & 4 Ratios) 3. 4. Analysis of profitability 5. Analysis of short term liquidity 6 Analysis of long term solvency 7 Interpretation of ratios 8 Linkage among the ratios 9 Strengths and weaknesses 10 Conclusion and future estimates 11 Additional Analysis CHAPTER 12: SPECIAL INDUSTRIES There are a number of accounts in banks that are opposite than regular companies accounts such as Loans and Deposits. While calculating the Net Income for a bank, we have to make sure that the gap between Interest Income and Interest Expense is as big as possible. The larger the margin, the larger the Net Income. RATIOS FOR BANKS: 1) EARNING ASSETS TO TOTAL ASSETS: AVERAGE EARNING ASSETS AVERAGE TOTAL ASSETS Earning assets include loans, leases, investment securities and money market assets. It excludes cash and non-earning deposits plus fixed assets. This ratio shows how well the bank management puts the bank assets to work. The higher the ratio, the better. QATARI INVESTORS GROUP: 550,489,261+3,082,602 2014: 3,839,407,321.5 = 1.44% 643,228,410+2,339,758.5 2015: 4,216,749,103 = 1.53% 714,745,966+2,463,504.5 2016: 4,477,571,543.5 = 1.6% 758,829,848+2,751,696.5 2017: 4,589,467,499 = 1.65% 778,782,960.5+4,195,595 2018: 4,659,776,393 = 1.68% QINVEST: 894,131,000+975,520,000+248,901,500 2014: 3,445,273,500 = 61.5% 1,055,004,500+1,410,059,500+223,676,500+183,081,000 2015: 3,890,053,000 = 73.82% 278,445,500+1,712,609,500+1,340,050,500+177,581,000 2016: 4,,583,226,000 = 76.5% 93 1,241,679,000+1,754,307,500+376,429,000+182,782,500 2017: 4,574,497,000 = 77.7% 748,120,000+2,297,433,500+315,921,500+96,742,000 2018: 4,257,744,500 = 81.2% INTERPRETATION: Qatari Investors Group seem to have very low ratios. However, their earning assets seem to increase every year but not by a significant amount. The low ratio is mainly due to their other lines of business. This leads to them having below par ratios. QINVEST on the other hand have reported impressive ratios for these 5 years. The ratios have increased by 20% over the 5 years. Their earning assets seem to increase at a greater rate than their total assets. Their ratios have seen a great improvement from 2015 onwards mainly due to the Investment in Property Leases. This has increased their earning assets which has led to improved ratios. 4) EQUITY CAPITAL TO TOTAL ASSETS: AVERAGE EQUITY AVERAGE TOTAL ASSETS This ratio is also called funds to total assets ratio. This ratio helps determine the extent of equity ownership in the firm. This equity ownership helps provide the cushion against the risk of using debt and leverage. The higher the ratio, the higher the protection. The protection should be high as claims of the creditors have a priority over anything else. QATARI INVESTORS GROUP: 95 2,201,833,571 2014: 3,839,407,321.5 = 57.34% 2,342,671,783.5 2015: 4,216,749,103 = 55.55% 2,477,112,857.5 2016: 4,477,571,543.5 = 55.32% 2,595,665,187.5 2017: 4,589,467,499 = 56.55% 2,729,736,618 2018: 4,659,776,393 = 58.58% QINVEST: 2,600,446,500 2014: 3.445.273.500 = 75.47% 2,637,223,500 2015: 3.890.053.000 = 67.78% 2,707,389,500 2016: 4.583.226.000 = 59% 2,527,231,500 2017: 4.574.497.000 =55.2% 2,644,165,000 2018: 4.257.744.500 = 62.1% INTERPRETATION: Qatari Investors Group seem to have constant like results for the 5 years. However, their ratio increased by 2% in the last year. This result shows us that Qatari Investors Group Assets are made up of 55 to 58% capital and 42 to 45% debt. This is a good ratio but it can also be improved. This ratio provides a decent amount of protection against the debtors and creditors. Their Equity and Assets seem to increase proportionately resulting in constant like results. QINVEST on the other hand started off with very high protection against the risk reporting 75%. However, as we can see the ratios have started declining. A noticeable trend in this ratio is how their Equity seems to barely move during these 5 years but their Assets have kept increasing. This could mean that QINVEST finance the acquisition of their assets through the use of debt. Although, their amount of equity still contributes to a great level of protection against such risks. 5) DEPOSIT TIMES CAPITAL: AVERAGE DEPOSITS 96 'EQUITY AVERAGE SHAREHOLDERS This ratio concerns both depositors and shareholders. In a way, this ratio is like Debt to Equity ratio representing a bank's debt position. More capital implies a great margin of safety whereas a high deposit base gives a prospect of greater return to shareholders since more money is available for the purpose of investment. QATARI INVESTORS GROUP: No ratios for QATARI INVESTORS GROUP since they do not perform the commercial banking function of holding deposits. QINVEST: No ratios for QINVEST since they do not perform the commercial banking function of holding deposits. 6) LOANS TO DEPOSITS: AVERAGE TOTAL LOANS AVERAGE DEPOSITS QATARI INVESTORS GROUP: No ratio since QATAR INVESTORS GROUP since they do not perform the commercial banking function of holding deposits and granting loans to individuals. QINVEST: No ratio since QINVEST since they do not perform the commercial banking function of holding deposits and granting loans to individuals. 97 LINKING THE ANALYSIS Starting with the product life cycle we can see that Qatar investor group generates a net income in all years and a positive operating cash flow as well. Its is in a maturity stage. It is because of these cash flows that the firm can repay its debts and pay dividends to shareholders and the ratios are above the benchmark. But in 2017 the ratio is low, and we can link this to financing activities. If we go back to the table in the product life cycle, we can see that the firm has borrowed the most in 2017 and this led to a decrease in their abilities to cover these debts from the cashflows, For Qinvest, the product life cycle is fluctuating, and we can see it in growth stage and reach the maturity stage and suddenly fall in decline stage. The main reason for this decline was a net loss and negative cash flow from operations. When linking its cycle with the operating cash flow ratios we can see that since the firm was in the growth stage it did not pay dividends and when it reached the maturity stage it started paying dividends and that's when the ratio increase. We can notice that there is a decrease in cash flow per share in 2018 and the shares reduce. A firm cancels its shares in two situations one when it has a lot of cash and doesn't need shareholder's money or when it is in decline, so it doesn't have to pay part the profit to these shareholders. However, the firm cancelled shares in maturity stage. 100 For Qatar investor group when linking its product life cycle with the horizontal common size analysis we can conclude from the slow increase in the total assets, total liabilities, revenue, and net profit that they are currently in maturity stage and they reach the peak in 2016, also the slow decrease in these accounts indicate that the bank may face a decline stage in the future. For Qinvest when linking its product life cycle with the horizontal common size analysis we can conclude from the sharp increase in total liabilities, revenue and net profit that they are currently in growth stage without forgetting the fluctuation in these results and other results, also the decline in net profit and revenue indicate that the firm may skip there maturity stage and goes to decline directly and shortcutting there cycle, another thing is the decline in their total equity and the increase in liabilities, Qinvest seems to have some plans for the future to depend less on shares and goes for loans. In terms of rate of return, Qatari investors group seems having the upper hand in all area this is happen because they are in the maturity stage except for the operation return the upper hand was for Qinvest this is because they are in the growth stage. In terms of Liquidity risk, although it is recommended to have a ratio of greater than 1, Qatari investors group seem to cover half of their average current liabilities. This is acceptable due to the borrowing nature of the industry. They seem to rely a great deal on Islamic borrowings as well which tends to increase their short term and long-term risk. They tend to manage their risk well by reporting constant high operating cash flows and paying off parts of their borrowings every year. Qinvest reports negative operating cash flows. Even though Qinvest report lower long-term risk than Qatari Investors Group, they seem to be more in trouble. They are not able to maintain control over their results and hence end up reporting varying results. Effective investment management is needed to efficientlyStep by Step Solution
There are 3 Steps involved in it
Step: 1

Get Instant Access to Expert-Tailored Solutions
See step-by-step solutions with expert insights and AI powered tools for academic success
Step: 2

Step: 3

Ace Your Homework with AI
Get the answers you need in no time with our AI-driven, step-by-step assistance
Get Started


