I need some help with these
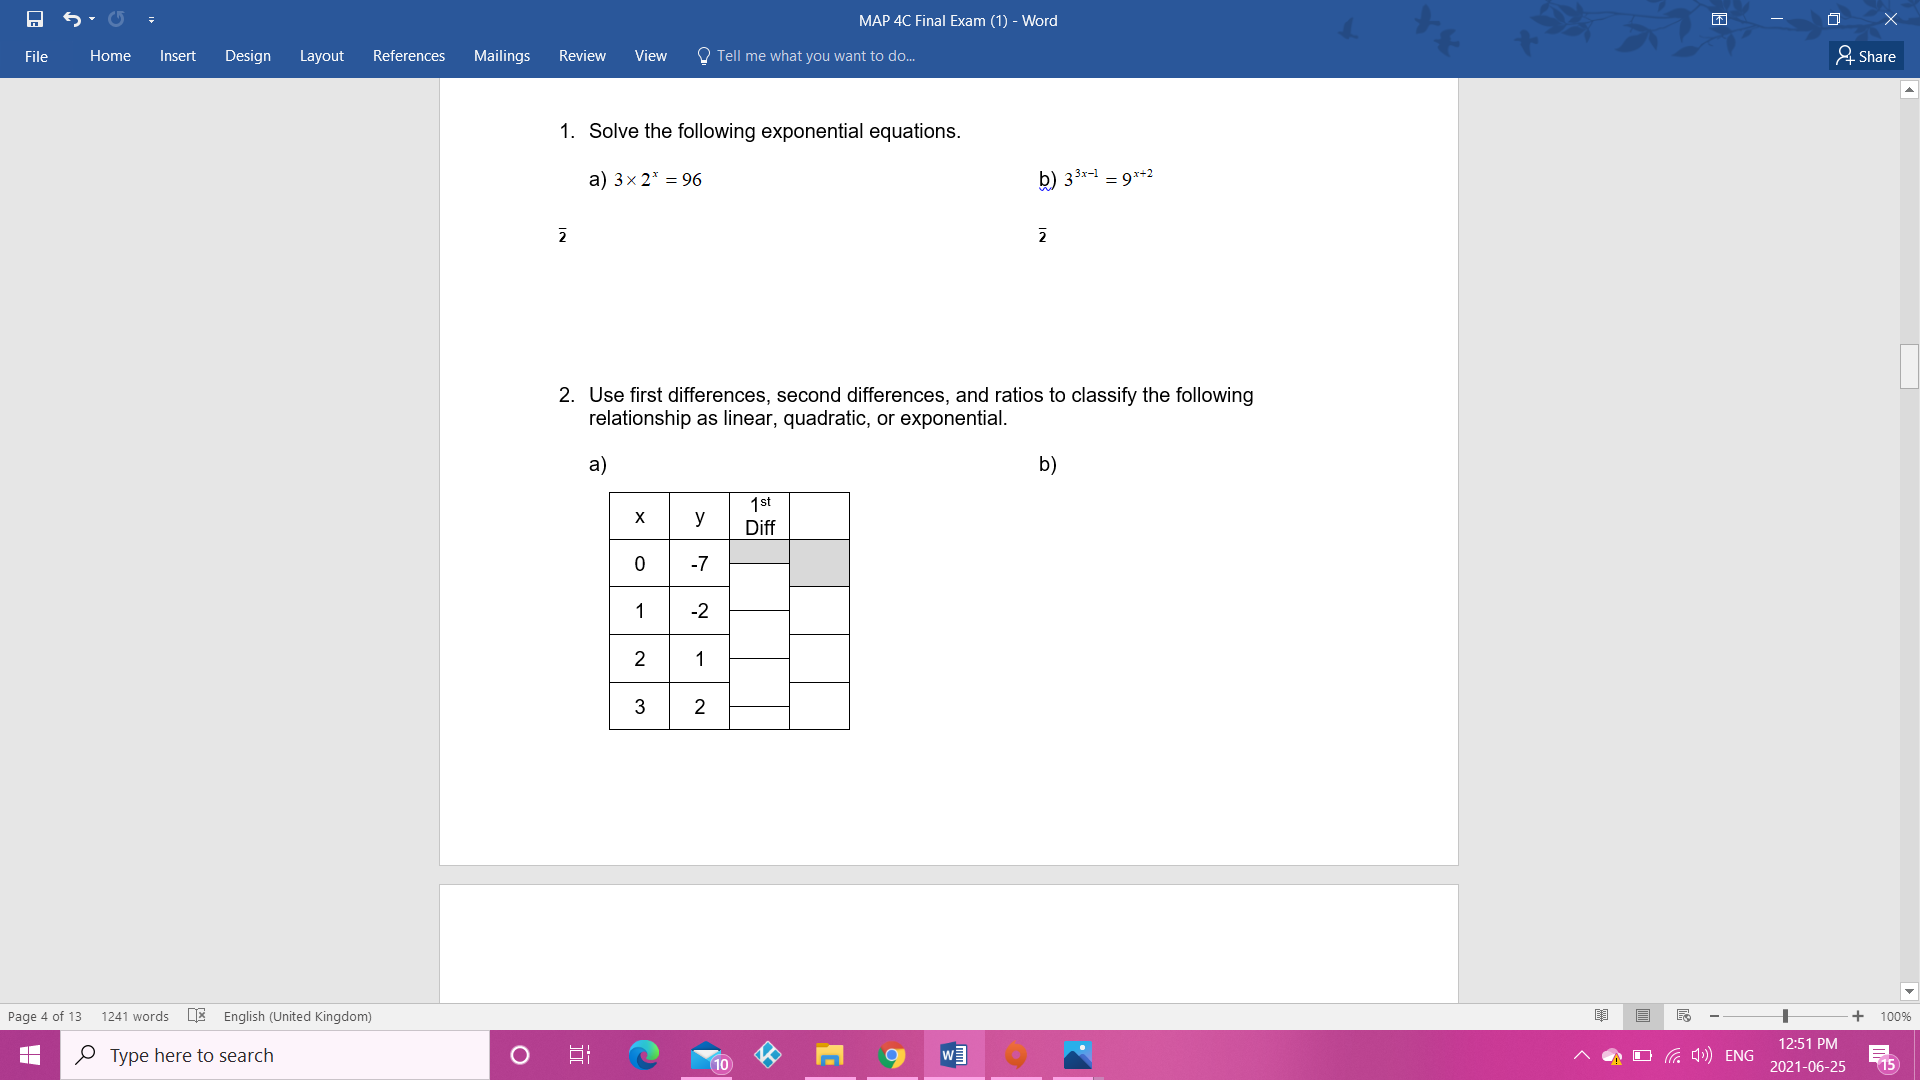
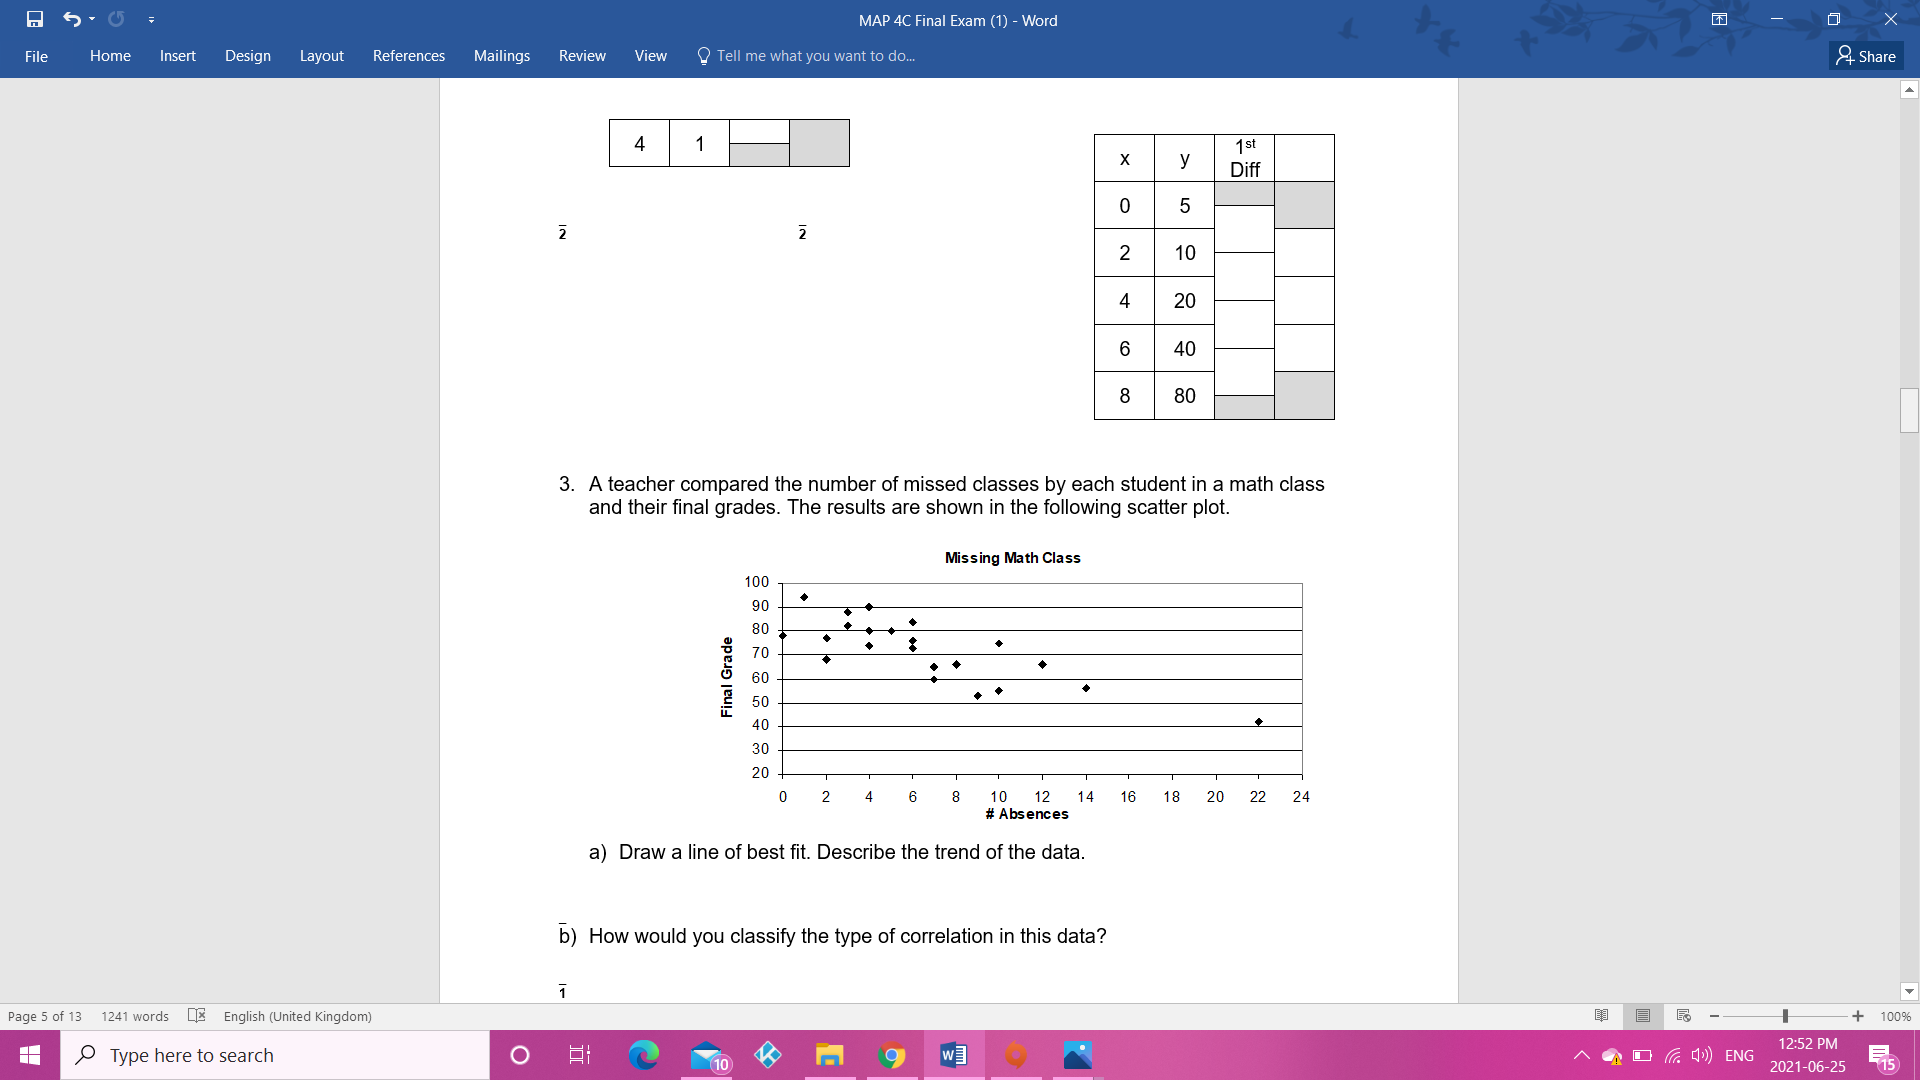
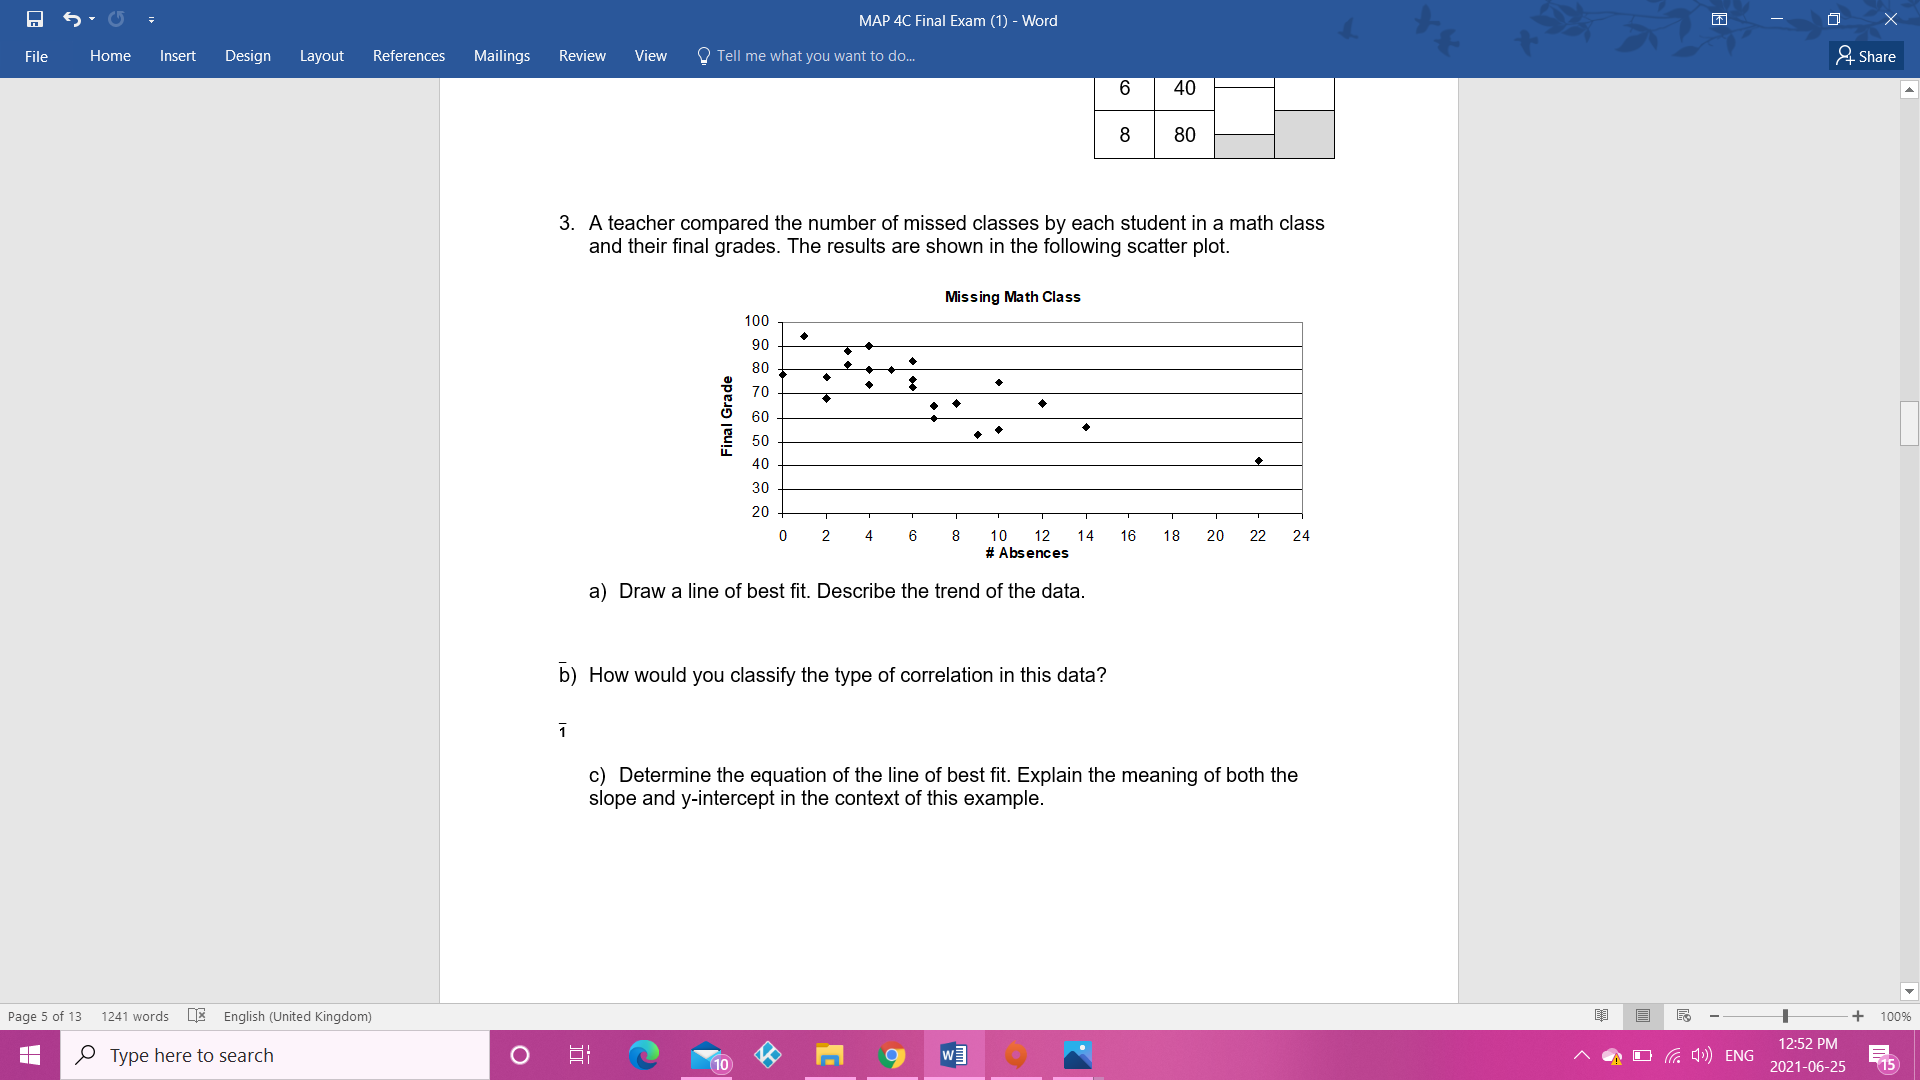
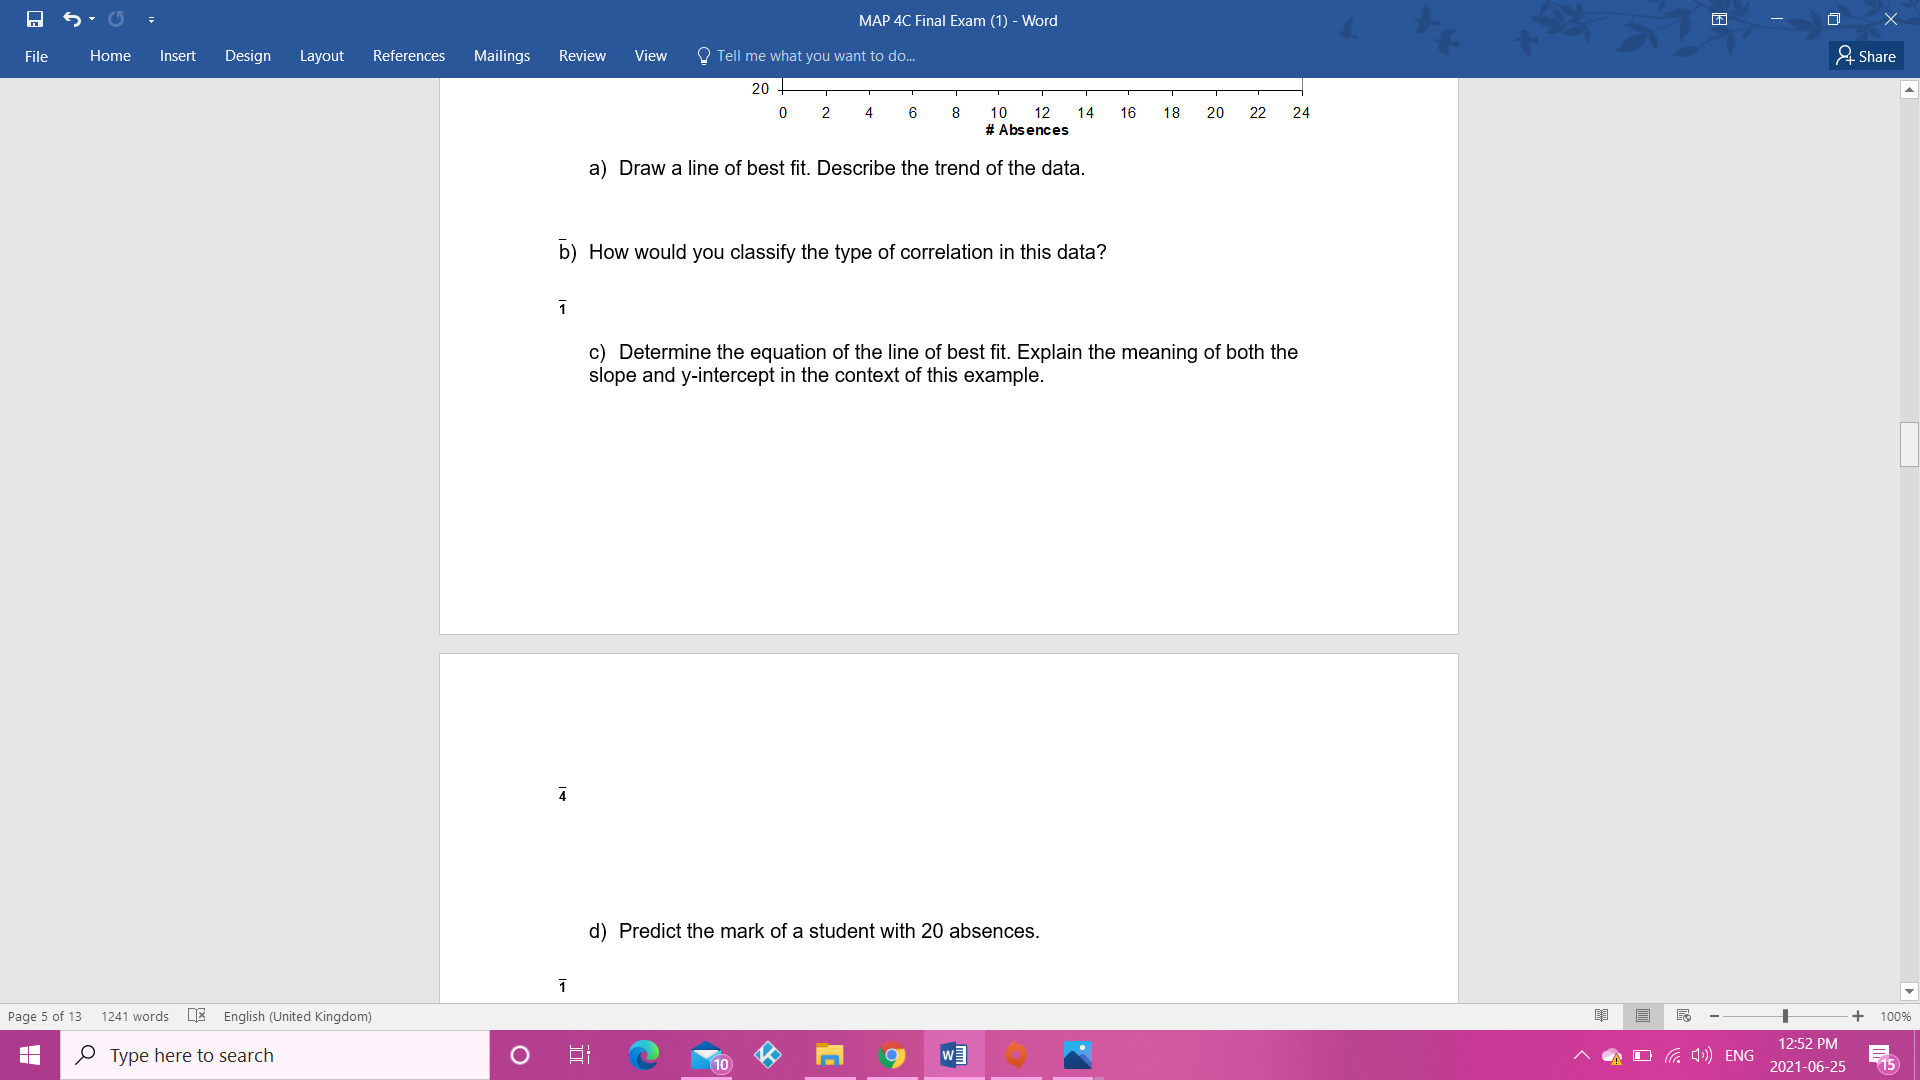
MAP 4C Final Exam (1) - Word File Home Insert Design Layout References Mailings Review View Tell me what you want to do. Share 1. Solve the following exponential equations. a) 3x 2* = 96 b) 3 3x-1 = 93+2 NI NI 2. Use first differences, second differences, and ratios to classify the following relationship as linear, quadratic, or exponential. a ) b ) 1 st X y Dif O -7 1 -2 2 3 Page 4 of 13 1241 words * English (United Kingdom) + 100% Type here to search 12:51 PM 10 m 9 ~ D ( 1) ENG 2021-06-25 15MAP 4C Final Exam (1) - Word File Home Insert Design Layout References Mailings Review View Tell me what you want to do.. Share 4 1 st X V Diff 5 NI 2 10 20 6 40 8 80 3. A teacher compared the number of missed classes by each student in a math class and their final grades. The results are shown in the following scatter plot. Missing Math Class 100 18898 Final Grade 50 30 20 2 8 10 12 14 16 18 20 22 24 # Absences a) Draw a line of best fit. Describe the trend of the data. b) How would you classify the type of correlation in this data? 1 Page 5 of 13 1241 words * English (United Kingdom) + 100% Type here to search WE 12:52 PM 10 ~ D ( 1) ENG 2021-06-25 15MAP 4C Final Exam (1) - Word File Home Insert Design Layout References Mailings Review View Tell me what you want to do. Share 6 40 8 80 3. A teacher compared the number of missed classes by each student in a math class and their final grades. The results are shown in the following scatter plot. Missing Math Class Final Grade 0 2 4 6 8 10 12 14 16 18 20 22 24 # Absences a) Draw a line of best fit. Describe the trend of the data. b) How would you classify the type of correlation in this data? c) Determine the equation of the line of best fit. Explain the meaning of both the slope and y-intercept in the context of this example. Page 5 of 13 1241 words * English (United Kingdom) + 100% Type here to search 10 m 9 12:52 PM ~ D ( 1) ENG 2021-06-25 15MAP 4C Final Exam (1) - Word File Home Insert Design Layout References Mailings Review View Tell me what you want to do.. Share 20 2 6 8 10 12 14 16 18 20 22 24 # Absences a) Draw a line of best fit. Describe the trend of the data. b) How would you classify the type of correlation in this data? c) Determine the equation of the line of best fit. Explain the meaning of both the slope and y-intercept in the context of this example. Al d) Predict the mark of a student with 20 absences. Page 5 of 13 1241 words * English (United Kingdom) + 100% Type here to search O i EM 12:52 PM 10 ~ D ( 1) ENG 2021-06-25 15