

Answered step by step
Verified Expert Solution
Question
1 Approved Answer
I need some help with this! - To use spectrophotometers Introduction When white light passes through a prism, a rainbow appears sbowing the spectrum of
I need some help with this! 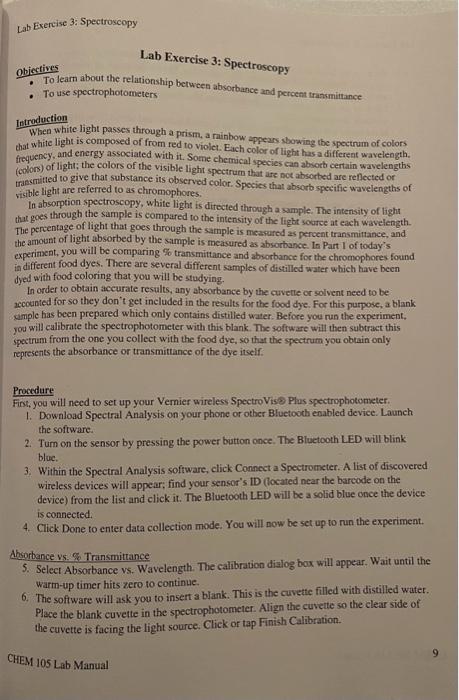

- To use spectrophotometers Introduction When white light passes through a prism, a rainbow appears sbowing the spectrum of colors that white light is composed of from red to violet. Each color of light has a different wavelength. frequency, and energy associated with it. Some chemical species can absoct certain wavelengths (colors) of light; the colors of the visible light spectrum that are not absorbed are reflected or transmitted to give that substance its observed color. Species that absorb specific wavelengths of visible light are referred to as chromophores. In absomption spectroscopy, white light is directed through a sample. The intensity of light that goes through the sample is compared to the intensity of the ligbt soaree at each wavelength. The pertentage of light that goes through the sample is mearured as pervent transmintance, and the amount of light absorbed by the sample is measured as absorbance. In Part I of today's experiment, you will be comparing % transmittance and absorbance for the chromophores found in different food dyes. There are several different samples of distilled water which have been dyed with food coloring that you will be studying. In order to obtain accurate results, any abserbance by the cuvetle or solvent need to be: accoanted for so they don't get included in the results for the food dye. For this purpose, a blank cample tas been prepared which only contains distilled water. Before you nun the experiment, yod will culibrate the spectrophotometer with this blank. The sofrware will then subtract this spectrum from the one you collect with the food dye, so that the spectrum you obtain only represents the absorbance or transmittance of the dye itself. Procedure First, you will need to set up your Vernier wireless SpectroViso Plas spectrophotometer. 1. Download Spectral Analysis on your phone or other Bluctooth eaabled device. Launch the software. 2. Tum on the sensor by pressing the power button once. The Bluetooth LED will blink bluc. 3. Within the Spectral Analysis software, click Connect a Spectrometer. A list of discovered wireless devices will appear; find your sensor's ID (located near the barcode on the device) from the list and click it. The Bluetooth LED will be a solid blue once the device is connected. 4. Click Done to enter data collection mode. You will now be set up to run the experiment. Ahsorbance vs. Se Transmittance 5. Select Absorbance vs. Wavelength. The calibration dialog box will appear. Wait until the warm-up timer hits zero to continue. 6. The software will ask you to insert a blank. This is the cuvette filled with distilled water. Place the blank cuvette in the spectrophotometer. Align the cuvette so the clear side of the cuvette is facing the light source. Click or tap Finish Calibration. Datn Sheet for Lab 3 Name: Data Sheet for Lab 3 Date: Partner Name(s): Part 1: Data Blue.sample mas= Absorbance vs, wavelength \% Transmittance vs. wavelength Red sample max= Absorbance v5, wavelength \% Transmittance vs, wavelength: Absorbance vs. Wavelength \% Transmittance vs. wavelength Analysis 1. Draw the x-axis (wavelength) below. Label the colors of visible light to the wavelength they correspond to. Name: 2. For the blue sample, what wavelength(s) of light have a high \% transmittance? What wavelength(s) have a low \% transmitlance? What colors do these wavelengths correspond to? 3. Compare the absorbance spectrum to the % transmittance spectrum for the blue sample. At wavelengths that have a high % transmittance, describe the absorbance. At wavelengths that have a low \% transmittance, describe the absorbance. Explain what this tells you about how the sample interacts with white light. 4. Compare the graphs and max values for the blue, red, and yellow samples. Are they the same or different? What can you say about the color of a solution compared to the wavelengths of visible light it absorbs and transmits? 5. Compare the graphs and max values for the green sample to the blue and yellow samples. What can you speculate about the composition of the green sample? - To use spectrophotometers Introduction When white light passes through a prism, a rainbow appears sbowing the spectrum of colors that white light is composed of from red to violet. Each color of light has a different wavelength. frequency, and energy associated with it. Some chemical species can absoct certain wavelengths (colors) of light; the colors of the visible light spectrum that are not absorbed are reflected or transmitted to give that substance its observed color. Species that absorb specific wavelengths of visible light are referred to as chromophores. In absomption spectroscopy, white light is directed through a sample. The intensity of light that goes through the sample is compared to the intensity of the ligbt soaree at each wavelength. The pertentage of light that goes through the sample is mearured as pervent transmintance, and the amount of light absorbed by the sample is measured as absorbance. In Part I of today's experiment, you will be comparing % transmittance and absorbance for the chromophores found in different food dyes. There are several different samples of distilled water which have been dyed with food coloring that you will be studying. In order to obtain accurate results, any abserbance by the cuvetle or solvent need to be: accoanted for so they don't get included in the results for the food dye. For this purpose, a blank cample tas been prepared which only contains distilled water. Before you nun the experiment, yod will culibrate the spectrophotometer with this blank. The sofrware will then subtract this spectrum from the one you collect with the food dye, so that the spectrum you obtain only represents the absorbance or transmittance of the dye itself. Procedure First, you will need to set up your Vernier wireless SpectroViso Plas spectrophotometer. 1. Download Spectral Analysis on your phone or other Bluctooth eaabled device. Launch the software. 2. Tum on the sensor by pressing the power button once. The Bluetooth LED will blink bluc. 3. Within the Spectral Analysis software, click Connect a Spectrometer. A list of discovered wireless devices will appear; find your sensor's ID (located near the barcode on the device) from the list and click it. The Bluetooth LED will be a solid blue once the device is connected. 4. Click Done to enter data collection mode. You will now be set up to run the experiment. Ahsorbance vs. Se Transmittance 5. Select Absorbance vs. Wavelength. The calibration dialog box will appear. Wait until the warm-up timer hits zero to continue. 6. The software will ask you to insert a blank. This is the cuvette filled with distilled water. Place the blank cuvette in the spectrophotometer. Align the cuvette so the clear side of the cuvette is facing the light source. Click or tap Finish Calibration. Datn Sheet for Lab 3 Name: Data Sheet for Lab 3 Date: Partner Name(s): Part 1: Data Blue.sample mas= Absorbance vs, wavelength \% Transmittance vs. wavelength Red sample max= Absorbance v5, wavelength \% Transmittance vs, wavelength: Absorbance vs. Wavelength \% Transmittance vs. wavelength Analysis 1. Draw the x-axis (wavelength) below. Label the colors of visible light to the wavelength they correspond to. Name: 2. For the blue sample, what wavelength(s) of light have a high \% transmittance? What wavelength(s) have a low \% transmitlance? What colors do these wavelengths correspond to? 3. Compare the absorbance spectrum to the % transmittance spectrum for the blue sample. At wavelengths that have a high % transmittance, describe the absorbance. At wavelengths that have a low \% transmittance, describe the absorbance. Explain what this tells you about how the sample interacts with white light. 4. Compare the graphs and max values for the blue, red, and yellow samples. Are they the same or different? What can you say about the color of a solution compared to the wavelengths of visible light it absorbs and transmits? 5. Compare the graphs and max values for the green sample to the blue and yellow samples. What can you speculate about the composition of the green sample Step by Step Solution
There are 3 Steps involved in it
Step: 1

Get Instant Access to Expert-Tailored Solutions
See step-by-step solutions with expert insights and AI powered tools for academic success
Step: 2

Step: 3
Ace Your Homework with AI
Get the answers you need in no time with our AI-driven, step-by-step assistance
Get Started
Organic Chemistry
Authors: Joseph M. Hornback
2nd Edition
9781133384847, 9780199270293, 534389511, 1133384846, 978-0534389512