I need the answers to cslculate the ratios not just only the formulss pls ..i need this step by step to calculate the gross profit ..workiing capital..current ratio...quick ratio 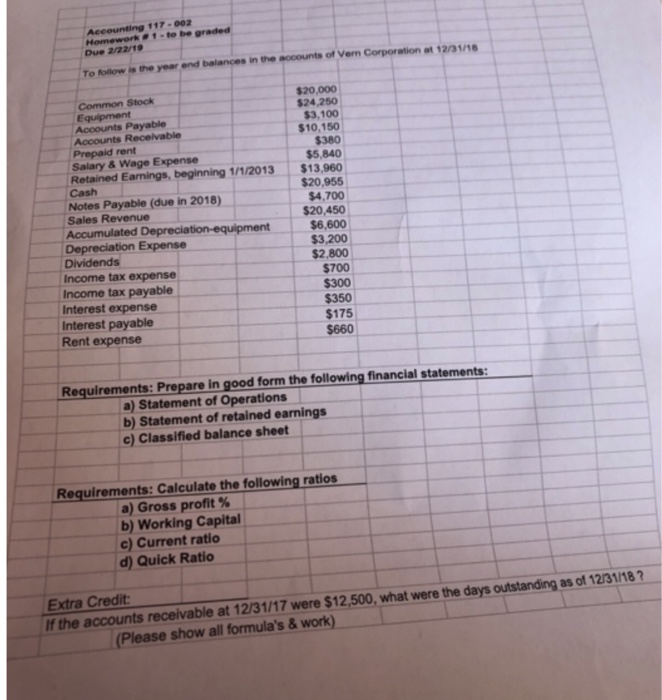
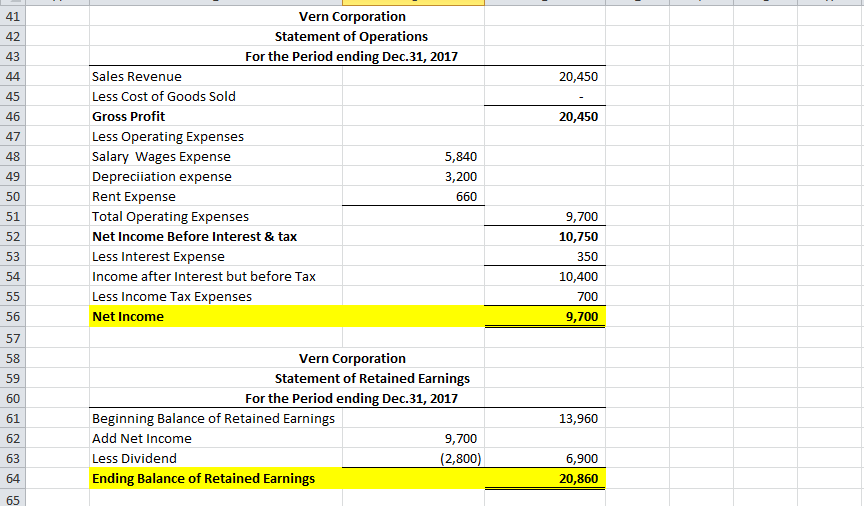
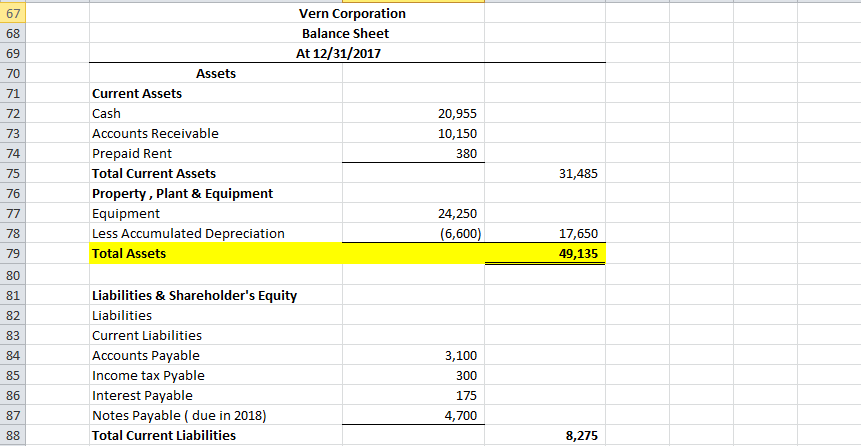
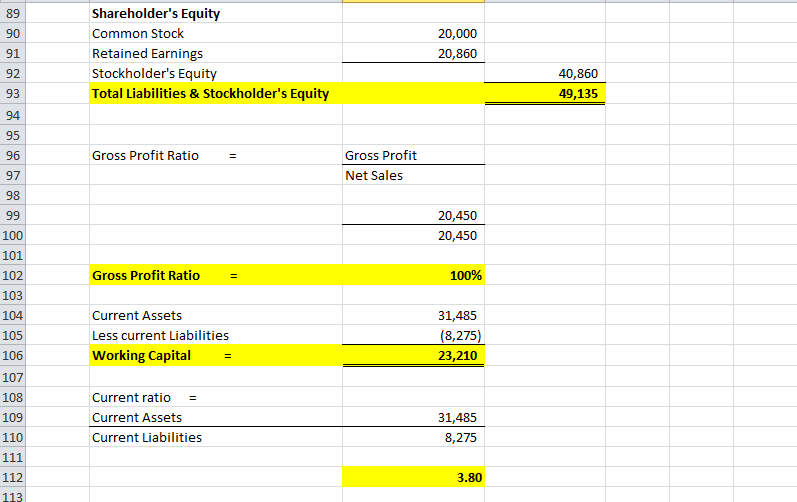
41 42 43 Vern Corporation Statement of Operations For the Period ending Dec.31, 2017 Sales Revenue Less Cost of Goods Sold Gross Profit Less Operating Expenses Salary Wages Expense Depreciiation expense Rent Expense Total Operating Expenses Net Income Before Interest & tax Less Interest Expense Income after Interest but before Tax Less Income Tax Expenses Net Income 20,450 45 20,450 47 48 49 50 51 52 53 54 5,840 3,200 660 9,700 10,750 350 10,400 700 9,700 56 57 58 59 Vern Corporation Statement of Retained Earnings For the Period ending Dec.31, 2017 61 62 63 64 Beginning Balance of Retained Earnings Add Net Income Less Dividend Ending Balance of Retained Earnings 13,960 9,700 (2,800) 6,900 20,860 Vern Corporation Balance Sheet At 12/31/2017 69 70 71 72 73 74 75 76 Assets Current Assets Cash Accounts Receivable Prepaid Rent Total Current Assets Property, Plant & Equipment Equipment Less Accumulated Depreciation Total Assets 20,955 10,150 380 31,485 24,250 (6,600) 17,650 49,135 79 81 82 83 84 85 86 87 Liabilities & Shareholder's Equity Liabilities Current Liabilities Accounts Payable Income tax Pyable Interest Payable Notes Payable ( due in 2018) Total Current Liabilities 3,100 175 4,700 8,275 Shareholder's Equity Common Stock Retained Earnings Stockholder's Equity Total Liabilities & Stockholder's Equity 89 90 91 92 93 94 95 96 97 98 20,000 20,860 40,860 49,135 Gross Profit Ratio - Gross Profit Net Sales 20,450 20,450 100 101 102 103 104 105 106 107 108 109 110 Gross Profit Ratio - 100% Current Assets Less current Liabilities Working Capital- 31,485 (8,275) 23,210 Current ratio - Current Assets Current Liabilities 31,485 8,275 112 3.80 41 42 43 Vern Corporation Statement of Operations For the Period ending Dec.31, 2017 Sales Revenue Less Cost of Goods Sold Gross Profit Less Operating Expenses Salary Wages Expense Depreciiation expense Rent Expense Total Operating Expenses Net Income Before Interest & tax Less Interest Expense Income after Interest but before Tax Less Income Tax Expenses Net Income 20,450 45 20,450 47 48 49 50 51 52 53 54 5,840 3,200 660 9,700 10,750 350 10,400 700 9,700 56 57 58 59 Vern Corporation Statement of Retained Earnings For the Period ending Dec.31, 2017 61 62 63 64 Beginning Balance of Retained Earnings Add Net Income Less Dividend Ending Balance of Retained Earnings 13,960 9,700 (2,800) 6,900 20,860 Vern Corporation Balance Sheet At 12/31/2017 69 70 71 72 73 74 75 76 Assets Current Assets Cash Accounts Receivable Prepaid Rent Total Current Assets Property, Plant & Equipment Equipment Less Accumulated Depreciation Total Assets 20,955 10,150 380 31,485 24,250 (6,600) 17,650 49,135 79 81 82 83 84 85 86 87 Liabilities & Shareholder's Equity Liabilities Current Liabilities Accounts Payable Income tax Pyable Interest Payable Notes Payable ( due in 2018) Total Current Liabilities 3,100 175 4,700 8,275 Shareholder's Equity Common Stock Retained Earnings Stockholder's Equity Total Liabilities & Stockholder's Equity 89 90 91 92 93 94 95 96 97 98 20,000 20,860 40,860 49,135 Gross Profit Ratio - Gross Profit Net Sales 20,450 20,450 100 101 102 103 104 105 106 107 108 109 110 Gross Profit Ratio - 100% Current Assets Less current Liabilities Working Capital- 31,485 (8,275) 23,210 Current ratio - Current Assets Current Liabilities 31,485 8,275 112 3.80


