Answered step by step
Verified Expert Solution
Question
1 Approved Answer
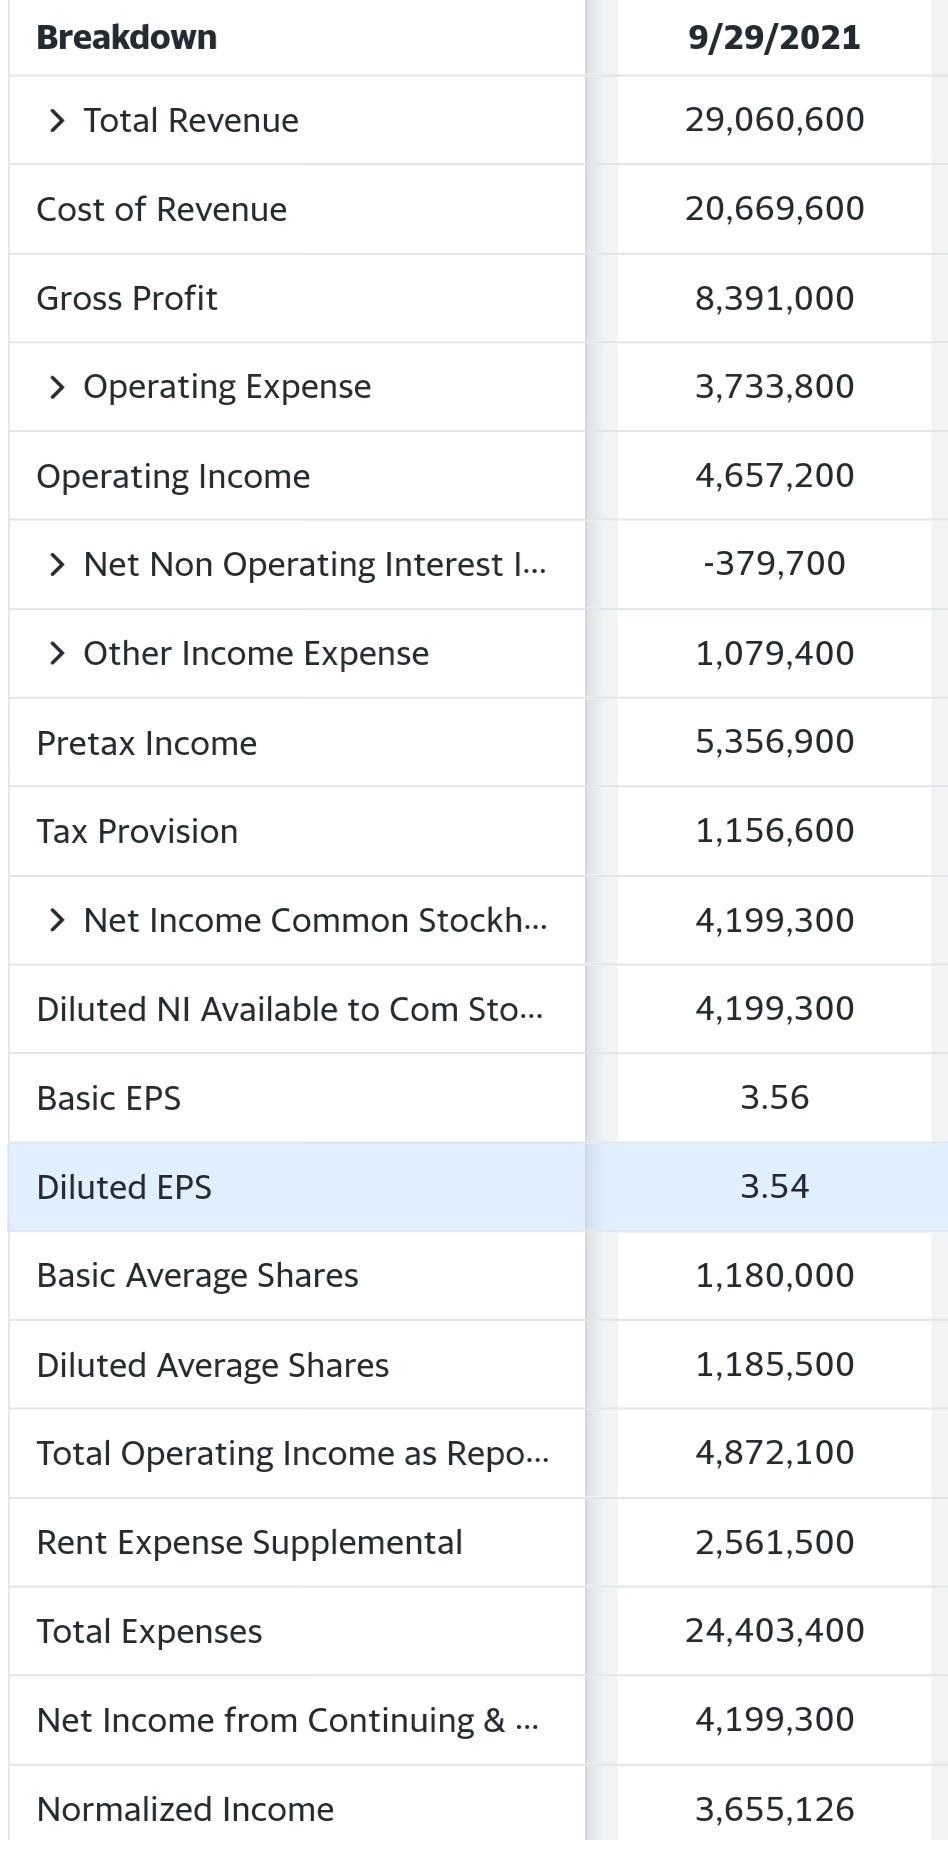
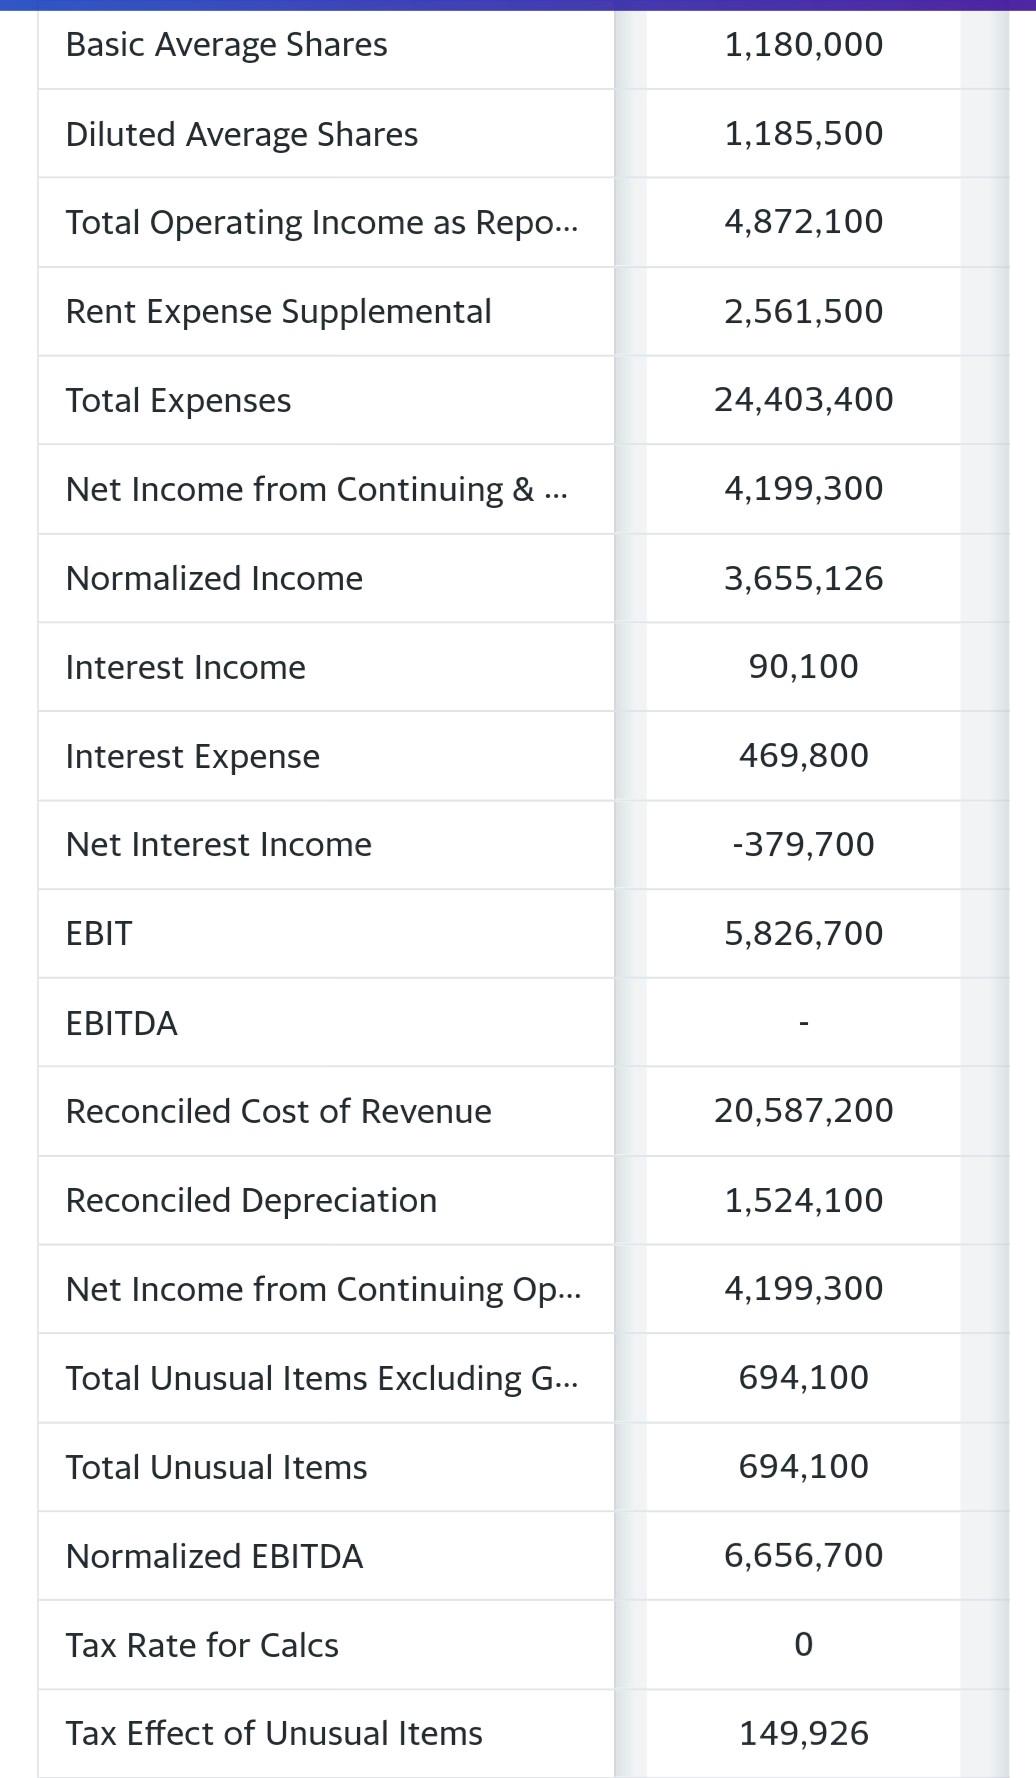
I need the income statement for year 2022 for starbucks corporation the company is starbucks corporation Breakdown 9/29/2021 > Total Revenue 29,060,600 Cost of Revenue


I need the income statement for year 2022 for starbucks corporation

the company is starbucks corporation
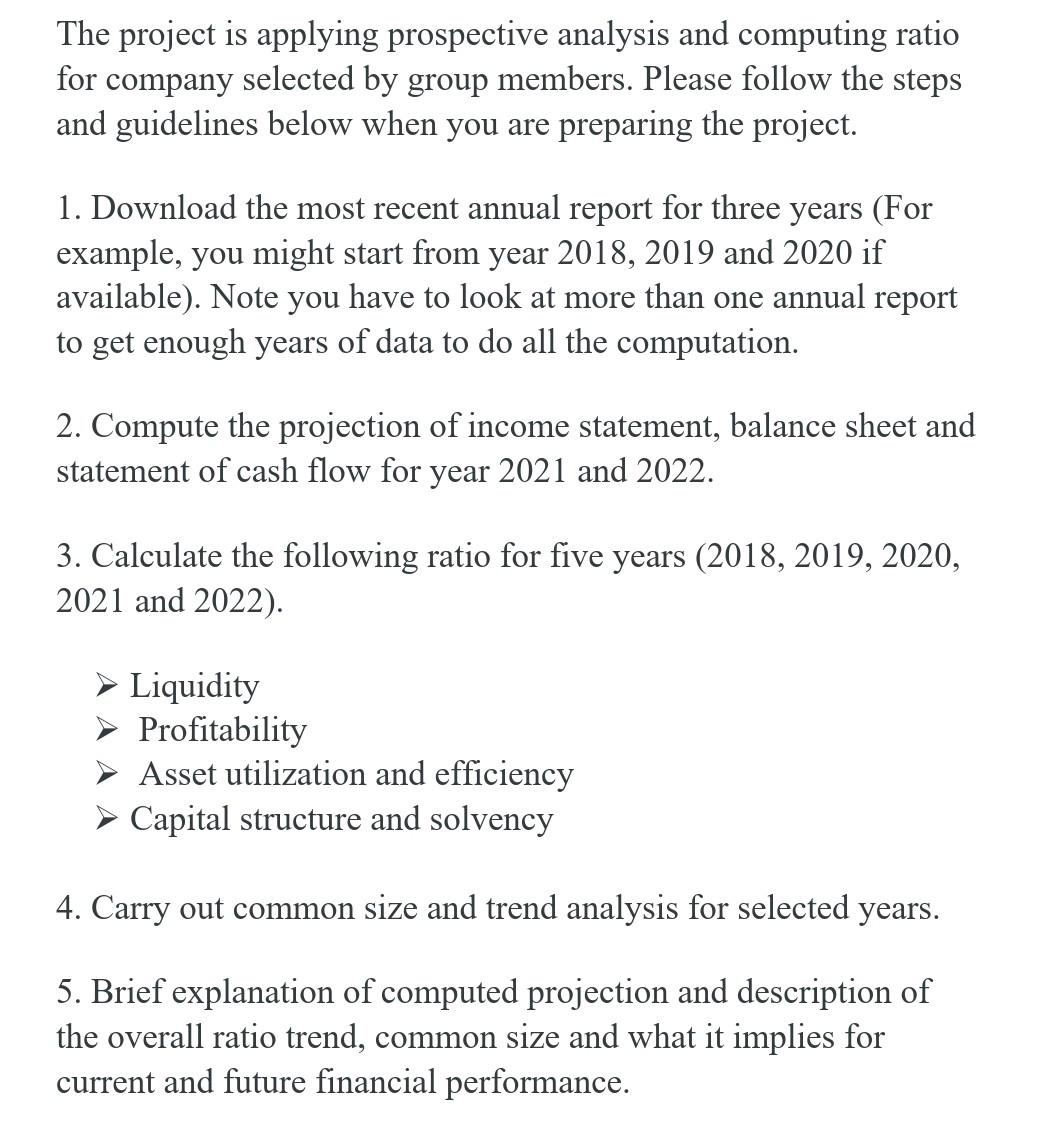
Breakdown 9/29/2021 > Total Revenue 29,060,600 Cost of Revenue 20,669,600 Gross Profit 8,391,000 > Operating Expense 3,733,800 Operating Income 4,657,200 > Net Non Operating Interest ... -379,700 > Other Income Expense 1,079,400 Pretax Income 5,356,900 Tax Provision 1,156,600 > Net Income Common Stockh... 4,199,300 Diluted NI Available to Com Sto... 4,199,300 Basic EPS 3.56 Diluted EPS 3.54 Basic Average Shares 1,180,000 Diluted Average Shares 1,185,500 Total Operating Income as Repo... 4,872,100 Rent Expense Supplemental 2,561,500 Total Expenses 24,403,400 Net Income from Continuing & ... 4,199,300 Normalized Income 3,655,126 Basic Average Shares 1,180,000 Diluted Average Shares 1,185,500 Total Operating Income as Repo... 4,872,100 Rent Expense Supplemental 2,561,500 Total Expenses 24,403,400 Net Income from Continuing & ... 4,199,300 Normalized Income 3,655,126 Interest Income 90,100 Interest Expense 469,800 Net Interest Income -379,700 EBIT 5,826,700 EBITDA Reconciled Cost of Revenue 20,587,200 Reconciled Depreciation 1,524,100 Net Income from Continuing Op... 4,199,300 Total Unusual Items Excluding G... 694,100 Total Unusual Items 694,100 Normalized EBITDA 6,656,700 Tax Rate for Calcs 0 Tax Effect of Unusual Items 149,926 The project is applying prospective analysis and computing ratio for company selected by group members. Please follow the steps and guidelines below when you are preparing the project. 1. Download the most recent annual report for three years (For example, you might start from year 2018, 2019 and 2020 if available). Note you have to look at more than one annual report to get enough years of data to do all the computation. 2. Compute the projection of income statement, balance sheet and statement of cash flow for year 2021 and 2022. 3. Calculate the following ratio for five years (2018, 2019, 2020, 2021 and 2022). Liquidity Profitability > Asset utilization and efficiency Capital structure and solvency 4. Carry out common size and trend analysis for selected years. 5. Brief explanation of computed projection and description of the overall ratio trend, common size and what it implies for current and future financial performance. Breakdown 9/29/2021 > Total Revenue 29,060,600 Cost of Revenue 20,669,600 Gross Profit 8,391,000 > Operating Expense 3,733,800 Operating Income 4,657,200 > Net Non Operating Interest ... -379,700 > Other Income Expense 1,079,400 Pretax Income 5,356,900 Tax Provision 1,156,600 > Net Income Common Stockh... 4,199,300 Diluted NI Available to Com Sto... 4,199,300 Basic EPS 3.56 Diluted EPS 3.54 Basic Average Shares 1,180,000 Diluted Average Shares 1,185,500 Total Operating Income as Repo... 4,872,100 Rent Expense Supplemental 2,561,500 Total Expenses 24,403,400 Net Income from Continuing & ... 4,199,300 Normalized Income 3,655,126 Basic Average Shares 1,180,000 Diluted Average Shares 1,185,500 Total Operating Income as Repo... 4,872,100 Rent Expense Supplemental 2,561,500 Total Expenses 24,403,400 Net Income from Continuing & ... 4,199,300 Normalized Income 3,655,126 Interest Income 90,100 Interest Expense 469,800 Net Interest Income -379,700 EBIT 5,826,700 EBITDA Reconciled Cost of Revenue 20,587,200 Reconciled Depreciation 1,524,100 Net Income from Continuing Op... 4,199,300 Total Unusual Items Excluding G... 694,100 Total Unusual Items 694,100 Normalized EBITDA 6,656,700 Tax Rate for Calcs 0 Tax Effect of Unusual Items 149,926 The project is applying prospective analysis and computing ratio for company selected by group members. Please follow the steps and guidelines below when you are preparing the project. 1. Download the most recent annual report for three years (For example, you might start from year 2018, 2019 and 2020 if available). Note you have to look at more than one annual report to get enough years of data to do all the computation. 2. Compute the projection of income statement, balance sheet and statement of cash flow for year 2021 and 2022. 3. Calculate the following ratio for five years (2018, 2019, 2020, 2021 and 2022). Liquidity Profitability > Asset utilization and efficiency Capital structure and solvency 4. Carry out common size and trend analysis for selected years. 5. Brief explanation of computed projection and description of the overall ratio trend, common size and what it implies for current and future financial performanceStep by Step Solution
There are 3 Steps involved in it
Step: 1

Get Instant Access to Expert-Tailored Solutions
See step-by-step solutions with expert insights and AI powered tools for academic success
Step: 2

Step: 3

Ace Your Homework with AI
Get the answers you need in no time with our AI-driven, step-by-step assistance
Get Started


