

Answered step by step
Verified Expert Solution
Question
1 Approved Answer
I need this code done in C++, please and thank you! The covid. txt file contains the following information: Monday; 8242020;4; 17;3;1;25 Tuesday;8252020;3; 19;4;1;27 Wednesday;8262020;3;20;3;
I need this code done in C++, please and thank you!
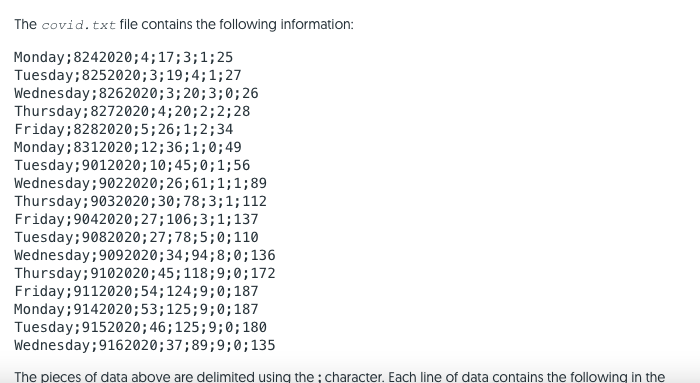
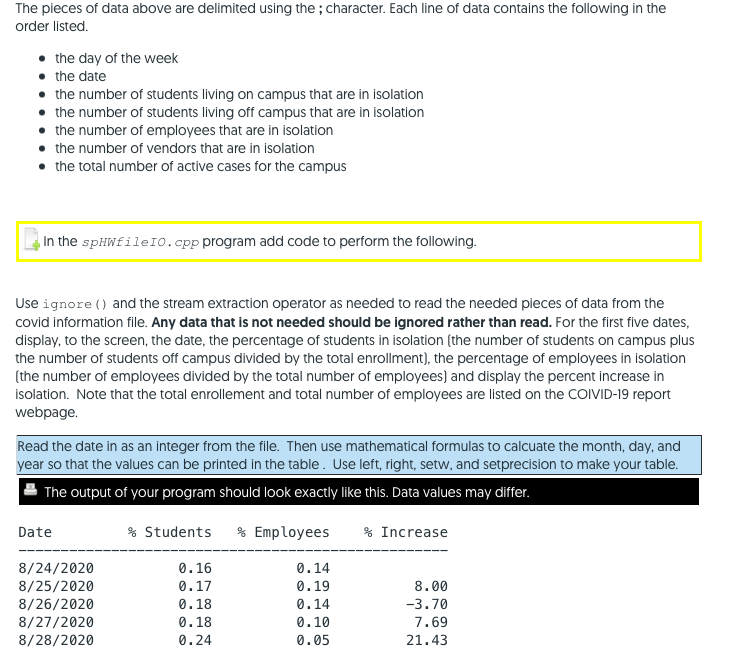
The covid. txt file contains the following information: Monday; 8242020;4; 17;3;1;25 Tuesday;8252020;3; 19;4;1;27 Wednesday;8262020;3;20;3; 0;26 Thursday; 8272020;4;20;2;2;28 Friday;8282020;5;26;1;2;34 Monday; 8312020; 12;36;1;0;49 Tuesday;9012020; 10;45;0;1;56 Wednesday; 9022020;26;61;1;1; 89 Thursday; 9032020;30; 78;3;1;112 Friday; 9042020;27;106;3;1;137 Tuesday; 9082020;27;78;5;0;110 Wednesday; 9092020;34; 94; 8;0; 136 Thursday; 9102020;45; 118; 9;0; 172 Friday: 9112020;54;124;9; 0; 187 Monday: 9142020;53; 125;9;0; 187 Tuesday;9152020;46;125; 9; 0; 180 Wednesday;9162020;37;89; 9;0; 135 The pieces of data above are delimited using the character. Each line of data contains the following in the The pieces of data above are delimited using the ; character. Each line of data contains the following in the order listed. the day of the week the date the number of students living on campus that are in isolation the number of students living off campus that are in isolation the number of employees that are in isolation the number of vendors that are in isolation the total number of active cases for the campus In the spHwfile10.cpp program add code to perform the following. Use ignore () and the stream extraction operator as needed to read the needed pieces of data from the covid information file. Any data that is not needed should be ignored rather than read. For the first five dates, display, to the screen, the date, the percentage of students in isolation (the number of students on campus plus the number of students off campus divided by the total enrollment), the percentage of employees in isolation (the number of employees divided by the total number of employees) and display the percent increase in isolation. Note that the total enrollement and total number of employees are listed on the COIVID-19 report webpage. Read the date in as an integer from the file. Then use mathematical formulas to calcuate the month, day, and year so that the values can be printed in the table. Use left, right, setw, and setprecision to make your table. The output of your program should look exactly like this. Data values may differ. Date % Students % Employees % Increase 8/24/2020 8/25/2020 8/26/2020 8/27/2020 8/28/2020 0.16 0.17 0.18 0.18 0.24 0.14 0.19 0.14 0.10 0.05 8.00 -3.70 7.69 21.43 The covid. txt file contains the following information: Monday; 8242020;4; 17;3;1;25 Tuesday;8252020;3; 19;4;1;27 Wednesday;8262020;3;20;3; 0;26 Thursday; 8272020;4;20;2;2;28 Friday;8282020;5;26;1;2;34 Monday; 8312020; 12;36;1;0;49 Tuesday;9012020; 10;45;0;1;56 Wednesday; 9022020;26;61;1;1; 89 Thursday; 9032020;30; 78;3;1;112 Friday; 9042020;27;106;3;1;137 Tuesday; 9082020;27;78;5;0;110 Wednesday; 9092020;34; 94; 8;0; 136 Thursday; 9102020;45; 118; 9;0; 172 Friday: 9112020;54;124;9; 0; 187 Monday: 9142020;53; 125;9;0; 187 Tuesday;9152020;46;125; 9; 0; 180 Wednesday;9162020;37;89; 9;0; 135 The pieces of data above are delimited using the character. Each line of data contains the following in the The pieces of data above are delimited using the ; character. Each line of data contains the following in the order listed. the day of the week the date the number of students living on campus that are in isolation the number of students living off campus that are in isolation the number of employees that are in isolation the number of vendors that are in isolation the total number of active cases for the campus In the spHwfile10.cpp program add code to perform the following. Use ignore () and the stream extraction operator as needed to read the needed pieces of data from the covid information file. Any data that is not needed should be ignored rather than read. For the first five dates, display, to the screen, the date, the percentage of students in isolation (the number of students on campus plus the number of students off campus divided by the total enrollment), the percentage of employees in isolation (the number of employees divided by the total number of employees) and display the percent increase in isolation. Note that the total enrollement and total number of employees are listed on the COIVID-19 report webpage. Read the date in as an integer from the file. Then use mathematical formulas to calcuate the month, day, and year so that the values can be printed in the table. Use left, right, setw, and setprecision to make your table. The output of your program should look exactly like this. Data values may differ. Date % Students % Employees % Increase 8/24/2020 8/25/2020 8/26/2020 8/27/2020 8/28/2020 0.16 0.17 0.18 0.18 0.24 0.14 0.19 0.14 0.10 0.05 8.00 -3.70 7.69 21.43Step by Step Solution
There are 3 Steps involved in it
Step: 1

Get Instant Access to Expert-Tailored Solutions
See step-by-step solutions with expert insights and AI powered tools for academic success
Step: 2

Step: 3
Ace Your Homework with AI
Get the answers you need in no time with our AI-driven, step-by-step assistance
Get Started
Expert Oracle Database Architecture
Authors: Thomas Kyte, Darl Kuhn
3rd Edition
1430262990, 9781430262992