Answered step by step
Verified Expert Solution
Question
1 Approved Answer
I need to change the colors in the stacked bar graph to light green (bottom), light yellow (middle), light red (top) In [13]: import matplotlib.pyplot
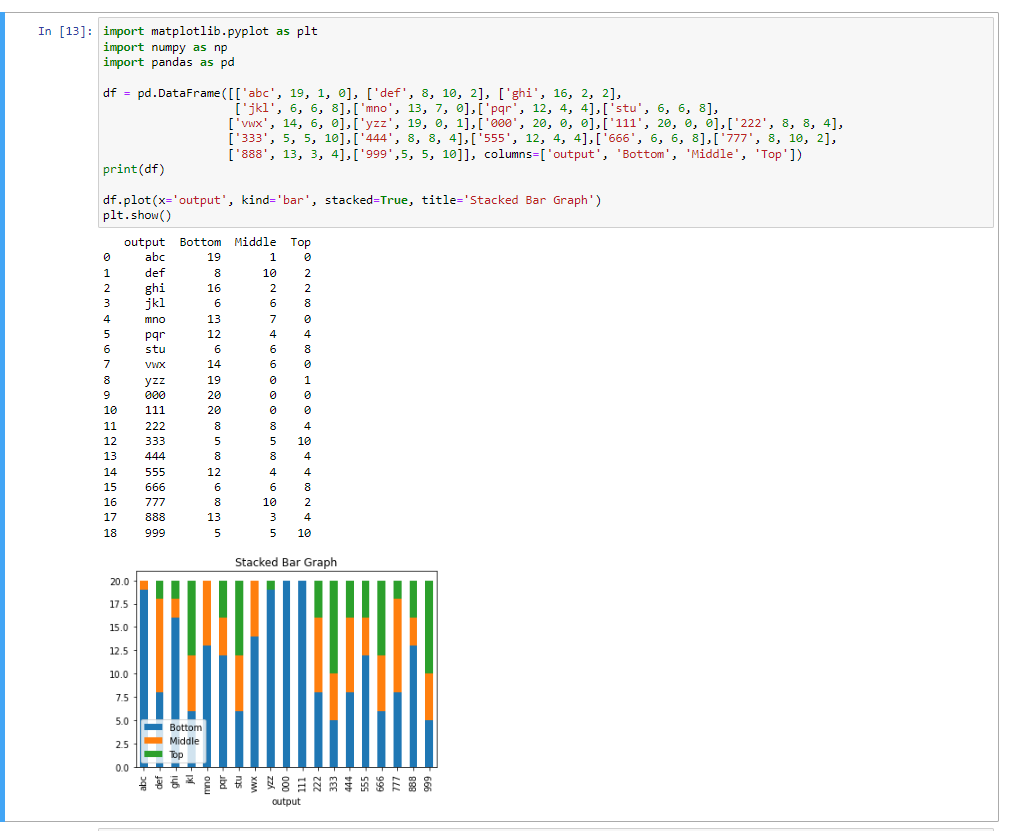
I need to change the colors in the stacked bar graph to light green (bottom), light yellow (middle), light red (top)

In [13]: import matplotlib.pyplot as plt import numpy as np import pandas as pd df = pd.DataFrame ([['abc', 19, 1, 0], ['def', 8, 10, 2], ['ghi', 16, 2, 2], print(df) df.plot(x=' output', kind='bar', stacked-True, title='Stacked Bar Graph') plt.show() 0 1 2 555 VASAEN output Bottom Middle Top abc 0 def ghi jkl mno pqr stu VWX yzz 000 111 20.0 17.5 15.0 12.5 10.0 7.5 5.0 2.5 0.0 222 333 444 555 666 777 888 999 Bottom Middle Top 19 8 16 6 13 23 12 6 14 19 20 20 8 5 8 ['jkl', 6, 6, 8],['mno', 13, 7, 0],['pqr, 12, 4, 4],[stu', 6, 6, 8], ['vwx', 14, 6, 0],['yzz', 19, 0, 1],['000, 20, 0, 0],['111', 20, 0, 0], [222, 8, 8, 4], ['333', 5, 5, 10],['444', 8, 8, 4],[555', 12, 4, 4],[666', 6, 6, 8],[777', 8, 10, 2], ['888, 13, 3, 4],['999,5, 5, 10]], columns=['output', 'Bottom', 'Middle', 'Top']) 12 6 8 13 5 1 10 2 6 7 4 6 6 0 0 0 2 2 2 8 0 4 7 output 8 0 1 0 a 8 4 5 10 8 4 4 6 10 3 5 10 4 8 2 4 Stacked Bar Graph
Step by Step Solution
There are 3 Steps involved in it
Step: 1
To change the colors in the stacked bar graph you can use the color parameter in t...
Get Instant Access to Expert-Tailored Solutions
See step-by-step solutions with expert insights and AI powered tools for academic success
Step: 2

Step: 3

Ace Your Homework with AI
Get the answers you need in no time with our AI-driven, step-by-step assistance
Get Started


