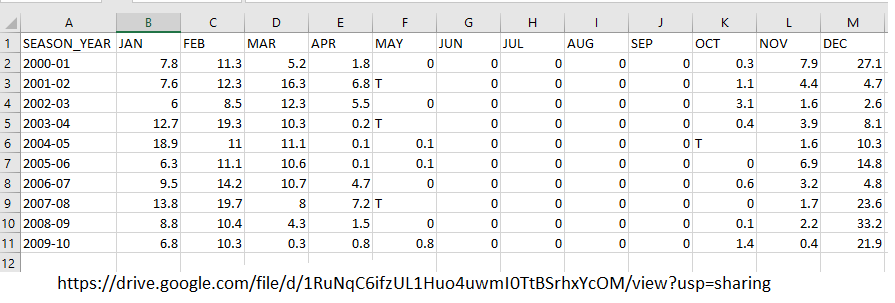
I need to desing a code that will read a CSV file and perform the the 3 cases scenarios outlined in the following pictures. The CSV file can be accesed/downloaded in the last picture. Thank you in advance.
This is what I have done so far. It is due in less than 24 hour. Help please
FILE_LOCATION = 'mycsvfile.csv'
MONTH_NAMES = {'JAN': 'January',
'FEB': 'February',
'MAR': 'March',
'APR': 'April',
'MAY': 'May',
'JUN': 'June',
'JUL': 'July',
'AUG': 'August',
'SEP': 'September',
'OCT': 'Octubre',
'NOV': 'November',
'DEC': 'December'
}
def main ():
#TODO: Open up the WI-00-SNOW.cvs file
open_csv_file('mycsvfile.csv')
#TODO: Get a list of the column names
#TODO: Display the column names to the user
#TODO: Get the user input for which column they want to view
#TODO: Get the corresponding column name for the user input
#TODO: Loop - if not in dictironary try again
#TODO: Get the row data based on the user input column enetered
#TODO: Get the year data
yearData =get_data(snowDataColumns.index(SEASON_YEAR), snowData, "String")
#TODO: Plot the data by passing the correct column for snow and year data
#TODO: Finally, close the cvs file
def read_column_data(csvFile, columnIndex):
csvFile.seek(0)
csvReader = csv.reader(csvFile, delimiter = ' , ')
columnData = []
for rowData in csvReader: #loop through all the rows in the csvFile
#TODO: Add correct column to the columnData to return
return columnData
def get_key_by_value(valueToFind, dictionary):
for key, value in dictionary.items():
if valueToFind == value:
return key
return " "
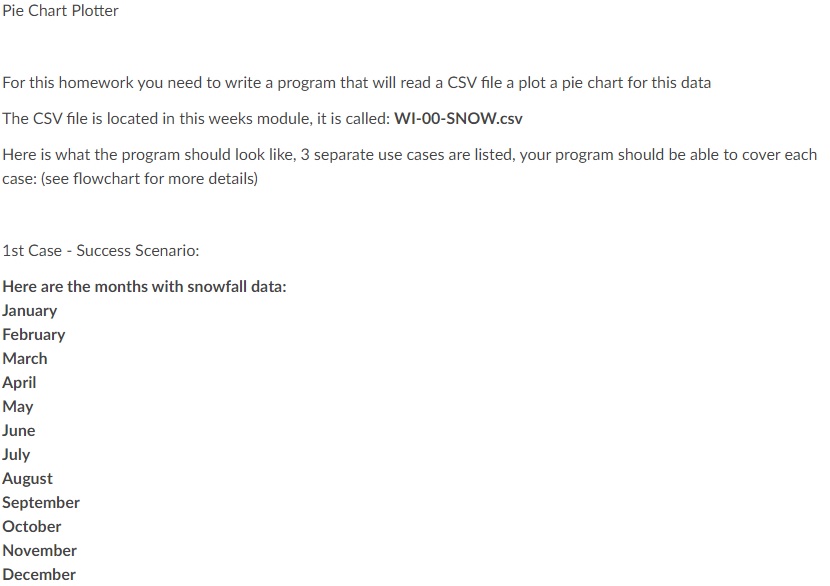
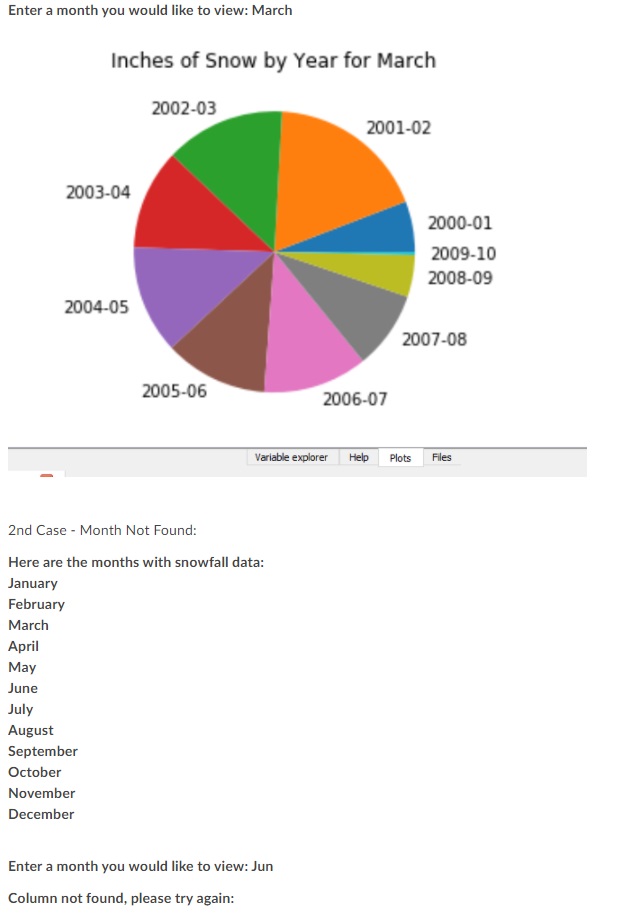
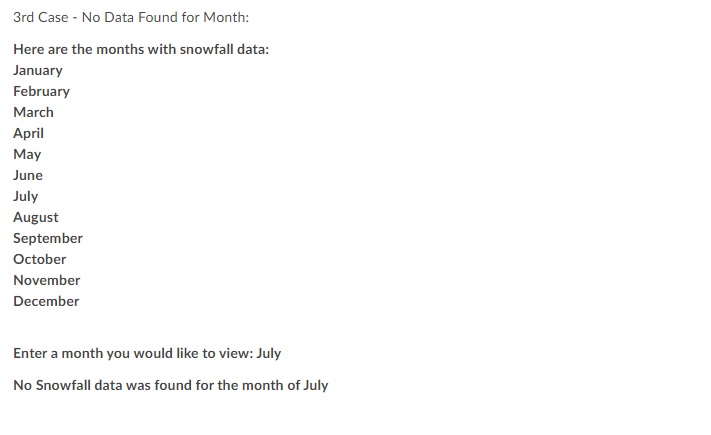
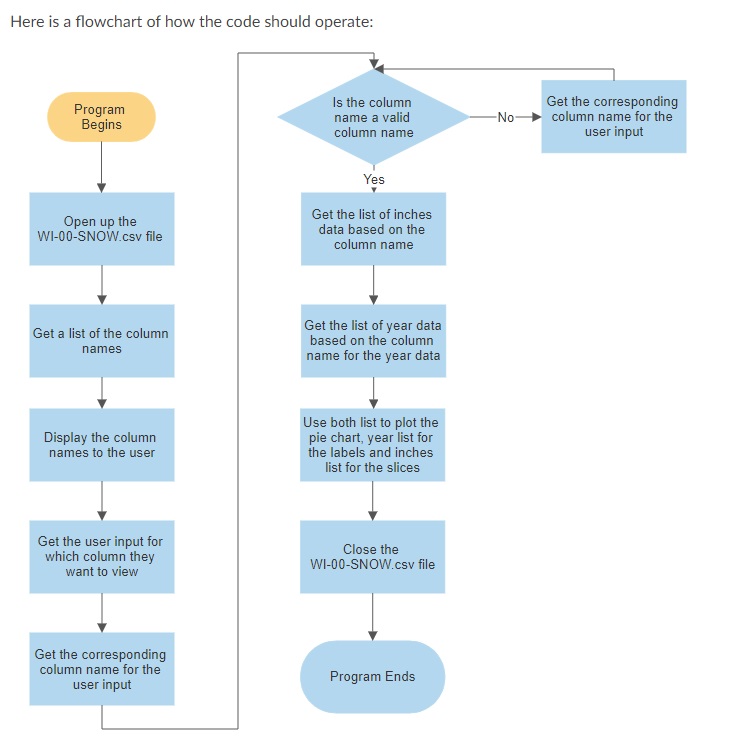
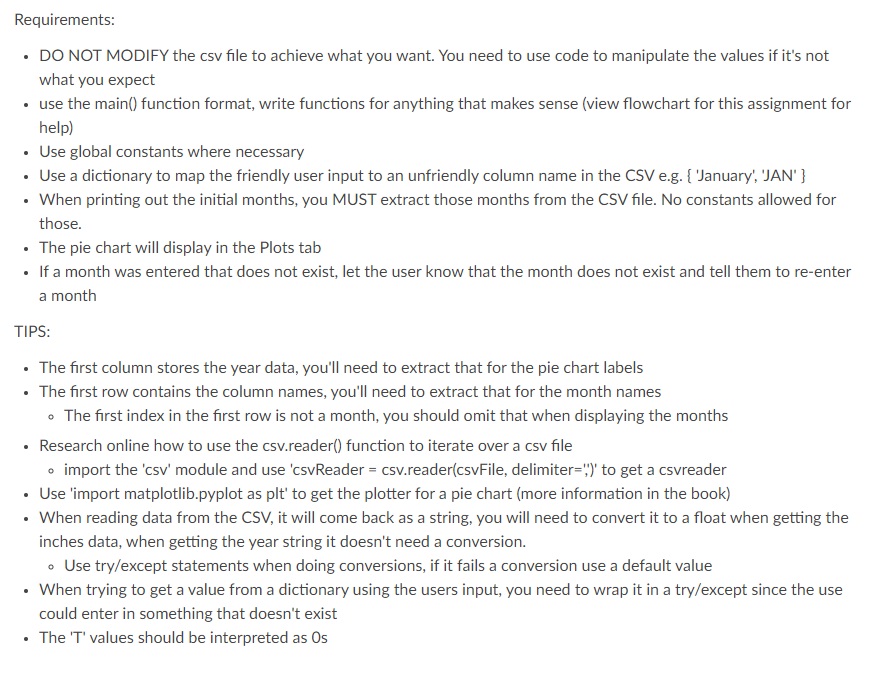
Pie Chart Plotter For this homework you need to write a program that will read a CSV file a plot a pie chart for this data The CSV file is located in this weeks module, it is called: WI-00-SNOW.csv Here is what the program should look like, 3 separate use cases are listed, your program should be able to cover each case: (see flowchart for more details) 1st Case - Success Scenario: Here are the months with snowfall data: January February March April May June July August September October November DecemberEnter a month you would like to view: March Inches of Snow by Year for March 2002-03 2001-02 2003-04 2000-01 2009-10 2008-09 2004-05 2007-08 2005-06 2006-07 Variable explorer Help Plots Files 2nd Case - Month Not Found: Here are the months with snowfall data: January February March April May June July August September October November December Enter a month you would like to view: Jun Column not found, please try again:3rd Case - No Data Found for Month: Here are the months with snowfall data: January February March April May June July August September October November December Enter a month you would like to view: July No Snowfall data was found for the month of JulyHere is a flowchart of how the code should operate: Program Is the column Get the corresponding Begins name a valid No- column name for the column name user input Yes Open up the Get the list of inches WI-00-SNOW.csv file data based on the column name Get a list of the column Get the list of year data names based on the column name for the year data Use both list to plot the Display the column pie chart, year list for names to the user the labels and inches list for the slices Get the user input for which column they Close the want to view WI-00-SNOW.csv file Get the corresponding column name for the user input Program EndsRequirements: . DO NOT MODIFY the csv file to achieve what you want. You need to use code to manipulate the values if it's not what you expect . use the main() function format, write functions for anything that makes sense (view flowchart for this assignment for help) . Use global constants where necessary . Use a dictionary to map the friendly user input to an unfriendly column name in the CSV e.g. { January', JAN' } . When printing out the initial months, you MUST extract those months from the CSV file. No constants allowed for those. . The pie chart will display in the Plots tab . If a month was entered that does not exist, let the user know that the month does not exist and tell them to re-enter a month TIPS: . The first column stores the year data, you'll need to extract that for the pie chart labels . The first row contains the column names, you'll need to extract that for the month names . The first index in the first row is not a month, you should omit that when displaying the months . Research online how to use the csv.reader() function to iterate over a csv file . import the 'csv' module and use 'csvReader = csv.reader(csvFile, delimiter=")' to get a csvreader . Use 'import matplotlib.pyplot as plt' to get the plotter for a pie chart (more information in the book) . When reading data from the CSV, it will come back as a string, you will need to convert it to a float when getting the inches data, when getting the year string it doesn't need a conversion. . Use try/except statements when doing conversions, if it fails a conversion use a default value . When trying to get a value from a dictionary using the users input, you need to wrap it in a try/except since the use could enter in something that doesn't exist . The 'T' values should be interpreted as Os\f