I need to do power calculation of my study. Or another words, I've examined a population and I need to calculate the power of it to know if I can treat this population as a normal study or just a pilot study. I've validated a test for the disease on 88 people (52 study group, 36 control group). And I have 3 prevalence categories: 1%, 7% and 15 percent. And I want to calculate the power of the study to better understand my study
You
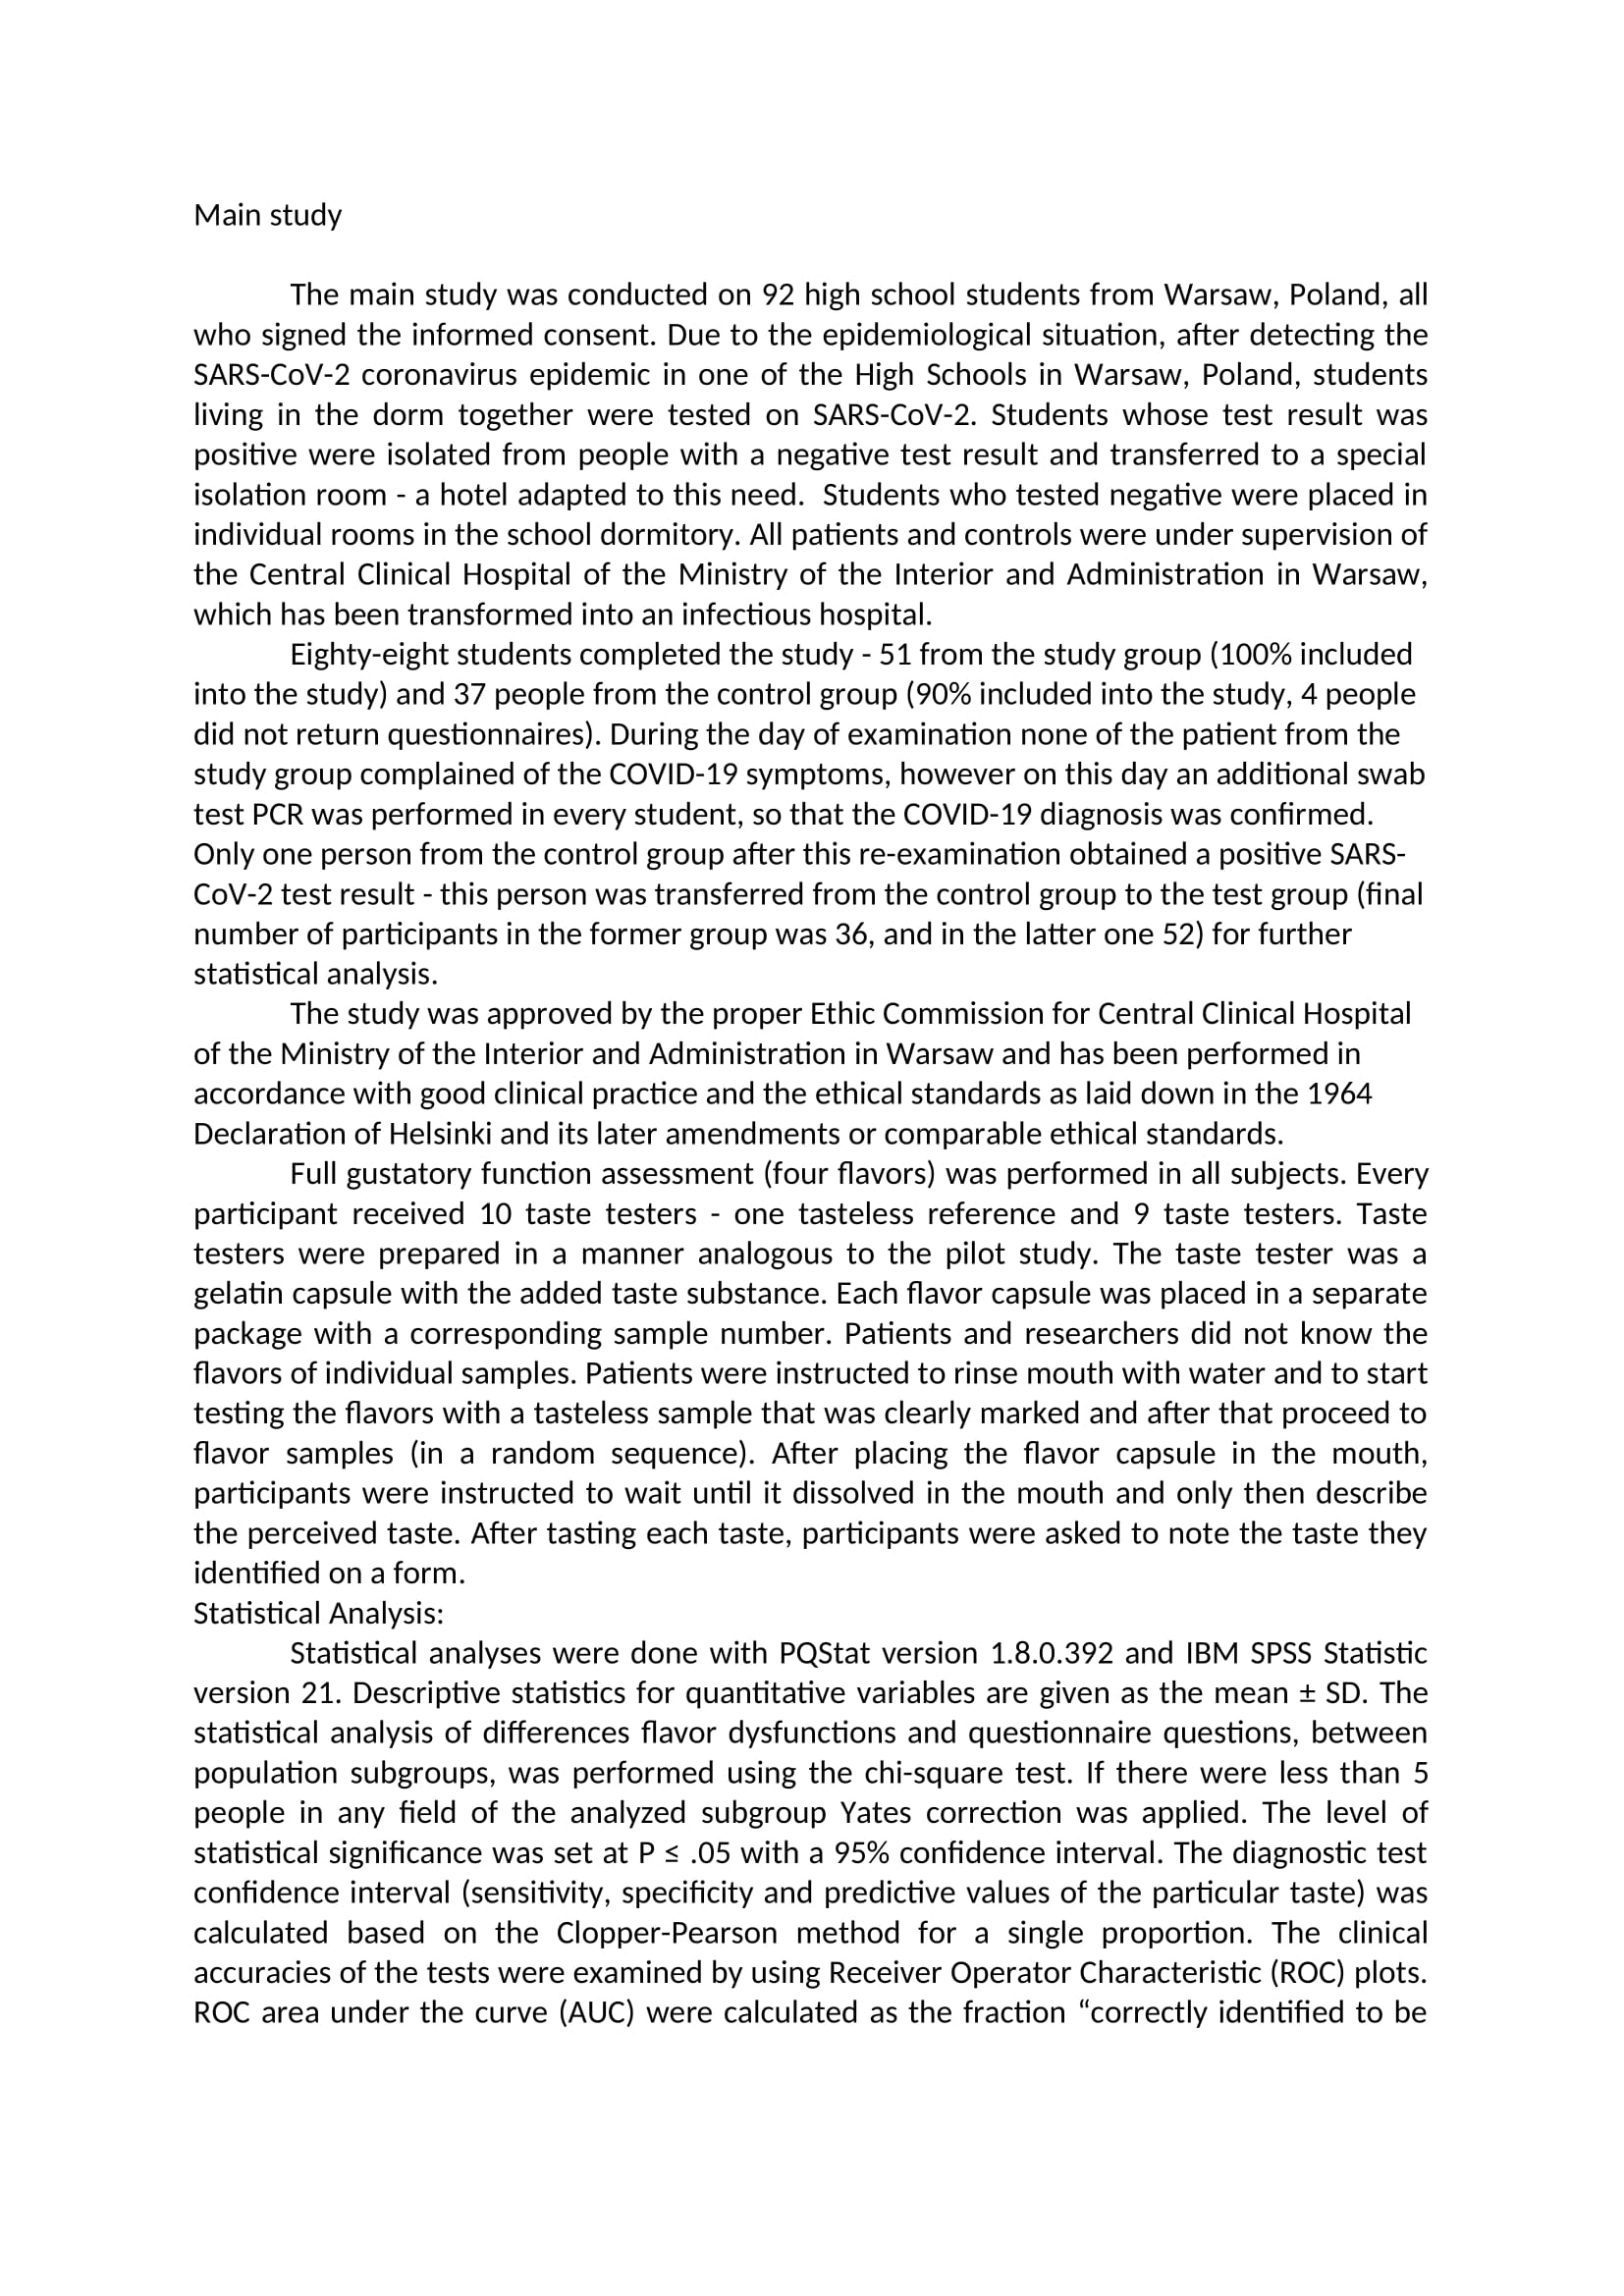
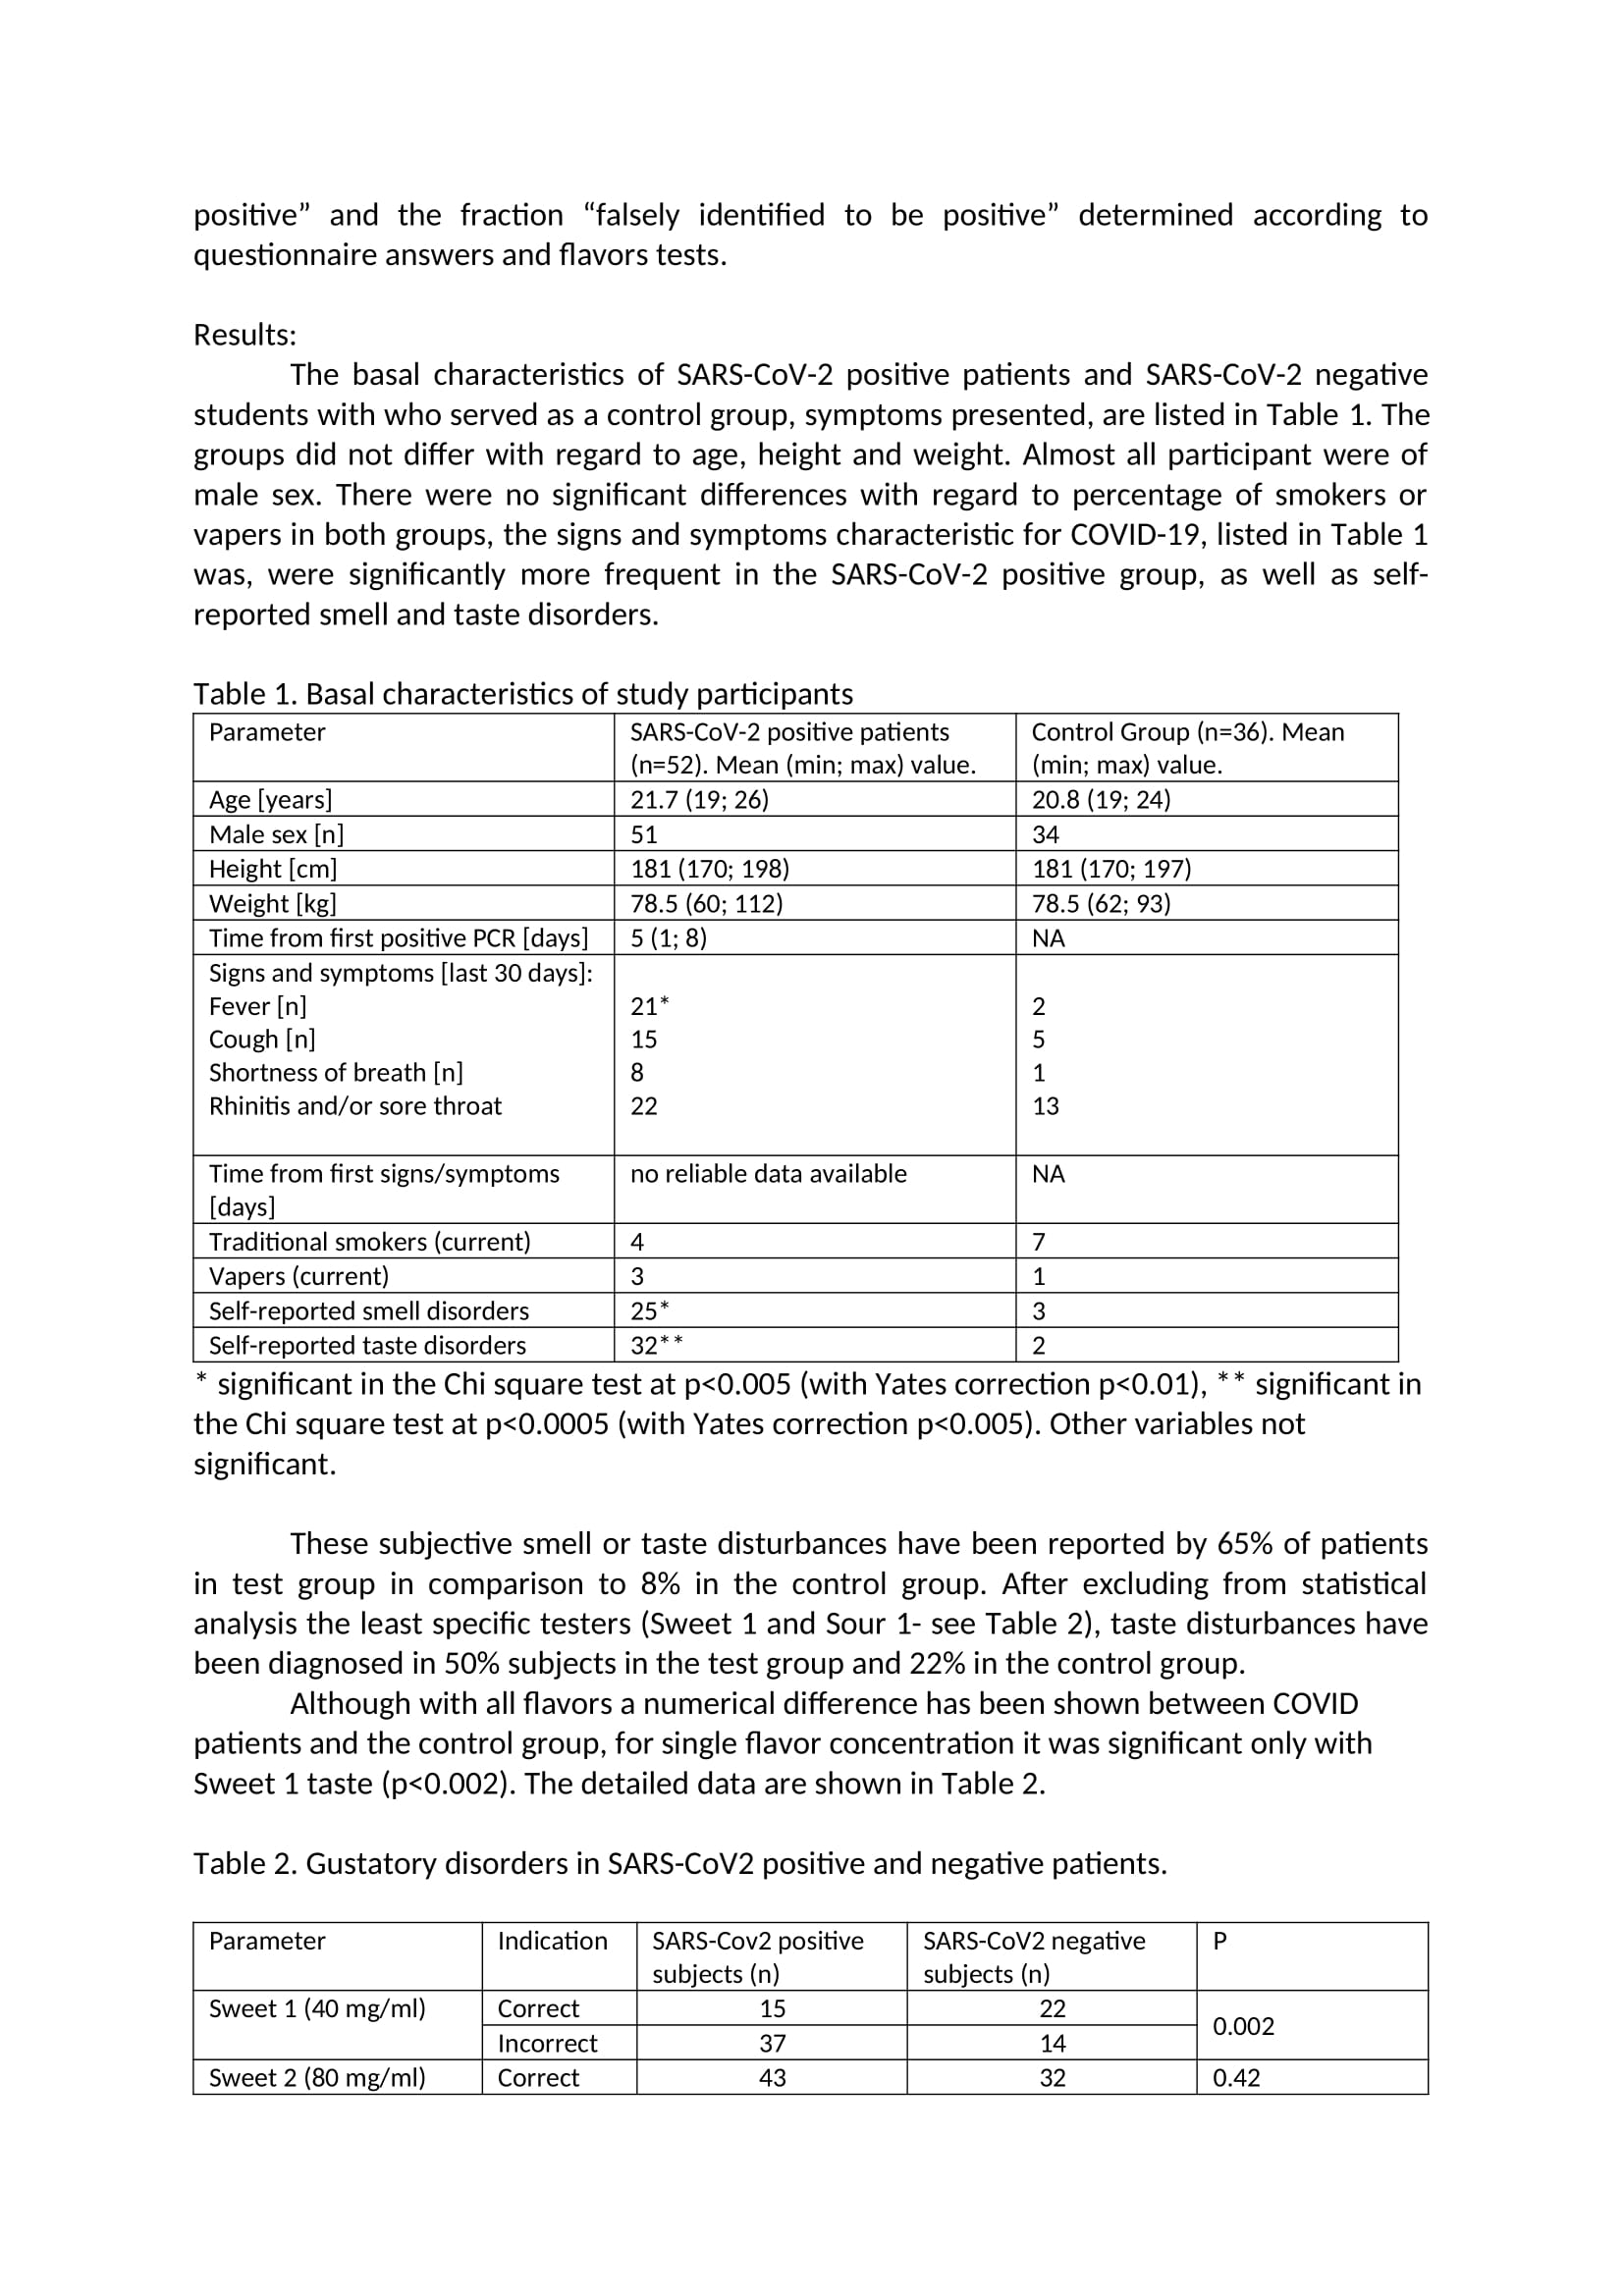
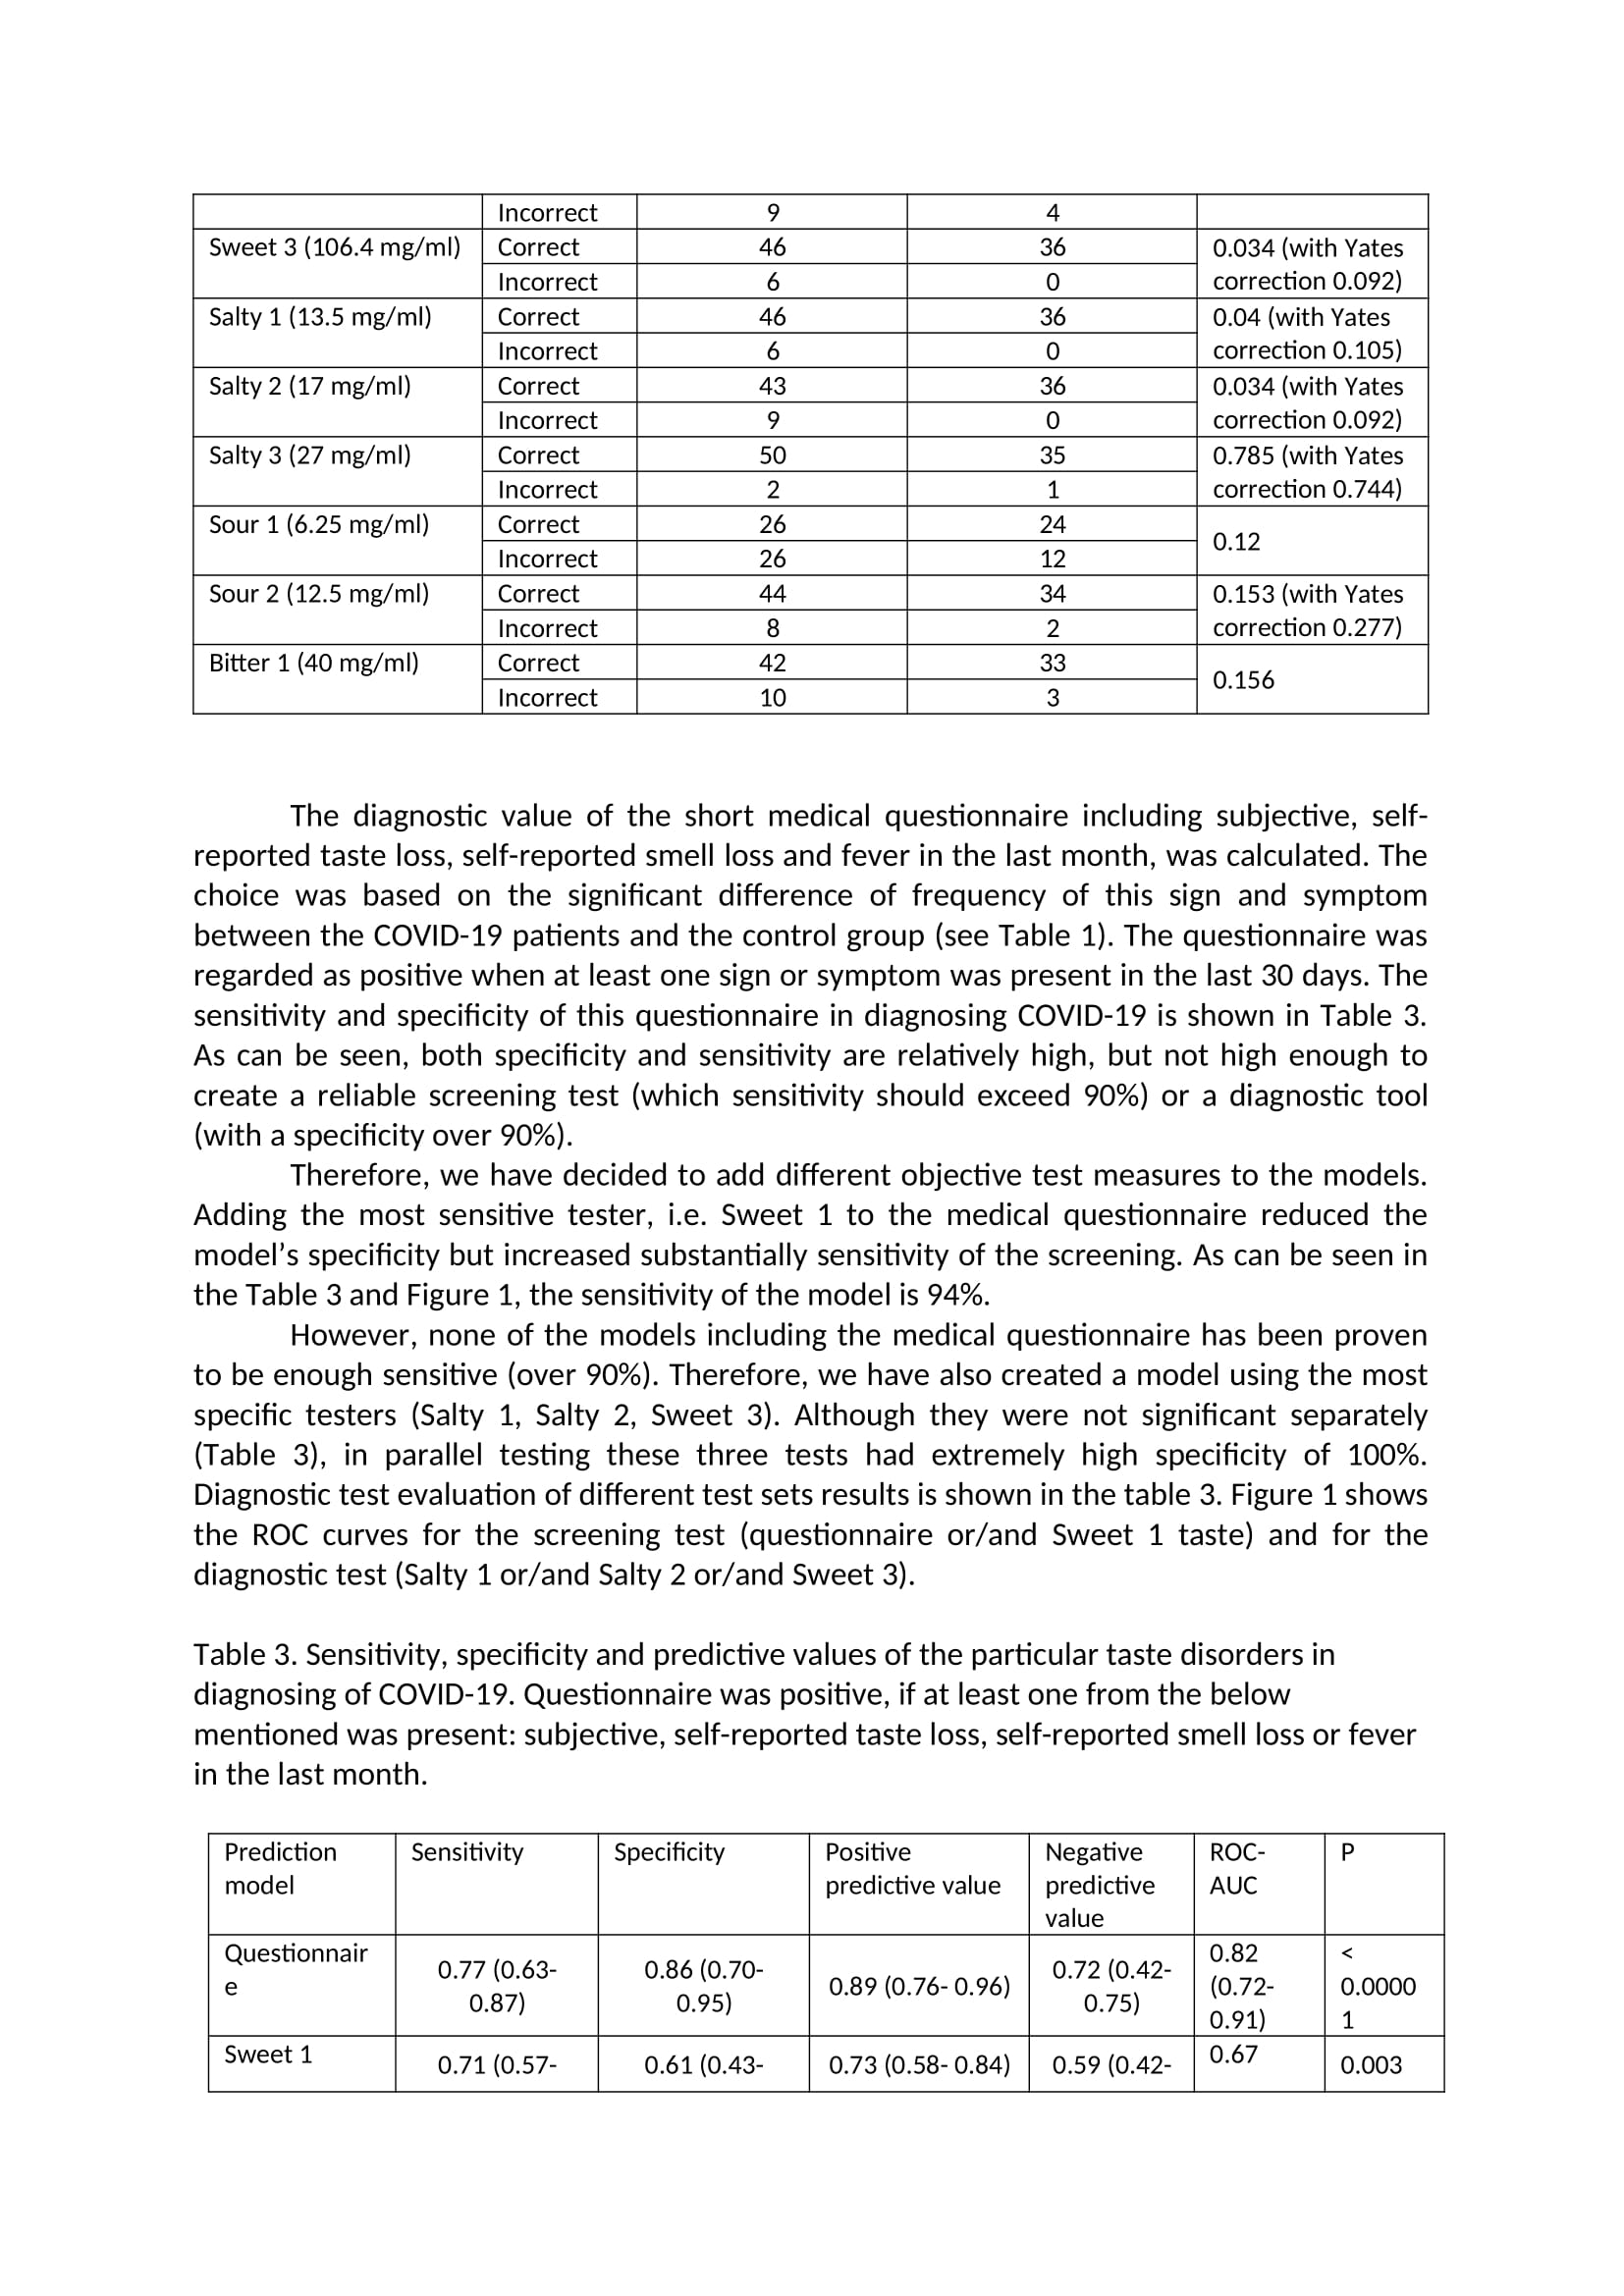
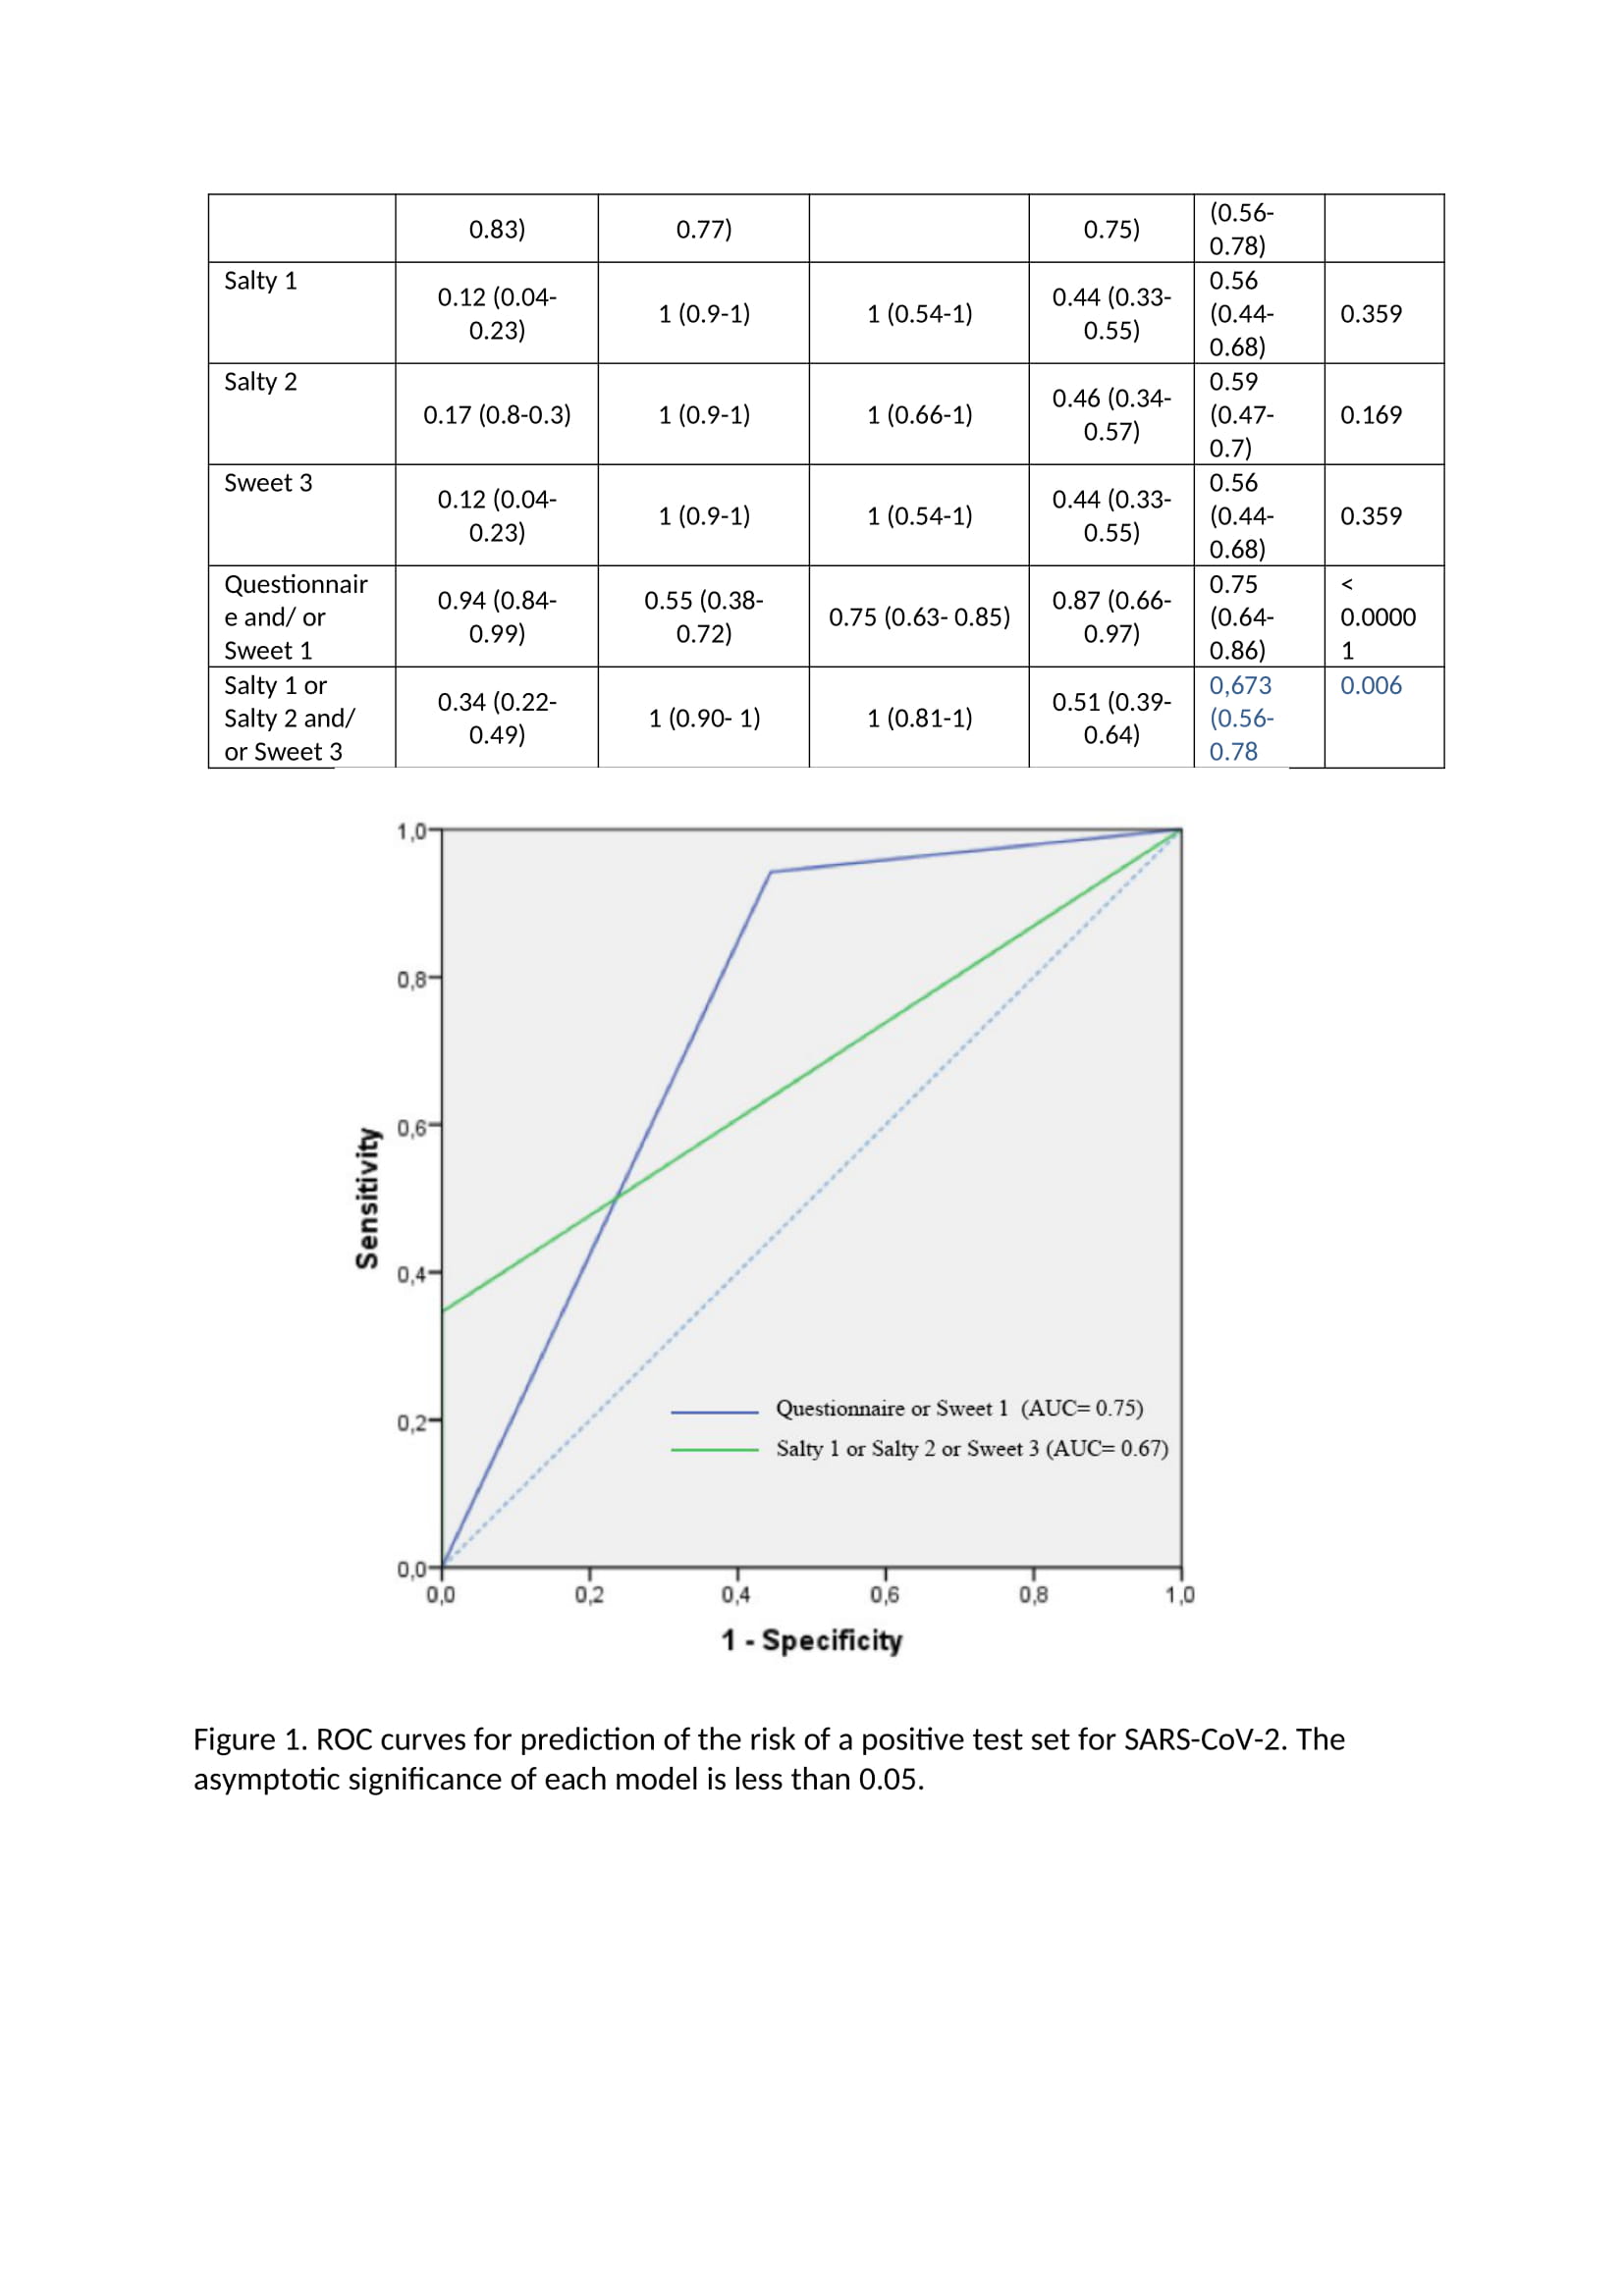
Main study The main study was conducted on 92 high school students from Warsaw, Poland, all who signed the informed consent. Due to the epidemiological situation, after detecting the SARS-CoV-2 coronavirus epidemic in one of the High Schools in Warsaw, Poland, students living in the dorm together were tested on SARS-CoV-2. Students whose test result was positive were isolated from people with a negative test result and transferred to a special isolation room - a hotel adapted to this need. Students who tested negative were placed in individual rooms in the school dormitory. All patients and controls were under supervision of the Central Clinical Hospital of the Ministry of the Interior and Administration in Warsaw, which has been transformed into an infectious hospital. Eighty-eight students completed the study - 51 from the study group (100% included into the study) and 37 people from the control group (90% included into the study, 4 people did not return questionnaires). During the day of examination none of the patient from the study group complained of the COVlD-19 symptoms, however on this day an additional swab test PCR was performed in every student, so that the COVlD-19 diagnosis was conrmed. Only one person from the control group after this reexamination obtained a positive SARS CoV2 test result this person was transferred from the control group to the test group (nal number of participants in the former group was 36, and in the latter one 52) for further statistical analysis. The study was approved by the proper Ethic Commission for Central Clinical Hospital of the Ministry of the Interior and Administration in Warsaw and has been performed in accordance with good clinical practice and the ethical standards as laid down in the 1964 Declaration of Helsinki and its later amendments or comparable ethical standards. Full gustatory function assessment (four flavors) was performed in all subjects. Every participant received 10 taste testers - one tasteless reference and 9 taste testers. Taste testers were prepared in a manner analogous to the pilot study. The taste tester was a gelatin capsule with the added taste substance. Each avor capsule was placed in a separate package with a corresponding sample number. Patients and researchers did not know the avors of individual samples. Patients were instructed to rinse mouth with water and to start testing the avors with a tasteless sample that was clearly marked and after that proceed to avor samples (in a random sequence). After placing the avor capsule in the mouth, participants were instructed to wait until it dissolved in the mouth and only then describe the perceived taste. After tasting each taste, participants were asked to note the taste they identied on a form. Statistical Analysis: Statistical analyses were done with PQStat version 1.8.0.392 and IBM SPSS Statistic version 21. Descriptive statistics for quantitative variables are given as the mean 1r SD. The statistical analysis of differences avor dysfunctions and questionnaire questions, between population subgroups, was performed using the chisquare test. If there were less than 5 people in any eld of the anaiyzed subgroup Yates correction was applied. The level of statistical signicance was set at P s .05 with a 95% condence interval. The diagnostic test condence interval (sensitivity, specicity and predictive values of the particular taste) was calculated based on the ClopperPearson method for a single proportion. The clinical accuracies of the tests were examined by using Receiver Operator Characteristic (ROC) plots. ROC area under the curve (AUC) were calculated as the fraction \"correctly identied to be positive" and the fraction "falsely identified to be positive" determined according to questionnaire answers and flavors tests. Results: The basal characteristics of SARS-CoV-2 positive patients and SARS-CoV-2 negative students with who served as a control group, symptoms presented, are listed in Table 1. The groups did not differ with regard to age, height and weight. Almost all participant were of male sex. There were no significant differences with regard to percentage of smokers or vapers in both groups, the signs and symptoms characteristic for COVID-19, listed in Table 1 was, were significantly more frequent in the SARS-CoV-2 positive group, as well as self- reported smell and taste disorders. Table 1. Basal characteristics of study participants Parameter SARS-COV-2 positive patients Control Group (n=36). Mean (n=52). Mean (min; max) value (min; max) value. Age [years] 21.7 (19; 26 20.8 (19; 24) Male sex [n 51 34 Height [cm 181 (170; 198) 181 (170; 197) Weight [kg] 78.5 (60; 112) 78.5 (62; 93) Time from first positive PCR [days] 5 (1; 8) NA Signs and symptoms [last 30 days] Fever [n] 21* Cough [n] 15 2 Shortness of breath [n] 8 1 Rhinitis and/or sore throat 22 13 Time from first signs/symptoms no reliable data available NA [days Traditional smokers (current) 7 Vapers (current) 3 Self-reported smell disorders 25* 3 Self-reported taste disorders 32* 2 significant in the Chi square test at p


